

Key Insights
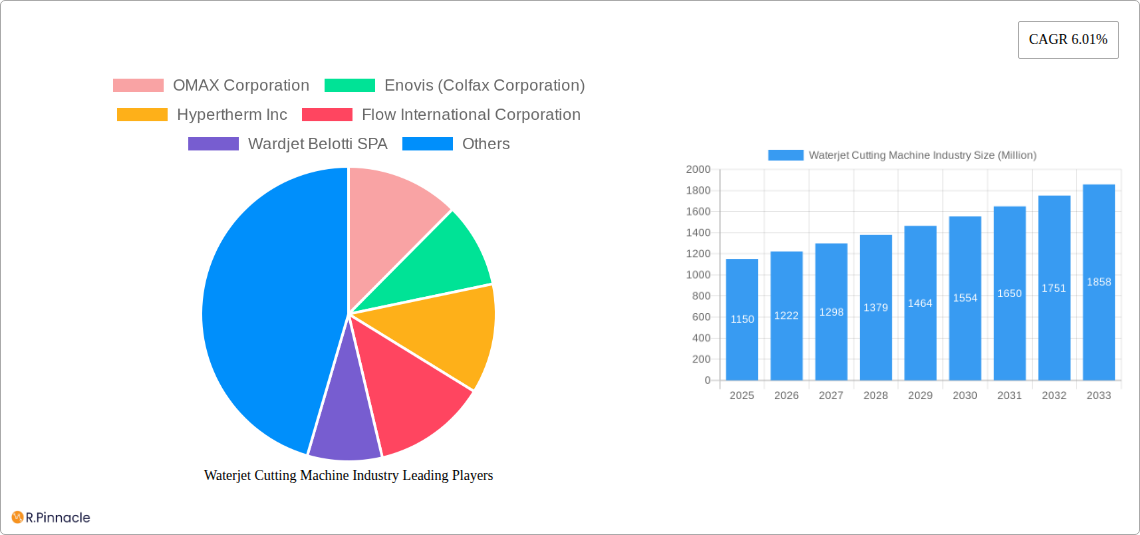
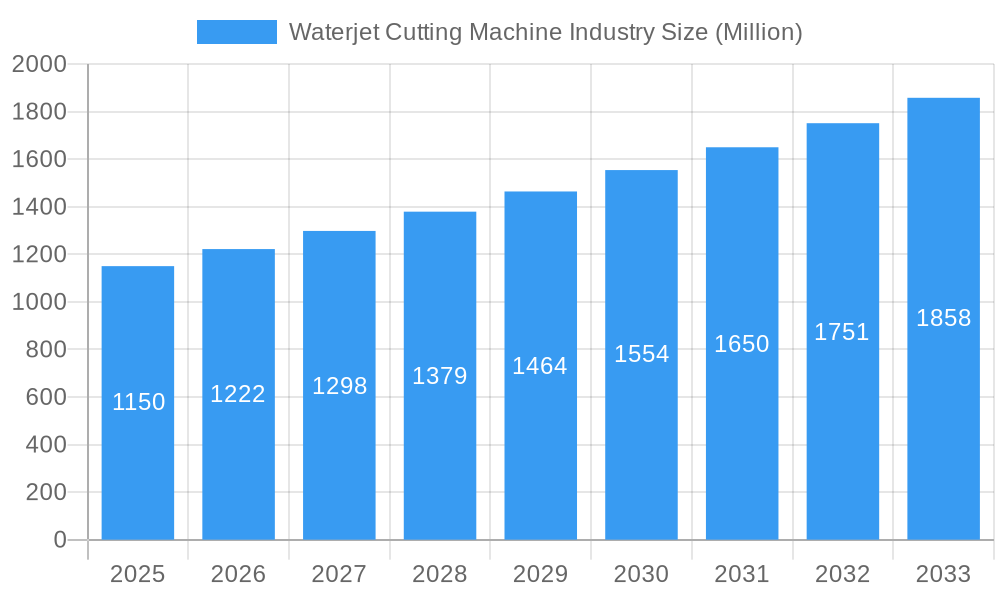
The waterjet cutting machine market, valued at $1.15 billion in 2025, is projected to experience robust growth, driven by increasing demand across diverse sectors. The 6.01% CAGR indicates a significant expansion over the forecast period (2025-2033). Key growth drivers include the rising adoption of waterjet cutting in automotive manufacturing for intricate part creation and aerospace applications requiring high-precision cuts. Furthermore, the expanding construction industry, requiring precise cutting of various materials like stone, metal, and composites, fuels market growth. The growing preference for waterjet cutting due to its ability to cut a wide range of materials without heat damage, minimizing material waste and improving overall efficiency, also contributes significantly. While the high initial investment cost of advanced waterjet cutting machines may pose a restraint, technological advancements leading to improved efficiency, reduced maintenance, and enhanced precision are mitigating this factor. The market is segmented by machine type (abrasive and non-abrasive), application (automotive, aerospace, construction, etc.), and region. Leading players like OMAX Corporation, Enovis, and Hypertherm Inc. are driving innovation and market expansion through technological advancements and strategic partnerships. The market’s future trajectory is optimistic, with continued growth fueled by technological advancements, expanding applications, and increasing adoption across various industries.
Waterjet Cutting Machine Industry Market Size (In Billion)
The competitive landscape is marked by both established players and emerging companies, leading to innovation in machine design, automation, and software integration. This competitive environment fosters efficiency improvements and cost reductions, making waterjet cutting more accessible across a wider range of industries. The adoption of Industry 4.0 technologies, like AI and IoT, is further enhancing the precision, efficiency, and automation capabilities of waterjet cutting machines, contributing to overall market expansion. Regional growth will vary, with developed economies in North America and Europe showing steady growth, while developing economies in Asia-Pacific are expected to witness rapid expansion due to increasing industrialization and infrastructure development. Continued research and development in abrasive materials and cutting head technology will further enhance the capabilities and versatility of waterjet cutting machines, sustaining the market's upward trajectory in the coming years.
Waterjet Cutting Machine Industry Company Market Share
This comprehensive report provides an in-depth analysis of the Waterjet Cutting Machine industry, covering market structure, dynamics, innovation trends, and future outlook from 2019 to 2033. The report leverages data from the historical period (2019-2024), base year (2025), and estimated year (2025) to project market growth until 2033. This analysis will prove invaluable for industry professionals, investors, and strategic decision-makers seeking to understand and navigate this dynamic market. The market is valued at approximately $xx Million in 2025 and is projected to reach $xx Million by 2033.
Waterjet Cutting Machine Industry Market Structure & Innovation Trends
The global waterjet cutting machine market is characterized by a moderately concentrated structure, with a few prominent players dominating a significant portion of the market revenue. Key companies such as OMAX Corporation, Flow International Corporation, and Hypertherm Inc. are at the forefront, collectively estimated to hold a substantial market share. The industry also benefits from the presence of numerous smaller, specialized manufacturers, contributing to a dynamic and diverse competitive environment. Innovation is a critical driver, with a continuous focus on enhancing cutting precision, boosting operational speed, and expanding compatibility with an ever-growing range of materials. The industry operates under stringent regulations, emphasizing safety protocols for high-pressure systems. While waterjet cutting offers distinct advantages in terms of versatility and material handling compared to substitutes like laser and plasma cutting, these alternative technologies continue to evolve. The end-user base is extensive, spanning critical sectors including aerospace, automotive, general manufacturing, and construction. Mergers and acquisitions (M&A) have been a moderate but significant trend, aimed at broadening market reach, integrating cutting-edge technologies, and fortifying product portfolios. The average deal value in M&A activities over the past few years indicates a strategic consolidation within the industry.
Waterjet Cutting Machine Industry Market Dynamics & Trends
The waterjet cutting machine market exhibits steady growth, driven by increasing demand across diverse industrial sectors. The Compound Annual Growth Rate (CAGR) is estimated at xx% during the forecast period (2025-2033). Market penetration remains highest in developed economies, particularly in North America and Europe, due to higher industrial automation adoption. Technological advancements, such as the development of more efficient and precise cutting heads and the integration of automation and advanced software, are key growth drivers. Consumer preferences are shifting towards machines with enhanced precision, reduced operating costs, and ease of use. Competitive dynamics are characterized by intense competition among established players and the emergence of new entrants offering innovative solutions. This leads to continuous product improvements and competitive pricing strategies.
Dominant Regions & Segments in Waterjet Cutting Machine Industry
Dominant Region: North America currently holds the largest market share, driven by robust industrial activity and high adoption rates of advanced manufacturing technologies. Key drivers include favorable economic policies, well-established infrastructure, and a strong focus on technological innovation within the manufacturing sector.
Dominant Segment: The ultrahigh-pressure waterjet cutting segment holds the largest market share due to its superior cutting capabilities and versatility.
North America's dominance stems from a confluence of factors. Firstly, the region boasts a large and mature manufacturing base, with a substantial presence of companies across diverse industries (aerospace, automotive, etc.) that rely heavily on waterjet cutting for precision machining. Secondly, strong government support for advanced manufacturing and R&D initiatives fosters innovation and adoption of newer technologies. Thirdly, the well-developed supply chain infrastructure and skilled workforce within the region further bolster the industry’s growth. Finally, the region’s relatively higher purchasing power and strong economic growth contribute to increased investment in technologically advanced equipment, including waterjet cutting machines.
Waterjet Cutting Machine Industry Product Innovations
The forefront of waterjet cutting technology is marked by a relentless pursuit of enhanced speed, superior precision, and advanced automation. A significant development includes the integration of 5-axis cutting capabilities, exemplified by solutions like Flow International Corporation's Mach 200c, enabling complex geometries and heightened operational efficiency. The advent of compact CNC waterjet cutters, such as those offered by WAZER, is democratizing access to this technology, opening new avenues for its application in smaller workshops, educational institutions, and prototyping environments. These innovations collectively contribute to optimized cutting performance, minimized material waste, and a substantial uplift in overall productivity, providing a distinct competitive edge to adopters. The ongoing demand for machines capable of processing a wider array of materials with unparalleled accuracy fuels continuous advancements in cutting head design and sophisticated software control systems.
Report Scope & Segmentation Analysis
This report segments the market based on several parameters:
By Type: Ultrahigh-pressure, High-pressure, and Low-pressure waterjet cutting machines. The ultrahigh-pressure segment exhibits the highest growth projection due to its superior cutting capabilities.
By Application: Aerospace, Automotive, Construction, Manufacturing (general), and others. The manufacturing segment dominates due to its broad applications across various industries.
By End-User: Large enterprises, SMEs, and individual users. Large enterprises account for the majority of market revenue.
Competitive dynamics vary across segments. In the ultrahigh-pressure segment, competition is primarily among established players, while the desktop CNC segment sees increasing competition from smaller, innovative companies.
Key Drivers of Waterjet Cutting Machine Industry Growth
The expansion of the waterjet cutting machine industry is propelled by a confluence of influential factors. Technological advancements, particularly the development of higher-pressure systems and more refined cutting heads, are pivotal in elevating efficiency and expanding cutting capabilities. The escalating demand for high-precision cutting across diverse industrial sectors, from the exacting requirements of aerospace to the evolving needs of automotive manufacturing, serves as a primary market driver. Furthermore, supportive government regulations and policies that encourage the adoption of advanced manufacturing technologies in various global regions play a crucial role. The increasing integration of automation and digitalization within industrial processes is another significant catalyst, leading to enhanced productivity and reduced operational expenditures.
Challenges in the Waterjet Cutting Machine Industry Sector
The waterjet cutting machine industry faces several challenges. High initial investment costs for advanced systems can deter some potential buyers, particularly smaller businesses. Supply chain disruptions and fluctuating raw material prices impact production costs and profitability. Intense competition among established and emerging players puts pressure on pricing and profit margins. Additionally, stringent safety regulations and environmental concerns necessitate significant compliance efforts, adding to operating expenses. These challenges contribute to slowing down the industry's growth rate slightly, although innovations and market expansions partially compensate for them.
Emerging Opportunities in Waterjet Cutting Machine Industry
The industry presents promising opportunities. The growing adoption of additive manufacturing and hybrid manufacturing processes creates synergistic opportunities for waterjet cutting machines in finishing and prototyping. The expansion into new application areas, such as renewable energy and medical devices, opens up substantial market potential. Developing sustainable and environmentally friendly waterjet cutting solutions caters to increasing environmental concerns. Furthermore, innovations in software and automation offer opportunities to improve efficiency and reduce operating costs. These opportunities collectively indicate a positive growth outlook for the coming years.
Leading Players in the Waterjet Cutting Machine Industry Market
- OMAX Corporation
- Enovis (formerly part of Colfax Corporation)
- Hypertherm Inc
- Flow International Corporation
- Wardjet
- Belotti S.p.A.
- KMT Waterjet
- Resato International B.V.
- Jet Edge Inc.
- Dardi International Corporation
- Jekran Ltd.
- International Waterjet Machines
- Kennametal Inc.
- CERATIZIT S.à r.l.
- GMA Garnet Pty Ltd
- Hornet Cutting Systems
List Not Exhaustive
Key Developments in Waterjet Cutting Machine Industry
July 2024: WECJet unveils its Mach 500 waterjet cutting machine, boasting 90,000 psi Dynamic head-cutting technology, setting a new benchmark for speed and capacity.
November 2023: TriMech begins selling and supporting WAZER, the world's first desktop CNC waterjet cutter, expanding accessibility to this technology.
May 2023: Flow International Corporation launches the Mach 200c, a competitively priced 5-axis cutting system, demonstrating ongoing innovation in precision cutting.
These developments reflect the continuous innovation and expansion of the waterjet cutting machine market, highlighting both technological advancements and broadened market access.
Future Outlook for Waterjet Cutting Machine Industry Market
The waterjet cutting machine market is projected for sustained and robust growth, fueled by ongoing technological innovations, expanding applications across a multitude of industries, and the development of more specialized solutions. Key strategic opportunities lie in the creation of more energy-efficient, environmentally sustainable, and user-friendly systems. Further integration with other advanced manufacturing processes and a heightened focus on automation will continue to bolster market competitiveness. The future potential of this market is substantial, driven by the persistent and growing requirement for precision cutting in diverse industrial segments and the relentless pace of technological advancement.
Waterjet Cutting Machine Industry Segmentation
-
1. Product Type
- 1.1. Robotic Waterjet Cutting
- 1.2. 3D Waterjet Cutting
- 1.3. Micro Waterjet Cutting
-
2. End-User
- 2.1. Automative
- 2.2. Electronics
- 2.3. Aerospace
- 2.4. Construction
- 2.5. Mining Industry
- 2.6. Other Industries
Waterjet Cutting Machine Industry Segmentation By Geography
-
1. North America
- 1.1. United States
- 1.2. Canada
- 1.3. Mexico
- 1.4. Rest of North America
-
2. South America
- 2.1. Brazil
- 2.2. Argentina
-
3. Europe
- 3.1. Germany
- 3.2. United Kingdom
- 3.3. France
- 3.4. Russia
- 3.5. Spain
- 3.6. Rest of Europe
-
4. Asia Pacific
- 4.1. India
- 4.2. China
- 4.3. Japan
- 4.4. Rest of Asia Pacific
-
5. Middle East
- 5.1. United Arab Emirates
- 5.2. Saudi Arabia
- 5.3. Rest of the Middle East
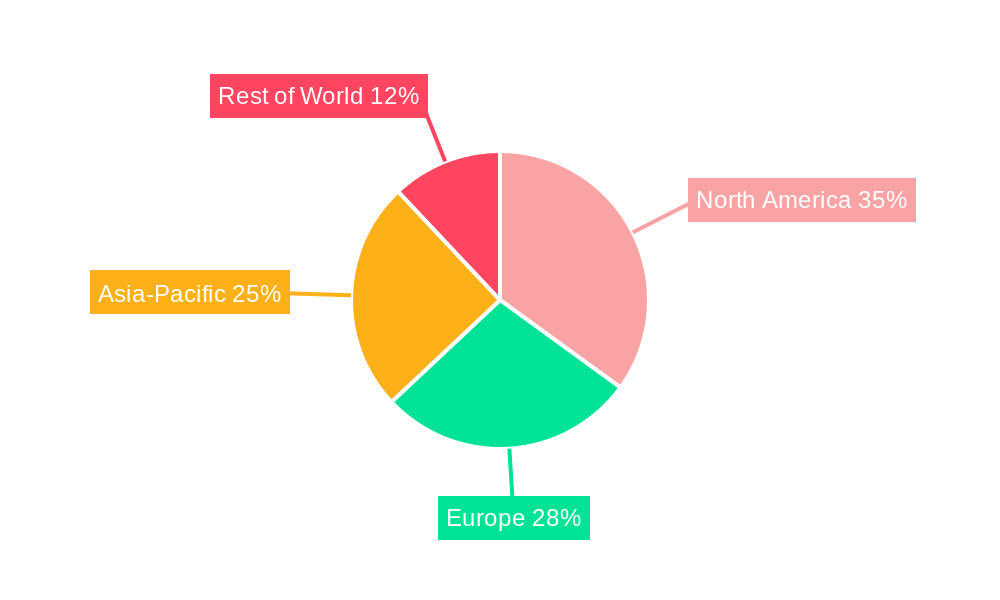
Waterjet Cutting Machine Industry Regional Market Share
Geographic Coverage of Waterjet Cutting Machine Industry
Waterjet Cutting Machine Industry REPORT HIGHLIGHTS
| Aspects | Details |
|---|---|
| Study Period | 2020-2034 |
| Base Year | 2025 |
| Estimated Year | 2026 |
| Forecast Period | 2026-2034 |
| Historical Period | 2020-2025 |
| Growth Rate | CAGR of 6.01% from 2020-2034 |
| Segmentation |
|
Table of Contents
- 1. Introduction
- 1.1. Research Scope
- 1.2. Market Segmentation
- 1.3. Research Objective
- 1.4. Definitions and Assumptions
- 2. Executive Summary
- 2.1. Market Snapshot
- 3. Market Dynamics
- 3.1. Market Drivers
- 3.2. Market Restrains
- 3.3. Market Trends
- 3.4. Market Opportunities
- 4. Market Factor Analysis
- 4.1. Porters Five Forces
- 4.1.1. Bargaining Power of Suppliers
- 4.1.2. Bargaining Power of Buyers
- 4.1.3. Threat of New Entrants
- 4.1.4. Threat of Substitutes
- 4.1.5. Competitive Rivalry
- 4.2. PESTEL analysis
- 4.3. BCG Analysis
- 4.3.1. Stars (High Growth, High Market Share)
- 4.3.2. Cash Cows (Low Growth, High Market Share)
- 4.3.3. Question Mark (High Growth, Low Market Share)
- 4.3.4. Dogs (Low Growth, Low Market Share)
- 4.4. Ansoff Matrix Analysis
- 4.5. Supply Chain Analysis
- 4.6. Regulatory Landscape
- 4.7. Current Market Potential and Opportunity Assessment (TAM–SAM–SOM Framework)
- 4.8. PRI Analyst Note
- 4.1. Porters Five Forces
- 5. Market Analysis, Insights and Forecast 2021-2033
- 5.1. Market Analysis, Insights and Forecast - by Product Type
- 5.1.1. Robotic Waterjet Cutting
- 5.1.2. 3D Waterjet Cutting
- 5.1.3. Micro Waterjet Cutting
- 5.2. Market Analysis, Insights and Forecast - by End-User
- 5.2.1. Automative
- 5.2.2. Electronics
- 5.2.3. Aerospace
- 5.2.4. Construction
- 5.2.5. Mining Industry
- 5.2.6. Other Industries
- 5.3. Market Analysis, Insights and Forecast - by Region
- 5.3.1. North America
- 5.3.2. South America
- 5.3.3. Europe
- 5.3.4. Asia Pacific
- 5.3.5. Middle East
- 5.1. Market Analysis, Insights and Forecast - by Product Type
- 6. Global Waterjet Cutting Machine Industry Analysis, Insights and Forecast, 2021-2033
- 6.1. Market Analysis, Insights and Forecast - by Product Type
- 6.1.1. Robotic Waterjet Cutting
- 6.1.2. 3D Waterjet Cutting
- 6.1.3. Micro Waterjet Cutting
- 6.2. Market Analysis, Insights and Forecast - by End-User
- 6.2.1. Automative
- 6.2.2. Electronics
- 6.2.3. Aerospace
- 6.2.4. Construction
- 6.2.5. Mining Industry
- 6.2.6. Other Industries
- 6.1. Market Analysis, Insights and Forecast - by Product Type
- 7. North America Waterjet Cutting Machine Industry Analysis, Insights and Forecast, 2020-2032
- 7.1. Market Analysis, Insights and Forecast - by Product Type
- 7.1.1. Robotic Waterjet Cutting
- 7.1.2. 3D Waterjet Cutting
- 7.1.3. Micro Waterjet Cutting
- 7.2. Market Analysis, Insights and Forecast - by End-User
- 7.2.1. Automative
- 7.2.2. Electronics
- 7.2.3. Aerospace
- 7.2.4. Construction
- 7.2.5. Mining Industry
- 7.2.6. Other Industries
- 7.1. Market Analysis, Insights and Forecast - by Product Type
- 8. South America Waterjet Cutting Machine Industry Analysis, Insights and Forecast, 2020-2032
- 8.1. Market Analysis, Insights and Forecast - by Product Type
- 8.1.1. Robotic Waterjet Cutting
- 8.1.2. 3D Waterjet Cutting
- 8.1.3. Micro Waterjet Cutting
- 8.2. Market Analysis, Insights and Forecast - by End-User
- 8.2.1. Automative
- 8.2.2. Electronics
- 8.2.3. Aerospace
- 8.2.4. Construction
- 8.2.5. Mining Industry
- 8.2.6. Other Industries
- 8.1. Market Analysis, Insights and Forecast - by Product Type
- 9. Europe Waterjet Cutting Machine Industry Analysis, Insights and Forecast, 2020-2032
- 9.1. Market Analysis, Insights and Forecast - by Product Type
- 9.1.1. Robotic Waterjet Cutting
- 9.1.2. 3D Waterjet Cutting
- 9.1.3. Micro Waterjet Cutting
- 9.2. Market Analysis, Insights and Forecast - by End-User
- 9.2.1. Automative
- 9.2.2. Electronics
- 9.2.3. Aerospace
- 9.2.4. Construction
- 9.2.5. Mining Industry
- 9.2.6. Other Industries
- 9.1. Market Analysis, Insights and Forecast - by Product Type
- 10. Asia Pacific Waterjet Cutting Machine Industry Analysis, Insights and Forecast, 2020-2032
- 10.1. Market Analysis, Insights and Forecast - by Product Type
- 10.1.1. Robotic Waterjet Cutting
- 10.1.2. 3D Waterjet Cutting
- 10.1.3. Micro Waterjet Cutting
- 10.2. Market Analysis, Insights and Forecast - by End-User
- 10.2.1. Automative
- 10.2.2. Electronics
- 10.2.3. Aerospace
- 10.2.4. Construction
- 10.2.5. Mining Industry
- 10.2.6. Other Industries
- 10.1. Market Analysis, Insights and Forecast - by Product Type
- 11. Middle East Waterjet Cutting Machine Industry Analysis, Insights and Forecast, 2020-2032
- 11.1. Market Analysis, Insights and Forecast - by Product Type
- 11.1.1. Robotic Waterjet Cutting
- 11.1.2. 3D Waterjet Cutting
- 11.1.3. Micro Waterjet Cutting
- 11.2. Market Analysis, Insights and Forecast - by End-User
- 11.2.1. Automative
- 11.2.2. Electronics
- 11.2.3. Aerospace
- 11.2.4. Construction
- 11.2.5. Mining Industry
- 11.2.6. Other Industries
- 11.1. Market Analysis, Insights and Forecast - by Product Type
- 12. Competitive Analysis
- 12.1. Company Profiles
- 12.1.1 OMAX Corporation
- 12.1.1.1. Company Overview
- 12.1.1.2. Products
- 12.1.1.3. Company Financials
- 12.1.1.4. SWOT Analysis
- 12.1.2 Enovis (Colfax Corporation)
- 12.1.2.1. Company Overview
- 12.1.2.2. Products
- 12.1.2.3. Company Financials
- 12.1.2.4. SWOT Analysis
- 12.1.3 Hypertherm Inc
- 12.1.3.1. Company Overview
- 12.1.3.2. Products
- 12.1.3.3. Company Financials
- 12.1.3.4. SWOT Analysis
- 12.1.4 Flow International Corporation
- 12.1.4.1. Company Overview
- 12.1.4.2. Products
- 12.1.4.3. Company Financials
- 12.1.4.4. SWOT Analysis
- 12.1.5 Wardjet Belotti SPA
- 12.1.5.1. Company Overview
- 12.1.5.2. Products
- 12.1.5.3. Company Financials
- 12.1.5.4. SWOT Analysis
- 12.1.6 KMT Waterjet
- 12.1.6.1. Company Overview
- 12.1.6.2. Products
- 12.1.6.3. Company Financials
- 12.1.6.4. SWOT Analysis
- 12.1.7 Resato International B V
- 12.1.7.1. Company Overview
- 12.1.7.2. Products
- 12.1.7.3. Company Financials
- 12.1.7.4. SWOT Analysis
- 12.1.8 Jet Edge Inc
- 12.1.8.1. Company Overview
- 12.1.8.2. Products
- 12.1.8.3. Company Financials
- 12.1.8.4. SWOT Analysis
- 12.1.9 Dardi International Corporation
- 12.1.9.1. Company Overview
- 12.1.9.2. Products
- 12.1.9.3. Company Financials
- 12.1.9.4. SWOT Analysis
- 12.1.10 Jekran Ltd
- 12.1.10.1. Company Overview
- 12.1.10.2. Products
- 12.1.10.3. Company Financials
- 12.1.10.4. SWOT Analysis
- 12.1.11 International Waterjet Machines
- 12.1.11.1. Company Overview
- 12.1.11.2. Products
- 12.1.11.3. Company Financials
- 12.1.11.4. SWOT Analysis
- 12.1.12 Kennametal Inc
- 12.1.12.1. Company Overview
- 12.1.12.2. Products
- 12.1.12.3. Company Financials
- 12.1.12.4. SWOT Analysis
- 12.1.13 CERATIZIT S A
- 12.1.13.1. Company Overview
- 12.1.13.2. Products
- 12.1.13.3. Company Financials
- 12.1.13.4. SWOT Analysis
- 12.1.14 GMA Garnet Pty Ltd
- 12.1.14.1. Company Overview
- 12.1.14.2. Products
- 12.1.14.3. Company Financials
- 12.1.14.4. SWOT Analysis
- 12.1.15 Hornet Cutting Systems**List Not Exhaustive
- 12.1.15.1. Company Overview
- 12.1.15.2. Products
- 12.1.15.3. Company Financials
- 12.1.15.4. SWOT Analysis
- 12.1.1 OMAX Corporation
- 12.2. Market Entropy
- 12.2.1 Company's Key Areas Served
- 12.2.2 Recent Developments
- 12.3. Company Market Share Analysis 2025
- 12.3.1 Top 5 Companies Market Share Analysis
- 12.3.2 Top 3 Companies Market Share Analysis
- 12.4. List of Potential Customers
- 13. Research Methodology
List of Figures
- Figure 1: Global Waterjet Cutting Machine Industry Revenue Breakdown (Million, %) by Region 2025 & 2033
- Figure 2: Global Waterjet Cutting Machine Industry Volume Breakdown (Billion, %) by Region 2025 & 2033
- Figure 3: North America Waterjet Cutting Machine Industry Revenue (Million), by Product Type 2025 & 2033
- Figure 4: North America Waterjet Cutting Machine Industry Volume (Billion), by Product Type 2025 & 2033
- Figure 5: North America Waterjet Cutting Machine Industry Revenue Share (%), by Product Type 2025 & 2033
- Figure 6: North America Waterjet Cutting Machine Industry Volume Share (%), by Product Type 2025 & 2033
- Figure 7: North America Waterjet Cutting Machine Industry Revenue (Million), by End-User 2025 & 2033
- Figure 8: North America Waterjet Cutting Machine Industry Volume (Billion), by End-User 2025 & 2033
- Figure 9: North America Waterjet Cutting Machine Industry Revenue Share (%), by End-User 2025 & 2033
- Figure 10: North America Waterjet Cutting Machine Industry Volume Share (%), by End-User 2025 & 2033
- Figure 11: North America Waterjet Cutting Machine Industry Revenue (Million), by Country 2025 & 2033
- Figure 12: North America Waterjet Cutting Machine Industry Volume (Billion), by Country 2025 & 2033
- Figure 13: North America Waterjet Cutting Machine Industry Revenue Share (%), by Country 2025 & 2033
- Figure 14: North America Waterjet Cutting Machine Industry Volume Share (%), by Country 2025 & 2033
- Figure 15: South America Waterjet Cutting Machine Industry Revenue (Million), by Product Type 2025 & 2033
- Figure 16: South America Waterjet Cutting Machine Industry Volume (Billion), by Product Type 2025 & 2033
- Figure 17: South America Waterjet Cutting Machine Industry Revenue Share (%), by Product Type 2025 & 2033
- Figure 18: South America Waterjet Cutting Machine Industry Volume Share (%), by Product Type 2025 & 2033
- Figure 19: South America Waterjet Cutting Machine Industry Revenue (Million), by End-User 2025 & 2033
- Figure 20: South America Waterjet Cutting Machine Industry Volume (Billion), by End-User 2025 & 2033
- Figure 21: South America Waterjet Cutting Machine Industry Revenue Share (%), by End-User 2025 & 2033
- Figure 22: South America Waterjet Cutting Machine Industry Volume Share (%), by End-User 2025 & 2033
- Figure 23: South America Waterjet Cutting Machine Industry Revenue (Million), by Country 2025 & 2033
- Figure 24: South America Waterjet Cutting Machine Industry Volume (Billion), by Country 2025 & 2033
- Figure 25: South America Waterjet Cutting Machine Industry Revenue Share (%), by Country 2025 & 2033
- Figure 26: South America Waterjet Cutting Machine Industry Volume Share (%), by Country 2025 & 2033
- Figure 27: Europe Waterjet Cutting Machine Industry Revenue (Million), by Product Type 2025 & 2033
- Figure 28: Europe Waterjet Cutting Machine Industry Volume (Billion), by Product Type 2025 & 2033
- Figure 29: Europe Waterjet Cutting Machine Industry Revenue Share (%), by Product Type 2025 & 2033
- Figure 30: Europe Waterjet Cutting Machine Industry Volume Share (%), by Product Type 2025 & 2033
- Figure 31: Europe Waterjet Cutting Machine Industry Revenue (Million), by End-User 2025 & 2033
- Figure 32: Europe Waterjet Cutting Machine Industry Volume (Billion), by End-User 2025 & 2033
- Figure 33: Europe Waterjet Cutting Machine Industry Revenue Share (%), by End-User 2025 & 2033
- Figure 34: Europe Waterjet Cutting Machine Industry Volume Share (%), by End-User 2025 & 2033
- Figure 35: Europe Waterjet Cutting Machine Industry Revenue (Million), by Country 2025 & 2033
- Figure 36: Europe Waterjet Cutting Machine Industry Volume (Billion), by Country 2025 & 2033
- Figure 37: Europe Waterjet Cutting Machine Industry Revenue Share (%), by Country 2025 & 2033
- Figure 38: Europe Waterjet Cutting Machine Industry Volume Share (%), by Country 2025 & 2033
- Figure 39: Asia Pacific Waterjet Cutting Machine Industry Revenue (Million), by Product Type 2025 & 2033
- Figure 40: Asia Pacific Waterjet Cutting Machine Industry Volume (Billion), by Product Type 2025 & 2033
- Figure 41: Asia Pacific Waterjet Cutting Machine Industry Revenue Share (%), by Product Type 2025 & 2033
- Figure 42: Asia Pacific Waterjet Cutting Machine Industry Volume Share (%), by Product Type 2025 & 2033
- Figure 43: Asia Pacific Waterjet Cutting Machine Industry Revenue (Million), by End-User 2025 & 2033
- Figure 44: Asia Pacific Waterjet Cutting Machine Industry Volume (Billion), by End-User 2025 & 2033
- Figure 45: Asia Pacific Waterjet Cutting Machine Industry Revenue Share (%), by End-User 2025 & 2033
- Figure 46: Asia Pacific Waterjet Cutting Machine Industry Volume Share (%), by End-User 2025 & 2033
- Figure 47: Asia Pacific Waterjet Cutting Machine Industry Revenue (Million), by Country 2025 & 2033
- Figure 48: Asia Pacific Waterjet Cutting Machine Industry Volume (Billion), by Country 2025 & 2033
- Figure 49: Asia Pacific Waterjet Cutting Machine Industry Revenue Share (%), by Country 2025 & 2033
- Figure 50: Asia Pacific Waterjet Cutting Machine Industry Volume Share (%), by Country 2025 & 2033
- Figure 51: Middle East Waterjet Cutting Machine Industry Revenue (Million), by Product Type 2025 & 2033
- Figure 52: Middle East Waterjet Cutting Machine Industry Volume (Billion), by Product Type 2025 & 2033
- Figure 53: Middle East Waterjet Cutting Machine Industry Revenue Share (%), by Product Type 2025 & 2033
- Figure 54: Middle East Waterjet Cutting Machine Industry Volume Share (%), by Product Type 2025 & 2033
- Figure 55: Middle East Waterjet Cutting Machine Industry Revenue (Million), by End-User 2025 & 2033
- Figure 56: Middle East Waterjet Cutting Machine Industry Volume (Billion), by End-User 2025 & 2033
- Figure 57: Middle East Waterjet Cutting Machine Industry Revenue Share (%), by End-User 2025 & 2033
- Figure 58: Middle East Waterjet Cutting Machine Industry Volume Share (%), by End-User 2025 & 2033
- Figure 59: Middle East Waterjet Cutting Machine Industry Revenue (Million), by Country 2025 & 2033
- Figure 60: Middle East Waterjet Cutting Machine Industry Volume (Billion), by Country 2025 & 2033
- Figure 61: Middle East Waterjet Cutting Machine Industry Revenue Share (%), by Country 2025 & 2033
- Figure 62: Middle East Waterjet Cutting Machine Industry Volume Share (%), by Country 2025 & 2033
List of Tables
- Table 1: Global Waterjet Cutting Machine Industry Revenue Million Forecast, by Product Type 2020 & 2033
- Table 2: Global Waterjet Cutting Machine Industry Volume Billion Forecast, by Product Type 2020 & 2033
- Table 3: Global Waterjet Cutting Machine Industry Revenue Million Forecast, by End-User 2020 & 2033
- Table 4: Global Waterjet Cutting Machine Industry Volume Billion Forecast, by End-User 2020 & 2033
- Table 5: Global Waterjet Cutting Machine Industry Revenue Million Forecast, by Region 2020 & 2033
- Table 6: Global Waterjet Cutting Machine Industry Volume Billion Forecast, by Region 2020 & 2033
- Table 7: Global Waterjet Cutting Machine Industry Revenue Million Forecast, by Product Type 2020 & 2033
- Table 8: Global Waterjet Cutting Machine Industry Volume Billion Forecast, by Product Type 2020 & 2033
- Table 9: Global Waterjet Cutting Machine Industry Revenue Million Forecast, by End-User 2020 & 2033
- Table 10: Global Waterjet Cutting Machine Industry Volume Billion Forecast, by End-User 2020 & 2033
- Table 11: Global Waterjet Cutting Machine Industry Revenue Million Forecast, by Country 2020 & 2033
- Table 12: Global Waterjet Cutting Machine Industry Volume Billion Forecast, by Country 2020 & 2033
- Table 13: United States Waterjet Cutting Machine Industry Revenue (Million) Forecast, by Application 2020 & 2033
- Table 14: United States Waterjet Cutting Machine Industry Volume (Billion) Forecast, by Application 2020 & 2033
- Table 15: Canada Waterjet Cutting Machine Industry Revenue (Million) Forecast, by Application 2020 & 2033
- Table 16: Canada Waterjet Cutting Machine Industry Volume (Billion) Forecast, by Application 2020 & 2033
- Table 17: Mexico Waterjet Cutting Machine Industry Revenue (Million) Forecast, by Application 2020 & 2033
- Table 18: Mexico Waterjet Cutting Machine Industry Volume (Billion) Forecast, by Application 2020 & 2033
- Table 19: Rest of North America Waterjet Cutting Machine Industry Revenue (Million) Forecast, by Application 2020 & 2033
- Table 20: Rest of North America Waterjet Cutting Machine Industry Volume (Billion) Forecast, by Application 2020 & 2033
- Table 21: Global Waterjet Cutting Machine Industry Revenue Million Forecast, by Product Type 2020 & 2033
- Table 22: Global Waterjet Cutting Machine Industry Volume Billion Forecast, by Product Type 2020 & 2033
- Table 23: Global Waterjet Cutting Machine Industry Revenue Million Forecast, by End-User 2020 & 2033
- Table 24: Global Waterjet Cutting Machine Industry Volume Billion Forecast, by End-User 2020 & 2033
- Table 25: Global Waterjet Cutting Machine Industry Revenue Million Forecast, by Country 2020 & 2033
- Table 26: Global Waterjet Cutting Machine Industry Volume Billion Forecast, by Country 2020 & 2033
- Table 27: Brazil Waterjet Cutting Machine Industry Revenue (Million) Forecast, by Application 2020 & 2033
- Table 28: Brazil Waterjet Cutting Machine Industry Volume (Billion) Forecast, by Application 2020 & 2033
- Table 29: Argentina Waterjet Cutting Machine Industry Revenue (Million) Forecast, by Application 2020 & 2033
- Table 30: Argentina Waterjet Cutting Machine Industry Volume (Billion) Forecast, by Application 2020 & 2033
- Table 31: Global Waterjet Cutting Machine Industry Revenue Million Forecast, by Product Type 2020 & 2033
- Table 32: Global Waterjet Cutting Machine Industry Volume Billion Forecast, by Product Type 2020 & 2033
- Table 33: Global Waterjet Cutting Machine Industry Revenue Million Forecast, by End-User 2020 & 2033
- Table 34: Global Waterjet Cutting Machine Industry Volume Billion Forecast, by End-User 2020 & 2033
- Table 35: Global Waterjet Cutting Machine Industry Revenue Million Forecast, by Country 2020 & 2033
- Table 36: Global Waterjet Cutting Machine Industry Volume Billion Forecast, by Country 2020 & 2033
- Table 37: Germany Waterjet Cutting Machine Industry Revenue (Million) Forecast, by Application 2020 & 2033
- Table 38: Germany Waterjet Cutting Machine Industry Volume (Billion) Forecast, by Application 2020 & 2033
- Table 39: United Kingdom Waterjet Cutting Machine Industry Revenue (Million) Forecast, by Application 2020 & 2033
- Table 40: United Kingdom Waterjet Cutting Machine Industry Volume (Billion) Forecast, by Application 2020 & 2033
- Table 41: France Waterjet Cutting Machine Industry Revenue (Million) Forecast, by Application 2020 & 2033
- Table 42: France Waterjet Cutting Machine Industry Volume (Billion) Forecast, by Application 2020 & 2033
- Table 43: Russia Waterjet Cutting Machine Industry Revenue (Million) Forecast, by Application 2020 & 2033
- Table 44: Russia Waterjet Cutting Machine Industry Volume (Billion) Forecast, by Application 2020 & 2033
- Table 45: Spain Waterjet Cutting Machine Industry Revenue (Million) Forecast, by Application 2020 & 2033
- Table 46: Spain Waterjet Cutting Machine Industry Volume (Billion) Forecast, by Application 2020 & 2033
- Table 47: Rest of Europe Waterjet Cutting Machine Industry Revenue (Million) Forecast, by Application 2020 & 2033
- Table 48: Rest of Europe Waterjet Cutting Machine Industry Volume (Billion) Forecast, by Application 2020 & 2033
- Table 49: Global Waterjet Cutting Machine Industry Revenue Million Forecast, by Product Type 2020 & 2033
- Table 50: Global Waterjet Cutting Machine Industry Volume Billion Forecast, by Product Type 2020 & 2033
- Table 51: Global Waterjet Cutting Machine Industry Revenue Million Forecast, by End-User 2020 & 2033
- Table 52: Global Waterjet Cutting Machine Industry Volume Billion Forecast, by End-User 2020 & 2033
- Table 53: Global Waterjet Cutting Machine Industry Revenue Million Forecast, by Country 2020 & 2033
- Table 54: Global Waterjet Cutting Machine Industry Volume Billion Forecast, by Country 2020 & 2033
- Table 55: India Waterjet Cutting Machine Industry Revenue (Million) Forecast, by Application 2020 & 2033
- Table 56: India Waterjet Cutting Machine Industry Volume (Billion) Forecast, by Application 2020 & 2033
- Table 57: China Waterjet Cutting Machine Industry Revenue (Million) Forecast, by Application 2020 & 2033
- Table 58: China Waterjet Cutting Machine Industry Volume (Billion) Forecast, by Application 2020 & 2033
- Table 59: Japan Waterjet Cutting Machine Industry Revenue (Million) Forecast, by Application 2020 & 2033
- Table 60: Japan Waterjet Cutting Machine Industry Volume (Billion) Forecast, by Application 2020 & 2033
- Table 61: Rest of Asia Pacific Waterjet Cutting Machine Industry Revenue (Million) Forecast, by Application 2020 & 2033
- Table 62: Rest of Asia Pacific Waterjet Cutting Machine Industry Volume (Billion) Forecast, by Application 2020 & 2033
- Table 63: Global Waterjet Cutting Machine Industry Revenue Million Forecast, by Product Type 2020 & 2033
- Table 64: Global Waterjet Cutting Machine Industry Volume Billion Forecast, by Product Type 2020 & 2033
- Table 65: Global Waterjet Cutting Machine Industry Revenue Million Forecast, by End-User 2020 & 2033
- Table 66: Global Waterjet Cutting Machine Industry Volume Billion Forecast, by End-User 2020 & 2033
- Table 67: Global Waterjet Cutting Machine Industry Revenue Million Forecast, by Country 2020 & 2033
- Table 68: Global Waterjet Cutting Machine Industry Volume Billion Forecast, by Country 2020 & 2033
- Table 69: United Arab Emirates Waterjet Cutting Machine Industry Revenue (Million) Forecast, by Application 2020 & 2033
- Table 70: United Arab Emirates Waterjet Cutting Machine Industry Volume (Billion) Forecast, by Application 2020 & 2033
- Table 71: Saudi Arabia Waterjet Cutting Machine Industry Revenue (Million) Forecast, by Application 2020 & 2033
- Table 72: Saudi Arabia Waterjet Cutting Machine Industry Volume (Billion) Forecast, by Application 2020 & 2033
- Table 73: Rest of the Middle East Waterjet Cutting Machine Industry Revenue (Million) Forecast, by Application 2020 & 2033
- Table 74: Rest of the Middle East Waterjet Cutting Machine Industry Volume (Billion) Forecast, by Application 2020 & 2033
Frequently Asked Questions
1. What is the projected Compound Annual Growth Rate (CAGR) of the Waterjet Cutting Machine Industry?
The projected CAGR is approximately 6.01%.
2. Which companies are prominent players in the Waterjet Cutting Machine Industry?
Key companies in the market include OMAX Corporation, Enovis (Colfax Corporation), Hypertherm Inc, Flow International Corporation, Wardjet Belotti SPA, KMT Waterjet, Resato International B V, Jet Edge Inc, Dardi International Corporation, Jekran Ltd, International Waterjet Machines, Kennametal Inc, CERATIZIT S A, GMA Garnet Pty Ltd, Hornet Cutting Systems**List Not Exhaustive.
3. What are the main segments of the Waterjet Cutting Machine Industry?
The market segments include Product Type, End-User.
4. Can you provide details about the market size?
The market size is estimated to be USD 1.15 Million as of 2022.
5. What are some drivers contributing to market growth?
Surging Demand from the Manufacturing and Automotive Sectors; Technological Advancements.
6. What are the notable trends driving market growth?
Growth Potential of Abrasive Waterjet Cutting Machines.
7. Are there any restraints impacting market growth?
Surging Demand from the Manufacturing and Automotive Sectors; Technological Advancements.
8. Can you provide examples of recent developments in the market?
July 2024: WECJet has unveiled its latest acquisition: a cutting-edge Mach 500 waterjet cutting machine. The company revealed that its waterjet division has successfully commissioned the new 4m x 3m Mach 500, following a substantial investment of EUR 350,000. Thanks to its advanced 90,000 psi Dynamic head-cutting technology, this machine now holds the title of the fastest waterjet on the global market. With this strategic investment, WECJet has expanded its capabilities, now cutting a diverse array of materials, reaching thicknesses of up to 300mm and widths of 3m, all made possible by the machine's larger bed and heightened open space for producing larger parts.
9. What pricing options are available for accessing the report?
Pricing options include single-user, multi-user, and enterprise licenses priced at USD 4750, USD 5250, and USD 8750 respectively.
10. Is the market size provided in terms of value or volume?
The market size is provided in terms of value, measured in Million and volume, measured in Billion.
11. Are there any specific market keywords associated with the report?
Yes, the market keyword associated with the report is "Waterjet Cutting Machine Industry," which aids in identifying and referencing the specific market segment covered.
12. How do I determine which pricing option suits my needs best?
The pricing options vary based on user requirements and access needs. Individual users may opt for single-user licenses, while businesses requiring broader access may choose multi-user or enterprise licenses for cost-effective access to the report.
13. Are there any additional resources or data provided in the Waterjet Cutting Machine Industry report?
While the report offers comprehensive insights, it's advisable to review the specific contents or supplementary materials provided to ascertain if additional resources or data are available.
14. How can I stay updated on further developments or reports in the Waterjet Cutting Machine Industry?
To stay informed about further developments, trends, and reports in the Waterjet Cutting Machine Industry, consider subscribing to industry newsletters, following relevant companies and organizations, or regularly checking reputable industry news sources and publications.
Methodology
Step 1 - Identification of Relevant Samples Size from Population Database


Step 2 - Approaches for Defining Global Market Size (Value, Volume* & Price*)

Note*: In applicable scenarios
Step 3 - Data Sources
Primary Research
- Web Analytics
- Survey Reports
- Research Institute
- Latest Research Reports
- Opinion Leaders
Secondary Research
- Annual Reports
- White Paper
- Latest Press Release
- Industry Association
- Paid Database
- Investor Presentations

Step 4 - Data Triangulation
Involves using different sources of information in order to increase the validity of a study
These sources are likely to be stakeholders in a program - participants, other researchers, program staff, other community members, and so on.
Then we put all data in single framework & apply various statistical tools to find out the dynamic on the market.
During the analysis stage, feedback from the stakeholder groups would be compared to determine areas of agreement as well as areas of divergence