
Key Insights
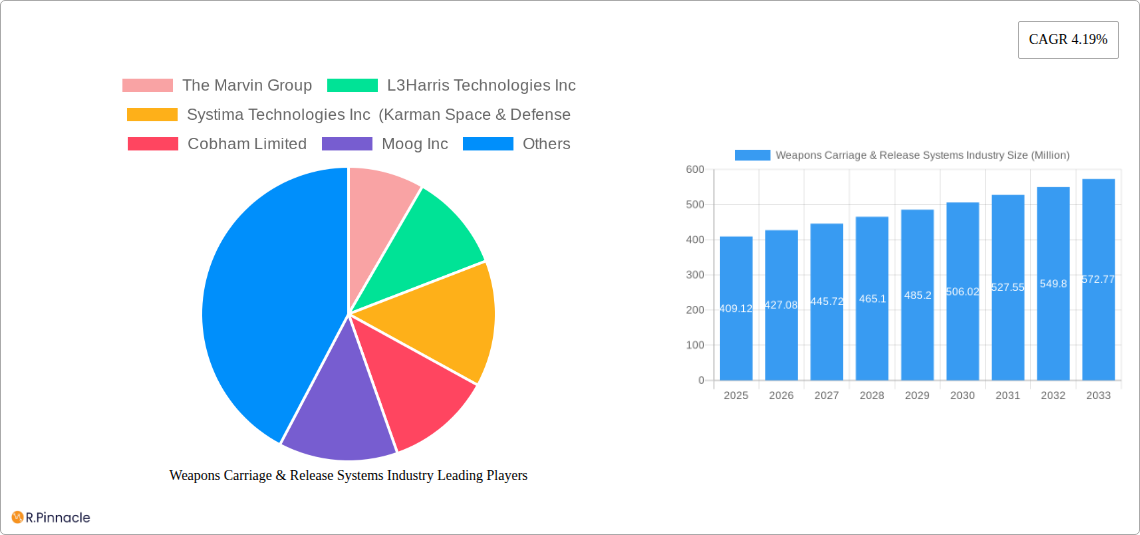
The global Weapons Carriage & Release Systems market, valued at $409.12 million in 2025, is projected to experience steady growth, driven by increasing defense budgets globally and the ongoing modernization of military aircraft and UAV fleets. The market's Compound Annual Growth Rate (CAGR) of 4.19% from 2025 to 2033 indicates a consistent demand for sophisticated and reliable systems capable of deploying a diverse range of weaponry accurately and efficiently. Key drivers include the integration of advanced technologies such as precision-guided munitions and the growing adoption of unmanned aerial vehicles (UAVs) in military operations. Furthermore, technological advancements leading to lighter, more durable, and adaptable systems are fueling market expansion. The segment encompassing missiles and bombs within the weapon type category is expected to dominate the market due to their continued relevance in modern warfare. The North American and European regions are projected to hold significant market share due to substantial defense spending and a robust technological base. However, the Asia-Pacific region is expected to witness faster growth driven by increased defense modernization initiatives in several countries. While geopolitical stability and economic factors can act as restraints, the overall market outlook remains positive, fueled by sustained investment in military capabilities and technological innovation.
The competitive landscape is marked by a mix of established defense contractors and specialized technology providers. Companies such as The Marvin Group, L3Harris Technologies Inc, and RTX Corporation are major players, leveraging their expertise in system integration and technological advancements. Smaller companies often specialize in niche areas such as specific weapon types or platform integration, contributing to the overall innovation within the sector. The market is characterized by a high degree of technological sophistication, requiring significant research and development investment to maintain a competitive edge. Future growth will depend on the continued evolution of weapon systems, the integration of AI and autonomous capabilities, and the adoption of advanced materials and manufacturing techniques. This will lead to the development of more precise, reliable, and adaptable weapons carriage and release systems across various platforms.
Weapons Carriage & Release Systems Industry Report: 2019-2033
This comprehensive report provides an in-depth analysis of the global Weapons Carriage & Release Systems industry, offering valuable insights for industry professionals, investors, and strategic decision-makers. Covering the period from 2019 to 2033, with a focus on 2025, this report delivers a detailed forecast and analysis of market trends, competitive landscapes, and future growth potential. The study encompasses key segments, including Aircraft, Helicopters, and Unmanned Aerial Vehicles (UAVs), and weapon types such as Missiles and Bombs. The report leverages data and analysis to highlight key market drivers, challenges, and opportunities, providing actionable intelligence to navigate this dynamic sector. The report values are expressed in Millions of USD.
Weapons Carriage & Release Systems Industry Market Structure & Innovation Trends
This section analyzes the market's competitive landscape, including market concentration, innovation drivers, regulatory influences, and the impact of mergers and acquisitions (M&A) activity. The industry exhibits moderate concentration, with key players such as The Marvin Group, L3Harris Technologies Inc, and RTX Corporation holding significant market share. The estimated combined market share of the top 5 players in 2025 is approximately 40%. Innovation is driven by the need for increased precision, reduced weight, and improved compatibility across various platforms. Stringent regulatory frameworks governing weapon systems development and deployment significantly influence market dynamics. The emergence of more effective and efficient weapon systems acts as a substitute for existing technologies, forcing companies to constantly innovate. The M&A activity in the industry is substantial, with several billion-dollar deals recorded in the historical period (2019-2024). Deal values have averaged approximately $xx Million per transaction. End-user demographics, predominantly military forces globally, further shape market demand.
- Market Concentration: Moderately Concentrated
- Innovation Drivers: Precision, Weight Reduction, Platform Compatibility
- Regulatory Frameworks: Stringent and evolving
- M&A Activity: Significant, with an average deal value of $xx Million (2019-2024)

Weapons Carriage & Release Systems Industry Market Dynamics & Trends
The global Weapons Carriage & Release Systems market is experiencing robust growth, driven by increasing defense budgets globally, modernization of existing fleets, and the proliferation of UAVs. Technological advancements, such as AI-powered targeting systems and improved guidance mechanisms, are significantly impacting market dynamics. Consumer preference for enhanced precision and reduced collateral damage drives demand for advanced systems. Competitive dynamics are characterized by intense rivalry among established players and the emergence of new entrants with innovative technologies. The Compound Annual Growth Rate (CAGR) for the forecast period (2025-2033) is estimated at xx%, with market penetration steadily increasing across various platforms and weapon types. The market size in 2025 is estimated at $xx Million, projected to reach $xx Million by 2033.
Dominant Regions & Segments in Weapons Carriage & Release Systems Industry
North America currently holds the largest market share, driven by strong defense spending and technological advancements. However, the Asia-Pacific region is projected to experience the fastest growth during the forecast period due to increasing defense modernization efforts and rising geopolitical tensions.
Key Drivers:
- North America: High defense budgets, technological leadership.
- Asia-Pacific: Rising defense spending, geopolitical factors.
- Europe: Focus on modernization, regional security concerns.
Segment Dominance:
The Aircraft segment holds the largest market share within the Platform category, driven by the large number of aircraft in service globally and continuous upgrades. Missiles represent the dominant weapon type due to their versatility and strategic importance. The UAV segment is experiencing significant growth driven by its increasing use in modern warfare.
Weapons Carriage & Release Systems Industry Product Innovations
Recent product developments emphasize enhanced precision, reduced weight, and improved reliability. The integration of advanced technologies, such as AI-powered targeting systems and improved guidance mechanisms, provides significant competitive advantages. These innovations are tailored to meet the specific requirements of various platforms and weapon types, ensuring optimal market fit and high demand.
Report Scope & Segmentation Analysis
This report segments the Weapons Carriage & Release Systems market based on platform (Aircraft, Helicopters, Unmanned Aerial Vehicles) and weapon type (Missiles, Bombs). Each segment is analyzed based on its growth projections, market size, and competitive dynamics. The Aircraft segment is projected to witness steady growth due to continued fleet modernization. The UAV segment is expected to show the highest CAGR due to the increasing adoption of UAV technology. The Missile segment dominates the weapon type category due to its strategic importance and technological advancements. The Bomb segment exhibits growth driven by continuous improvement in precision-guided munitions.
Key Drivers of Weapons Carriage & Release Systems Industry Growth
Growth is fueled by factors such as rising defense expenditure globally, the modernization of existing military fleets, the growing adoption of UAV technology, and the increasing demand for advanced precision-guided munitions. Technological advancements in guidance systems, AI-powered targeting, and improved materials are further stimulating growth. Favorable government policies and supportive regulatory frameworks also contribute significantly to market expansion.
Challenges in the Weapons Carriage & Release Systems Industry Sector
The industry faces challenges including stringent regulatory hurdles for new product approvals, potential supply chain disruptions impacting production timelines and costs, and intense competition from established players and new entrants. These factors can lead to unpredictable market fluctuations and impact profitability. The impact of supply chain disruptions is estimated to have reduced industry revenue by approximately $xx Million in 2024.
Emerging Opportunities in Weapons Carriage & Release Systems Industry
Emerging opportunities lie in the growing demand for autonomous systems, the integration of advanced sensors and data analytics, and the development of hypersonic weapons. Expansion into new markets, particularly in developing nations with increasing defense budgets, presents significant growth potential. The development of more efficient and adaptable weapons systems for diverse applications is also a key opportunity.
Leading Players in the Weapons Carriage & Release Systems Industry Market
- The Marvin Group
- L3Harris Technologies Inc
- Systima Technologies Inc
- Karman Space & Defense
- Cobham Limited
- Moog Inc
- RTX Corporation
- Alkan
- Marotta Controls Inc
Key Developments in Weapons Carriage & Release Systems Industry
- 2023: L3Harris Technologies Inc. announced the successful testing of a new precision-guided bomb.
- 2022: RTX Corporation acquired a smaller competitor, expanding its market share.
- 2021: The Marvin Group unveiled a new weapons carriage system for UAVs.
- 2020: Significant investment in R&D across the sector. (Further details can be added here based on available data)
Future Outlook for Weapons Carriage & Release Systems Industry Market
The Weapons Carriage & Release Systems market is poised for continued growth, driven by technological innovation and increasing global defense spending. Strategic partnerships and collaborations will play a crucial role in shaping the future competitive landscape. The focus on developing autonomous systems, AI-powered solutions, and hypersonic technologies will drive the next phase of industry evolution and present lucrative opportunities for companies capable of meeting these evolving demands. The market is expected to experience significant expansion, especially in the UAV segment and with advanced missile systems.
Weapons Carriage & Release Systems Industry Segmentation
-
1. Platform
- 1.1. Aircraft
- 1.2. Helicopters
- 1.3. Unmanned Aerial Vehicles
-
2. Weapon Type
- 2.1. Missiles
- 2.2. Bombs
- 3. Geography
-
4. North America
- 4.1. United States
- 4.2. Canada
-
5. Europe
- 5.1. United Kingdom
- 5.2. France
- 5.3. Germany
- 5.4. Russia
- 5.5. Rest of Europe
-
6. Asia-Pacific
- 6.1. China
- 6.2. India
- 6.3. Japan
- 6.4. South Korea
- 6.5. Rest of Asia-Pacific
-
7. Latin America
- 7.1. Brazil
- 7.2. Mexico
- 7.3. Rest of Latin America
-
8. Middle East and Africa
- 8.1. United Arab Emirates
- 8.2. Saudi Arabia
- 8.3. Turkey
- 8.4. South Africa
- 8.5. Rest of Middle East and Africa
Weapons Carriage & Release Systems Industry Segmentation By Geography
-
1. North America
- 1.1. United States
- 1.2. Canada
- 1.3. Mexico
-
2. South America
- 2.1. Brazil
- 2.2. Argentina
- 2.3. Rest of South America
-
3. Europe
- 3.1. United Kingdom
- 3.2. Germany
- 3.3. France
- 3.4. Italy
- 3.5. Spain
- 3.6. Russia
- 3.7. Benelux
- 3.8. Nordics
- 3.9. Rest of Europe
-
4. Middle East & Africa
- 4.1. Turkey
- 4.2. Israel
- 4.3. GCC
- 4.4. North Africa
- 4.5. South Africa
- 4.6. Rest of Middle East & Africa
-
5. Asia Pacific
- 5.1. China
- 5.2. India
- 5.3. Japan
- 5.4. South Korea
- 5.5. ASEAN
- 5.6. Oceania
- 5.7. Rest of Asia Pacific

Weapons Carriage & Release Systems Industry REPORT HIGHLIGHTS
| Aspects | Details |
|---|---|
| Study Period | 2019-2033 |
| Base Year | 2024 |
| Estimated Year | 2025 |
| Forecast Period | 2025-2033 |
| Historical Period | 2019-2024 |
| Growth Rate | CAGR of 4.19% from 2019-2033 |
| Segmentation |
|
Table of Contents
- 1. Introduction
- 1.1. Research Scope
- 1.2. Market Segmentation
- 1.3. Research Methodology
- 1.4. Definitions and Assumptions
- 2. Executive Summary
- 2.1. Introduction
- 3. Market Dynamics
- 3.1. Introduction
- 3.2. Market Drivers
- 3.3. Market Restrains
- 3.4. Market Trends
- 3.4.1. Aircraft Platform to Dominate the Market
- 4. Market Factor Analysis
- 4.1. Porters Five Forces
- 4.2. Supply/Value Chain
- 4.3. PESTEL analysis
- 4.4. Market Entropy
- 4.5. Patent/Trademark Analysis
- 5. Global Weapons Carriage & Release Systems Industry Analysis, Insights and Forecast, 2019-2031
- 5.1. Market Analysis, Insights and Forecast - by Platform
- 5.1.1. Aircraft
- 5.1.2. Helicopters
- 5.1.3. Unmanned Aerial Vehicles
- 5.2. Market Analysis, Insights and Forecast - by Weapon Type
- 5.2.1. Missiles
- 5.2.2. Bombs
- 5.3. Market Analysis, Insights and Forecast - by Geography
- 5.4. Market Analysis, Insights and Forecast - by North America
- 5.4.1. United States
- 5.4.2. Canada
- 5.5. Market Analysis, Insights and Forecast - by Europe
- 5.5.1. United Kingdom
- 5.5.2. France
- 5.5.3. Germany
- 5.5.4. Russia
- 5.5.5. Rest of Europe
- 5.6. Market Analysis, Insights and Forecast - by Asia-Pacific
- 5.6.1. China
- 5.6.2. India
- 5.6.3. Japan
- 5.6.4. South Korea
- 5.6.5. Rest of Asia-Pacific
- 5.7. Market Analysis, Insights and Forecast - by Latin America
- 5.7.1. Brazil
- 5.7.2. Mexico
- 5.7.3. Rest of Latin America
- 5.8. Market Analysis, Insights and Forecast - by Middle East and Africa
- 5.8.1. United Arab Emirates
- 5.8.2. Saudi Arabia
- 5.8.3. Turkey
- 5.8.4. South Africa
- 5.8.5. Rest of Middle East and Africa
- 5.9. Market Analysis, Insights and Forecast - by Region
- 5.9.1. North America
- 5.9.2. South America
- 5.9.3. Europe
- 5.9.4. Middle East & Africa
- 5.9.5. Asia Pacific
- 5.1. Market Analysis, Insights and Forecast - by Platform
- 6. North America Weapons Carriage & Release Systems Industry Analysis, Insights and Forecast, 2019-2031
- 6.1. Market Analysis, Insights and Forecast - by Platform
- 6.1.1. Aircraft
- 6.1.2. Helicopters
- 6.1.3. Unmanned Aerial Vehicles
- 6.2. Market Analysis, Insights and Forecast - by Weapon Type
- 6.2.1. Missiles
- 6.2.2. Bombs
- 6.3. Market Analysis, Insights and Forecast - by Geography
- 6.4. Market Analysis, Insights and Forecast - by North America
- 6.4.1. United States
- 6.4.2. Canada
- 6.5. Market Analysis, Insights and Forecast - by Europe
- 6.5.1. United Kingdom
- 6.5.2. France
- 6.5.3. Germany
- 6.5.4. Russia
- 6.5.5. Rest of Europe
- 6.6. Market Analysis, Insights and Forecast - by Asia-Pacific
- 6.6.1. China
- 6.6.2. India
- 6.6.3. Japan
- 6.6.4. South Korea
- 6.6.5. Rest of Asia-Pacific
- 6.7. Market Analysis, Insights and Forecast - by Latin America
- 6.7.1. Brazil
- 6.7.2. Mexico
- 6.7.3. Rest of Latin America
- 6.8. Market Analysis, Insights and Forecast - by Middle East and Africa
- 6.8.1. United Arab Emirates
- 6.8.2. Saudi Arabia
- 6.8.3. Turkey
- 6.8.4. South Africa
- 6.8.5. Rest of Middle East and Africa
- 6.1. Market Analysis, Insights and Forecast - by Platform
- 7. South America Weapons Carriage & Release Systems Industry Analysis, Insights and Forecast, 2019-2031
- 7.1. Market Analysis, Insights and Forecast - by Platform
- 7.1.1. Aircraft
- 7.1.2. Helicopters
- 7.1.3. Unmanned Aerial Vehicles
- 7.2. Market Analysis, Insights and Forecast - by Weapon Type
- 7.2.1. Missiles
- 7.2.2. Bombs
- 7.3. Market Analysis, Insights and Forecast - by Geography
- 7.4. Market Analysis, Insights and Forecast - by North America
- 7.4.1. United States
- 7.4.2. Canada
- 7.5. Market Analysis, Insights and Forecast - by Europe
- 7.5.1. United Kingdom
- 7.5.2. France
- 7.5.3. Germany
- 7.5.4. Russia
- 7.5.5. Rest of Europe
- 7.6. Market Analysis, Insights and Forecast - by Asia-Pacific
- 7.6.1. China
- 7.6.2. India
- 7.6.3. Japan
- 7.6.4. South Korea
- 7.6.5. Rest of Asia-Pacific
- 7.7. Market Analysis, Insights and Forecast - by Latin America
- 7.7.1. Brazil
- 7.7.2. Mexico
- 7.7.3. Rest of Latin America
- 7.8. Market Analysis, Insights and Forecast - by Middle East and Africa
- 7.8.1. United Arab Emirates
- 7.8.2. Saudi Arabia
- 7.8.3. Turkey
- 7.8.4. South Africa
- 7.8.5. Rest of Middle East and Africa
- 7.1. Market Analysis, Insights and Forecast - by Platform
- 8. Europe Weapons Carriage & Release Systems Industry Analysis, Insights and Forecast, 2019-2031
- 8.1. Market Analysis, Insights and Forecast - by Platform
- 8.1.1. Aircraft
- 8.1.2. Helicopters
- 8.1.3. Unmanned Aerial Vehicles
- 8.2. Market Analysis, Insights and Forecast - by Weapon Type
- 8.2.1. Missiles
- 8.2.2. Bombs
- 8.3. Market Analysis, Insights and Forecast - by Geography
- 8.4. Market Analysis, Insights and Forecast - by North America
- 8.4.1. United States
- 8.4.2. Canada
- 8.5. Market Analysis, Insights and Forecast - by Europe
- 8.5.1. United Kingdom
- 8.5.2. France
- 8.5.3. Germany
- 8.5.4. Russia
- 8.5.5. Rest of Europe
- 8.6. Market Analysis, Insights and Forecast - by Asia-Pacific
- 8.6.1. China
- 8.6.2. India
- 8.6.3. Japan
- 8.6.4. South Korea
- 8.6.5. Rest of Asia-Pacific
- 8.7. Market Analysis, Insights and Forecast - by Latin America
- 8.7.1. Brazil
- 8.7.2. Mexico
- 8.7.3. Rest of Latin America
- 8.8. Market Analysis, Insights and Forecast - by Middle East and Africa
- 8.8.1. United Arab Emirates
- 8.8.2. Saudi Arabia
- 8.8.3. Turkey
- 8.8.4. South Africa
- 8.8.5. Rest of Middle East and Africa
- 8.1. Market Analysis, Insights and Forecast - by Platform
- 9. Middle East & Africa Weapons Carriage & Release Systems Industry Analysis, Insights and Forecast, 2019-2031
- 9.1. Market Analysis, Insights and Forecast - by Platform
- 9.1.1. Aircraft
- 9.1.2. Helicopters
- 9.1.3. Unmanned Aerial Vehicles
- 9.2. Market Analysis, Insights and Forecast - by Weapon Type
- 9.2.1. Missiles
- 9.2.2. Bombs
- 9.3. Market Analysis, Insights and Forecast - by Geography
- 9.4. Market Analysis, Insights and Forecast - by North America
- 9.4.1. United States
- 9.4.2. Canada
- 9.5. Market Analysis, Insights and Forecast - by Europe
- 9.5.1. United Kingdom
- 9.5.2. France
- 9.5.3. Germany
- 9.5.4. Russia
- 9.5.5. Rest of Europe
- 9.6. Market Analysis, Insights and Forecast - by Asia-Pacific
- 9.6.1. China
- 9.6.2. India
- 9.6.3. Japan
- 9.6.4. South Korea
- 9.6.5. Rest of Asia-Pacific
- 9.7. Market Analysis, Insights and Forecast - by Latin America
- 9.7.1. Brazil
- 9.7.2. Mexico
- 9.7.3. Rest of Latin America
- 9.8. Market Analysis, Insights and Forecast - by Middle East and Africa
- 9.8.1. United Arab Emirates
- 9.8.2. Saudi Arabia
- 9.8.3. Turkey
- 9.8.4. South Africa
- 9.8.5. Rest of Middle East and Africa
- 9.1. Market Analysis, Insights and Forecast - by Platform
- 10. Asia Pacific Weapons Carriage & Release Systems Industry Analysis, Insights and Forecast, 2019-2031
- 10.1. Market Analysis, Insights and Forecast - by Platform
- 10.1.1. Aircraft
- 10.1.2. Helicopters
- 10.1.3. Unmanned Aerial Vehicles
- 10.2. Market Analysis, Insights and Forecast - by Weapon Type
- 10.2.1. Missiles
- 10.2.2. Bombs
- 10.3. Market Analysis, Insights and Forecast - by Geography
- 10.4. Market Analysis, Insights and Forecast - by North America
- 10.4.1. United States
- 10.4.2. Canada
- 10.5. Market Analysis, Insights and Forecast - by Europe
- 10.5.1. United Kingdom
- 10.5.2. France
- 10.5.3. Germany
- 10.5.4. Russia
- 10.5.5. Rest of Europe
- 10.6. Market Analysis, Insights and Forecast - by Asia-Pacific
- 10.6.1. China
- 10.6.2. India
- 10.6.3. Japan
- 10.6.4. South Korea
- 10.6.5. Rest of Asia-Pacific
- 10.7. Market Analysis, Insights and Forecast - by Latin America
- 10.7.1. Brazil
- 10.7.2. Mexico
- 10.7.3. Rest of Latin America
- 10.8. Market Analysis, Insights and Forecast - by Middle East and Africa
- 10.8.1. United Arab Emirates
- 10.8.2. Saudi Arabia
- 10.8.3. Turkey
- 10.8.4. South Africa
- 10.8.5. Rest of Middle East and Africa
- 10.1. Market Analysis, Insights and Forecast - by Platform
- 11. North America Weapons Carriage & Release Systems Industry Analysis, Insights and Forecast, 2019-2031
- 11.1. Market Analysis, Insights and Forecast - By Country/Sub-region
- 11.1.1 United States
- 11.1.2 Canada
- 12. Europe Weapons Carriage & Release Systems Industry Analysis, Insights and Forecast, 2019-2031
- 12.1. Market Analysis, Insights and Forecast - By Country/Sub-region
- 12.1.1 Germany
- 12.1.2 United Kingdom
- 12.1.3 France
- 12.1.4 Russia
- 12.1.5 Rest of Europe
- 13. Asia Pacific Weapons Carriage & Release Systems Industry Analysis, Insights and Forecast, 2019-2031
- 13.1. Market Analysis, Insights and Forecast - By Country/Sub-region
- 13.1.1 India
- 13.1.2 China
- 13.1.3 Japan
- 13.1.4 South Korea
- 13.1.5 Rest of Asia Pacific
- 14. Latin America Weapons Carriage & Release Systems Industry Analysis, Insights and Forecast, 2019-2031
- 14.1. Market Analysis, Insights and Forecast - By Country/Sub-region
- 14.1.1 Brazil
- 14.1.2 Rest of Latin America
- 15. Middle East and Africa Weapons Carriage & Release Systems Industry Analysis, Insights and Forecast, 2019-2031
- 15.1. Market Analysis, Insights and Forecast - By Country/Sub-region
- 15.1.1 United Arab Emirates
- 15.1.2 Saudi Arabia
- 15.1.3 Israel
- 15.1.4 Rest of Middle East and Africa
- 16. Competitive Analysis
- 16.1. Global Market Share Analysis 2024
- 16.2. Company Profiles
- 16.2.1 The Marvin Group
- 16.2.1.1. Overview
- 16.2.1.2. Products
- 16.2.1.3. SWOT Analysis
- 16.2.1.4. Recent Developments
- 16.2.1.5. Financials (Based on Availability)
- 16.2.2 L3Harris Technologies Inc
- 16.2.2.1. Overview
- 16.2.2.2. Products
- 16.2.2.3. SWOT Analysis
- 16.2.2.4. Recent Developments
- 16.2.2.5. Financials (Based on Availability)
- 16.2.3 Systima Technologies Inc (Karman Space & Defense
- 16.2.3.1. Overview
- 16.2.3.2. Products
- 16.2.3.3. SWOT Analysis
- 16.2.3.4. Recent Developments
- 16.2.3.5. Financials (Based on Availability)
- 16.2.4 Cobham Limited
- 16.2.4.1. Overview
- 16.2.4.2. Products
- 16.2.4.3. SWOT Analysis
- 16.2.4.4. Recent Developments
- 16.2.4.5. Financials (Based on Availability)
- 16.2.5 Moog Inc
- 16.2.5.1. Overview
- 16.2.5.2. Products
- 16.2.5.3. SWOT Analysis
- 16.2.5.4. Recent Developments
- 16.2.5.5. Financials (Based on Availability)
- 16.2.6 RTX Corporation
- 16.2.6.1. Overview
- 16.2.6.2. Products
- 16.2.6.3. SWOT Analysis
- 16.2.6.4. Recent Developments
- 16.2.6.5. Financials (Based on Availability)
- 16.2.7 Alkan
- 16.2.7.1. Overview
- 16.2.7.2. Products
- 16.2.7.3. SWOT Analysis
- 16.2.7.4. Recent Developments
- 16.2.7.5. Financials (Based on Availability)
- 16.2.8 Marotta Controls Inc
- 16.2.8.1. Overview
- 16.2.8.2. Products
- 16.2.8.3. SWOT Analysis
- 16.2.8.4. Recent Developments
- 16.2.8.5. Financials (Based on Availability)
- 16.2.1 The Marvin Group
List of Figures
- Figure 1: Global Weapons Carriage & Release Systems Industry Revenue Breakdown (Million, %) by Region 2024 & 2032
- Figure 2: North America Weapons Carriage & Release Systems Industry Revenue (Million), by Country 2024 & 2032
- Figure 3: North America Weapons Carriage & Release Systems Industry Revenue Share (%), by Country 2024 & 2032
- Figure 4: Europe Weapons Carriage & Release Systems Industry Revenue (Million), by Country 2024 & 2032
- Figure 5: Europe Weapons Carriage & Release Systems Industry Revenue Share (%), by Country 2024 & 2032
- Figure 6: Asia Pacific Weapons Carriage & Release Systems Industry Revenue (Million), by Country 2024 & 2032
- Figure 7: Asia Pacific Weapons Carriage & Release Systems Industry Revenue Share (%), by Country 2024 & 2032
- Figure 8: Latin America Weapons Carriage & Release Systems Industry Revenue (Million), by Country 2024 & 2032
- Figure 9: Latin America Weapons Carriage & Release Systems Industry Revenue Share (%), by Country 2024 & 2032
- Figure 10: Middle East and Africa Weapons Carriage & Release Systems Industry Revenue (Million), by Country 2024 & 2032
- Figure 11: Middle East and Africa Weapons Carriage & Release Systems Industry Revenue Share (%), by Country 2024 & 2032
- Figure 12: North America Weapons Carriage & Release Systems Industry Revenue (Million), by Platform 2024 & 2032
- Figure 13: North America Weapons Carriage & Release Systems Industry Revenue Share (%), by Platform 2024 & 2032
- Figure 14: North America Weapons Carriage & Release Systems Industry Revenue (Million), by Weapon Type 2024 & 2032
- Figure 15: North America Weapons Carriage & Release Systems Industry Revenue Share (%), by Weapon Type 2024 & 2032
- Figure 16: North America Weapons Carriage & Release Systems Industry Revenue (Million), by Geography 2024 & 2032
- Figure 17: North America Weapons Carriage & Release Systems Industry Revenue Share (%), by Geography 2024 & 2032
- Figure 18: North America Weapons Carriage & Release Systems Industry Revenue (Million), by North America 2024 & 2032
- Figure 19: North America Weapons Carriage & Release Systems Industry Revenue Share (%), by North America 2024 & 2032
- Figure 20: North America Weapons Carriage & Release Systems Industry Revenue (Million), by Europe 2024 & 2032
- Figure 21: North America Weapons Carriage & Release Systems Industry Revenue Share (%), by Europe 2024 & 2032
- Figure 22: North America Weapons Carriage & Release Systems Industry Revenue (Million), by Asia-Pacific 2024 & 2032
- Figure 23: North America Weapons Carriage & Release Systems Industry Revenue Share (%), by Asia-Pacific 2024 & 2032
- Figure 24: North America Weapons Carriage & Release Systems Industry Revenue (Million), by Latin America 2024 & 2032
- Figure 25: North America Weapons Carriage & Release Systems Industry Revenue Share (%), by Latin America 2024 & 2032
- Figure 26: North America Weapons Carriage & Release Systems Industry Revenue (Million), by Middle East and Africa 2024 & 2032
- Figure 27: North America Weapons Carriage & Release Systems Industry Revenue Share (%), by Middle East and Africa 2024 & 2032
- Figure 28: North America Weapons Carriage & Release Systems Industry Revenue (Million), by Country 2024 & 2032
- Figure 29: North America Weapons Carriage & Release Systems Industry Revenue Share (%), by Country 2024 & 2032
- Figure 30: South America Weapons Carriage & Release Systems Industry Revenue (Million), by Platform 2024 & 2032
- Figure 31: South America Weapons Carriage & Release Systems Industry Revenue Share (%), by Platform 2024 & 2032
- Figure 32: South America Weapons Carriage & Release Systems Industry Revenue (Million), by Weapon Type 2024 & 2032
- Figure 33: South America Weapons Carriage & Release Systems Industry Revenue Share (%), by Weapon Type 2024 & 2032
- Figure 34: South America Weapons Carriage & Release Systems Industry Revenue (Million), by Geography 2024 & 2032
- Figure 35: South America Weapons Carriage & Release Systems Industry Revenue Share (%), by Geography 2024 & 2032
- Figure 36: South America Weapons Carriage & Release Systems Industry Revenue (Million), by North America 2024 & 2032
- Figure 37: South America Weapons Carriage & Release Systems Industry Revenue Share (%), by North America 2024 & 2032
- Figure 38: South America Weapons Carriage & Release Systems Industry Revenue (Million), by Europe 2024 & 2032
- Figure 39: South America Weapons Carriage & Release Systems Industry Revenue Share (%), by Europe 2024 & 2032
- Figure 40: South America Weapons Carriage & Release Systems Industry Revenue (Million), by Asia-Pacific 2024 & 2032
- Figure 41: South America Weapons Carriage & Release Systems Industry Revenue Share (%), by Asia-Pacific 2024 & 2032
- Figure 42: South America Weapons Carriage & Release Systems Industry Revenue (Million), by Latin America 2024 & 2032
- Figure 43: South America Weapons Carriage & Release Systems Industry Revenue Share (%), by Latin America 2024 & 2032
- Figure 44: South America Weapons Carriage & Release Systems Industry Revenue (Million), by Middle East and Africa 2024 & 2032
- Figure 45: South America Weapons Carriage & Release Systems Industry Revenue Share (%), by Middle East and Africa 2024 & 2032
- Figure 46: South America Weapons Carriage & Release Systems Industry Revenue (Million), by Country 2024 & 2032
- Figure 47: South America Weapons Carriage & Release Systems Industry Revenue Share (%), by Country 2024 & 2032
- Figure 48: Europe Weapons Carriage & Release Systems Industry Revenue (Million), by Platform 2024 & 2032
- Figure 49: Europe Weapons Carriage & Release Systems Industry Revenue Share (%), by Platform 2024 & 2032
- Figure 50: Europe Weapons Carriage & Release Systems Industry Revenue (Million), by Weapon Type 2024 & 2032
- Figure 51: Europe Weapons Carriage & Release Systems Industry Revenue Share (%), by Weapon Type 2024 & 2032
- Figure 52: Europe Weapons Carriage & Release Systems Industry Revenue (Million), by Geography 2024 & 2032
- Figure 53: Europe Weapons Carriage & Release Systems Industry Revenue Share (%), by Geography 2024 & 2032
- Figure 54: Europe Weapons Carriage & Release Systems Industry Revenue (Million), by North America 2024 & 2032
- Figure 55: Europe Weapons Carriage & Release Systems Industry Revenue Share (%), by North America 2024 & 2032
- Figure 56: Europe Weapons Carriage & Release Systems Industry Revenue (Million), by Europe 2024 & 2032
- Figure 57: Europe Weapons Carriage & Release Systems Industry Revenue Share (%), by Europe 2024 & 2032
- Figure 58: Europe Weapons Carriage & Release Systems Industry Revenue (Million), by Asia-Pacific 2024 & 2032
- Figure 59: Europe Weapons Carriage & Release Systems Industry Revenue Share (%), by Asia-Pacific 2024 & 2032
- Figure 60: Europe Weapons Carriage & Release Systems Industry Revenue (Million), by Latin America 2024 & 2032
- Figure 61: Europe Weapons Carriage & Release Systems Industry Revenue Share (%), by Latin America 2024 & 2032
- Figure 62: Europe Weapons Carriage & Release Systems Industry Revenue (Million), by Middle East and Africa 2024 & 2032
- Figure 63: Europe Weapons Carriage & Release Systems Industry Revenue Share (%), by Middle East and Africa 2024 & 2032
- Figure 64: Europe Weapons Carriage & Release Systems Industry Revenue (Million), by Country 2024 & 2032
- Figure 65: Europe Weapons Carriage & Release Systems Industry Revenue Share (%), by Country 2024 & 2032
- Figure 66: Middle East & Africa Weapons Carriage & Release Systems Industry Revenue (Million), by Platform 2024 & 2032
- Figure 67: Middle East & Africa Weapons Carriage & Release Systems Industry Revenue Share (%), by Platform 2024 & 2032
- Figure 68: Middle East & Africa Weapons Carriage & Release Systems Industry Revenue (Million), by Weapon Type 2024 & 2032
- Figure 69: Middle East & Africa Weapons Carriage & Release Systems Industry Revenue Share (%), by Weapon Type 2024 & 2032
- Figure 70: Middle East & Africa Weapons Carriage & Release Systems Industry Revenue (Million), by Geography 2024 & 2032
- Figure 71: Middle East & Africa Weapons Carriage & Release Systems Industry Revenue Share (%), by Geography 2024 & 2032
- Figure 72: Middle East & Africa Weapons Carriage & Release Systems Industry Revenue (Million), by North America 2024 & 2032
- Figure 73: Middle East & Africa Weapons Carriage & Release Systems Industry Revenue Share (%), by North America 2024 & 2032
- Figure 74: Middle East & Africa Weapons Carriage & Release Systems Industry Revenue (Million), by Europe 2024 & 2032
- Figure 75: Middle East & Africa Weapons Carriage & Release Systems Industry Revenue Share (%), by Europe 2024 & 2032
- Figure 76: Middle East & Africa Weapons Carriage & Release Systems Industry Revenue (Million), by Asia-Pacific 2024 & 2032
- Figure 77: Middle East & Africa Weapons Carriage & Release Systems Industry Revenue Share (%), by Asia-Pacific 2024 & 2032
- Figure 78: Middle East & Africa Weapons Carriage & Release Systems Industry Revenue (Million), by Latin America 2024 & 2032
- Figure 79: Middle East & Africa Weapons Carriage & Release Systems Industry Revenue Share (%), by Latin America 2024 & 2032
- Figure 80: Middle East & Africa Weapons Carriage & Release Systems Industry Revenue (Million), by Middle East and Africa 2024 & 2032
- Figure 81: Middle East & Africa Weapons Carriage & Release Systems Industry Revenue Share (%), by Middle East and Africa 2024 & 2032
- Figure 82: Middle East & Africa Weapons Carriage & Release Systems Industry Revenue (Million), by Country 2024 & 2032
- Figure 83: Middle East & Africa Weapons Carriage & Release Systems Industry Revenue Share (%), by Country 2024 & 2032
- Figure 84: Asia Pacific Weapons Carriage & Release Systems Industry Revenue (Million), by Platform 2024 & 2032
- Figure 85: Asia Pacific Weapons Carriage & Release Systems Industry Revenue Share (%), by Platform 2024 & 2032
- Figure 86: Asia Pacific Weapons Carriage & Release Systems Industry Revenue (Million), by Weapon Type 2024 & 2032
- Figure 87: Asia Pacific Weapons Carriage & Release Systems Industry Revenue Share (%), by Weapon Type 2024 & 2032
- Figure 88: Asia Pacific Weapons Carriage & Release Systems Industry Revenue (Million), by Geography 2024 & 2032
- Figure 89: Asia Pacific Weapons Carriage & Release Systems Industry Revenue Share (%), by Geography 2024 & 2032
- Figure 90: Asia Pacific Weapons Carriage & Release Systems Industry Revenue (Million), by North America 2024 & 2032
- Figure 91: Asia Pacific Weapons Carriage & Release Systems Industry Revenue Share (%), by North America 2024 & 2032
- Figure 92: Asia Pacific Weapons Carriage & Release Systems Industry Revenue (Million), by Europe 2024 & 2032
- Figure 93: Asia Pacific Weapons Carriage & Release Systems Industry Revenue Share (%), by Europe 2024 & 2032
- Figure 94: Asia Pacific Weapons Carriage & Release Systems Industry Revenue (Million), by Asia-Pacific 2024 & 2032
- Figure 95: Asia Pacific Weapons Carriage & Release Systems Industry Revenue Share (%), by Asia-Pacific 2024 & 2032
- Figure 96: Asia Pacific Weapons Carriage & Release Systems Industry Revenue (Million), by Latin America 2024 & 2032
- Figure 97: Asia Pacific Weapons Carriage & Release Systems Industry Revenue Share (%), by Latin America 2024 & 2032
- Figure 98: Asia Pacific Weapons Carriage & Release Systems Industry Revenue (Million), by Middle East and Africa 2024 & 2032
- Figure 99: Asia Pacific Weapons Carriage & Release Systems Industry Revenue Share (%), by Middle East and Africa 2024 & 2032
- Figure 100: Asia Pacific Weapons Carriage & Release Systems Industry Revenue (Million), by Country 2024 & 2032
- Figure 101: Asia Pacific Weapons Carriage & Release Systems Industry Revenue Share (%), by Country 2024 & 2032
List of Tables
- Table 1: Global Weapons Carriage & Release Systems Industry Revenue Million Forecast, by Region 2019 & 2032
- Table 2: Global Weapons Carriage & Release Systems Industry Revenue Million Forecast, by Platform 2019 & 2032
- Table 3: Global Weapons Carriage & Release Systems Industry Revenue Million Forecast, by Weapon Type 2019 & 2032
- Table 4: Global Weapons Carriage & Release Systems Industry Revenue Million Forecast, by Geography 2019 & 2032
- Table 5: Global Weapons Carriage & Release Systems Industry Revenue Million Forecast, by North America 2019 & 2032
- Table 6: Global Weapons Carriage & Release Systems Industry Revenue Million Forecast, by Europe 2019 & 2032
- Table 7: Global Weapons Carriage & Release Systems Industry Revenue Million Forecast, by Asia-Pacific 2019 & 2032
- Table 8: Global Weapons Carriage & Release Systems Industry Revenue Million Forecast, by Latin America 2019 & 2032
- Table 9: Global Weapons Carriage & Release Systems Industry Revenue Million Forecast, by Middle East and Africa 2019 & 2032
- Table 10: Global Weapons Carriage & Release Systems Industry Revenue Million Forecast, by Region 2019 & 2032
- Table 11: Global Weapons Carriage & Release Systems Industry Revenue Million Forecast, by Country 2019 & 2032
- Table 12: United States Weapons Carriage & Release Systems Industry Revenue (Million) Forecast, by Application 2019 & 2032
- Table 13: Canada Weapons Carriage & Release Systems Industry Revenue (Million) Forecast, by Application 2019 & 2032
- Table 14: Global Weapons Carriage & Release Systems Industry Revenue Million Forecast, by Country 2019 & 2032
- Table 15: Germany Weapons Carriage & Release Systems Industry Revenue (Million) Forecast, by Application 2019 & 2032
- Table 16: United Kingdom Weapons Carriage & Release Systems Industry Revenue (Million) Forecast, by Application 2019 & 2032
- Table 17: France Weapons Carriage & Release Systems Industry Revenue (Million) Forecast, by Application 2019 & 2032
- Table 18: Russia Weapons Carriage & Release Systems Industry Revenue (Million) Forecast, by Application 2019 & 2032
- Table 19: Rest of Europe Weapons Carriage & Release Systems Industry Revenue (Million) Forecast, by Application 2019 & 2032
- Table 20: Global Weapons Carriage & Release Systems Industry Revenue Million Forecast, by Country 2019 & 2032
- Table 21: India Weapons Carriage & Release Systems Industry Revenue (Million) Forecast, by Application 2019 & 2032
- Table 22: China Weapons Carriage & Release Systems Industry Revenue (Million) Forecast, by Application 2019 & 2032
- Table 23: Japan Weapons Carriage & Release Systems Industry Revenue (Million) Forecast, by Application 2019 & 2032
- Table 24: South Korea Weapons Carriage & Release Systems Industry Revenue (Million) Forecast, by Application 2019 & 2032
- Table 25: Rest of Asia Pacific Weapons Carriage & Release Systems Industry Revenue (Million) Forecast, by Application 2019 & 2032
- Table 26: Global Weapons Carriage & Release Systems Industry Revenue Million Forecast, by Country 2019 & 2032
- Table 27: Brazil Weapons Carriage & Release Systems Industry Revenue (Million) Forecast, by Application 2019 & 2032
- Table 28: Rest of Latin America Weapons Carriage & Release Systems Industry Revenue (Million) Forecast, by Application 2019 & 2032
- Table 29: Global Weapons Carriage & Release Systems Industry Revenue Million Forecast, by Country 2019 & 2032
- Table 30: United Arab Emirates Weapons Carriage & Release Systems Industry Revenue (Million) Forecast, by Application 2019 & 2032
- Table 31: Saudi Arabia Weapons Carriage & Release Systems Industry Revenue (Million) Forecast, by Application 2019 & 2032
- Table 32: Israel Weapons Carriage & Release Systems Industry Revenue (Million) Forecast, by Application 2019 & 2032
- Table 33: Rest of Middle East and Africa Weapons Carriage & Release Systems Industry Revenue (Million) Forecast, by Application 2019 & 2032
- Table 34: Global Weapons Carriage & Release Systems Industry Revenue Million Forecast, by Platform 2019 & 2032
- Table 35: Global Weapons Carriage & Release Systems Industry Revenue Million Forecast, by Weapon Type 2019 & 2032
- Table 36: Global Weapons Carriage & Release Systems Industry Revenue Million Forecast, by Geography 2019 & 2032
- Table 37: Global Weapons Carriage & Release Systems Industry Revenue Million Forecast, by North America 2019 & 2032
- Table 38: Global Weapons Carriage & Release Systems Industry Revenue Million Forecast, by Europe 2019 & 2032
- Table 39: Global Weapons Carriage & Release Systems Industry Revenue Million Forecast, by Asia-Pacific 2019 & 2032
- Table 40: Global Weapons Carriage & Release Systems Industry Revenue Million Forecast, by Latin America 2019 & 2032
- Table 41: Global Weapons Carriage & Release Systems Industry Revenue Million Forecast, by Middle East and Africa 2019 & 2032
- Table 42: Global Weapons Carriage & Release Systems Industry Revenue Million Forecast, by Country 2019 & 2032
- Table 43: United States Weapons Carriage & Release Systems Industry Revenue (Million) Forecast, by Application 2019 & 2032
- Table 44: Canada Weapons Carriage & Release Systems Industry Revenue (Million) Forecast, by Application 2019 & 2032
- Table 45: Mexico Weapons Carriage & Release Systems Industry Revenue (Million) Forecast, by Application 2019 & 2032
- Table 46: Global Weapons Carriage & Release Systems Industry Revenue Million Forecast, by Platform 2019 & 2032
- Table 47: Global Weapons Carriage & Release Systems Industry Revenue Million Forecast, by Weapon Type 2019 & 2032
- Table 48: Global Weapons Carriage & Release Systems Industry Revenue Million Forecast, by Geography 2019 & 2032
- Table 49: Global Weapons Carriage & Release Systems Industry Revenue Million Forecast, by North America 2019 & 2032
- Table 50: Global Weapons Carriage & Release Systems Industry Revenue Million Forecast, by Europe 2019 & 2032
- Table 51: Global Weapons Carriage & Release Systems Industry Revenue Million Forecast, by Asia-Pacific 2019 & 2032
- Table 52: Global Weapons Carriage & Release Systems Industry Revenue Million Forecast, by Latin America 2019 & 2032
- Table 53: Global Weapons Carriage & Release Systems Industry Revenue Million Forecast, by Middle East and Africa 2019 & 2032
- Table 54: Global Weapons Carriage & Release Systems Industry Revenue Million Forecast, by Country 2019 & 2032
- Table 55: Brazil Weapons Carriage & Release Systems Industry Revenue (Million) Forecast, by Application 2019 & 2032
- Table 56: Argentina Weapons Carriage & Release Systems Industry Revenue (Million) Forecast, by Application 2019 & 2032
- Table 57: Rest of South America Weapons Carriage & Release Systems Industry Revenue (Million) Forecast, by Application 2019 & 2032
- Table 58: Global Weapons Carriage & Release Systems Industry Revenue Million Forecast, by Platform 2019 & 2032
- Table 59: Global Weapons Carriage & Release Systems Industry Revenue Million Forecast, by Weapon Type 2019 & 2032
- Table 60: Global Weapons Carriage & Release Systems Industry Revenue Million Forecast, by Geography 2019 & 2032
- Table 61: Global Weapons Carriage & Release Systems Industry Revenue Million Forecast, by North America 2019 & 2032
- Table 62: Global Weapons Carriage & Release Systems Industry Revenue Million Forecast, by Europe 2019 & 2032
- Table 63: Global Weapons Carriage & Release Systems Industry Revenue Million Forecast, by Asia-Pacific 2019 & 2032
- Table 64: Global Weapons Carriage & Release Systems Industry Revenue Million Forecast, by Latin America 2019 & 2032
- Table 65: Global Weapons Carriage & Release Systems Industry Revenue Million Forecast, by Middle East and Africa 2019 & 2032
- Table 66: Global Weapons Carriage & Release Systems Industry Revenue Million Forecast, by Country 2019 & 2032
- Table 67: United Kingdom Weapons Carriage & Release Systems Industry Revenue (Million) Forecast, by Application 2019 & 2032
- Table 68: Germany Weapons Carriage & Release Systems Industry Revenue (Million) Forecast, by Application 2019 & 2032
- Table 69: France Weapons Carriage & Release Systems Industry Revenue (Million) Forecast, by Application 2019 & 2032
- Table 70: Italy Weapons Carriage & Release Systems Industry Revenue (Million) Forecast, by Application 2019 & 2032
- Table 71: Spain Weapons Carriage & Release Systems Industry Revenue (Million) Forecast, by Application 2019 & 2032
- Table 72: Russia Weapons Carriage & Release Systems Industry Revenue (Million) Forecast, by Application 2019 & 2032
- Table 73: Benelux Weapons Carriage & Release Systems Industry Revenue (Million) Forecast, by Application 2019 & 2032
- Table 74: Nordics Weapons Carriage & Release Systems Industry Revenue (Million) Forecast, by Application 2019 & 2032
- Table 75: Rest of Europe Weapons Carriage & Release Systems Industry Revenue (Million) Forecast, by Application 2019 & 2032
- Table 76: Global Weapons Carriage & Release Systems Industry Revenue Million Forecast, by Platform 2019 & 2032
- Table 77: Global Weapons Carriage & Release Systems Industry Revenue Million Forecast, by Weapon Type 2019 & 2032
- Table 78: Global Weapons Carriage & Release Systems Industry Revenue Million Forecast, by Geography 2019 & 2032
- Table 79: Global Weapons Carriage & Release Systems Industry Revenue Million Forecast, by North America 2019 & 2032
- Table 80: Global Weapons Carriage & Release Systems Industry Revenue Million Forecast, by Europe 2019 & 2032
- Table 81: Global Weapons Carriage & Release Systems Industry Revenue Million Forecast, by Asia-Pacific 2019 & 2032
- Table 82: Global Weapons Carriage & Release Systems Industry Revenue Million Forecast, by Latin America 2019 & 2032
- Table 83: Global Weapons Carriage & Release Systems Industry Revenue Million Forecast, by Middle East and Africa 2019 & 2032
- Table 84: Global Weapons Carriage & Release Systems Industry Revenue Million Forecast, by Country 2019 & 2032
- Table 85: Turkey Weapons Carriage & Release Systems Industry Revenue (Million) Forecast, by Application 2019 & 2032
- Table 86: Israel Weapons Carriage & Release Systems Industry Revenue (Million) Forecast, by Application 2019 & 2032
- Table 87: GCC Weapons Carriage & Release Systems Industry Revenue (Million) Forecast, by Application 2019 & 2032
- Table 88: North Africa Weapons Carriage & Release Systems Industry Revenue (Million) Forecast, by Application 2019 & 2032
- Table 89: South Africa Weapons Carriage & Release Systems Industry Revenue (Million) Forecast, by Application 2019 & 2032
- Table 90: Rest of Middle East & Africa Weapons Carriage & Release Systems Industry Revenue (Million) Forecast, by Application 2019 & 2032
- Table 91: Global Weapons Carriage & Release Systems Industry Revenue Million Forecast, by Platform 2019 & 2032
- Table 92: Global Weapons Carriage & Release Systems Industry Revenue Million Forecast, by Weapon Type 2019 & 2032
- Table 93: Global Weapons Carriage & Release Systems Industry Revenue Million Forecast, by Geography 2019 & 2032
- Table 94: Global Weapons Carriage & Release Systems Industry Revenue Million Forecast, by North America 2019 & 2032
- Table 95: Global Weapons Carriage & Release Systems Industry Revenue Million Forecast, by Europe 2019 & 2032
- Table 96: Global Weapons Carriage & Release Systems Industry Revenue Million Forecast, by Asia-Pacific 2019 & 2032
- Table 97: Global Weapons Carriage & Release Systems Industry Revenue Million Forecast, by Latin America 2019 & 2032
- Table 98: Global Weapons Carriage & Release Systems Industry Revenue Million Forecast, by Middle East and Africa 2019 & 2032
- Table 99: Global Weapons Carriage & Release Systems Industry Revenue Million Forecast, by Country 2019 & 2032
- Table 100: China Weapons Carriage & Release Systems Industry Revenue (Million) Forecast, by Application 2019 & 2032
- Table 101: India Weapons Carriage & Release Systems Industry Revenue (Million) Forecast, by Application 2019 & 2032
- Table 102: Japan Weapons Carriage & Release Systems Industry Revenue (Million) Forecast, by Application 2019 & 2032
- Table 103: South Korea Weapons Carriage & Release Systems Industry Revenue (Million) Forecast, by Application 2019 & 2032
- Table 104: ASEAN Weapons Carriage & Release Systems Industry Revenue (Million) Forecast, by Application 2019 & 2032
- Table 105: Oceania Weapons Carriage & Release Systems Industry Revenue (Million) Forecast, by Application 2019 & 2032
- Table 106: Rest of Asia Pacific Weapons Carriage & Release Systems Industry Revenue (Million) Forecast, by Application 2019 & 2032
Frequently Asked Questions
1. What is the projected Compound Annual Growth Rate (CAGR) of the Weapons Carriage & Release Systems Industry?
The projected CAGR is approximately 4.19%.
2. Which companies are prominent players in the Weapons Carriage & Release Systems Industry?
Key companies in the market include The Marvin Group, L3Harris Technologies Inc, Systima Technologies Inc (Karman Space & Defense, Cobham Limited, Moog Inc, RTX Corporation, Alkan, Marotta Controls Inc.
3. What are the main segments of the Weapons Carriage & Release Systems Industry?
The market segments include Platform, Weapon Type, Geography, North America, Europe, Asia-Pacific, Latin America, Middle East and Africa.
4. Can you provide details about the market size?
The market size is estimated to be USD 409.12 Million as of 2022.
5. What are some drivers contributing to market growth?
N/A
6. What are the notable trends driving market growth?
Aircraft Platform to Dominate the Market.
7. Are there any restraints impacting market growth?
N/A
8. Can you provide examples of recent developments in the market?
N/A
9. What pricing options are available for accessing the report?
Pricing options include single-user, multi-user, and enterprise licenses priced at USD 4750, USD 5250, and USD 8750 respectively.
10. Is the market size provided in terms of value or volume?
The market size is provided in terms of value, measured in Million.
11. Are there any specific market keywords associated with the report?
Yes, the market keyword associated with the report is "Weapons Carriage & Release Systems Industry," which aids in identifying and referencing the specific market segment covered.
12. How do I determine which pricing option suits my needs best?
The pricing options vary based on user requirements and access needs. Individual users may opt for single-user licenses, while businesses requiring broader access may choose multi-user or enterprise licenses for cost-effective access to the report.
13. Are there any additional resources or data provided in the Weapons Carriage & Release Systems Industry report?
While the report offers comprehensive insights, it's advisable to review the specific contents or supplementary materials provided to ascertain if additional resources or data are available.
14. How can I stay updated on further developments or reports in the Weapons Carriage & Release Systems Industry?
To stay informed about further developments, trends, and reports in the Weapons Carriage & Release Systems Industry, consider subscribing to industry newsletters, following relevant companies and organizations, or regularly checking reputable industry news sources and publications.
Methodology
Step 1 - Identification of Relevant Samples Size from Population Database


Step 2 - Approaches for Defining Global Market Size (Value, Volume* & Price*)

Note*: In applicable scenarios
Step 3 - Data Sources
Primary Research
- Web Analytics
- Survey Reports
- Research Institute
- Latest Research Reports
- Opinion Leaders
Secondary Research
- Annual Reports
- White Paper
- Latest Press Release
- Industry Association
- Paid Database
- Investor Presentations

Step 4 - Data Triangulation
Involves using different sources of information in order to increase the validity of a study
These sources are likely to be stakeholders in a program - participants, other researchers, program staff, other community members, and so on.
Then we put all data in single framework & apply various statistical tools to find out the dynamic on the market.
During the analysis stage, feedback from the stakeholder groups would be compared to determine areas of agreement as well as areas of divergence


