

Key Insights
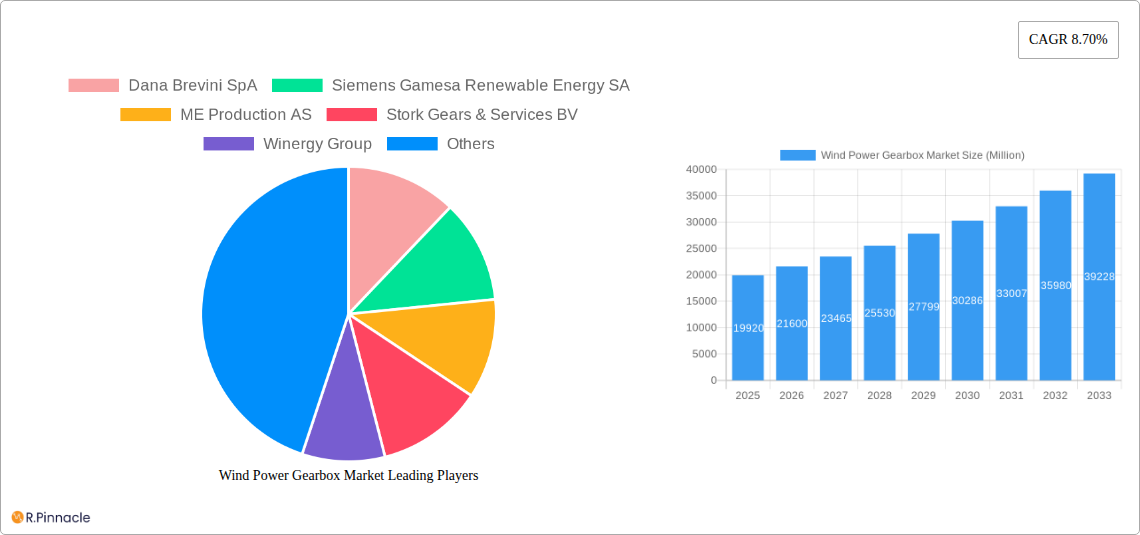
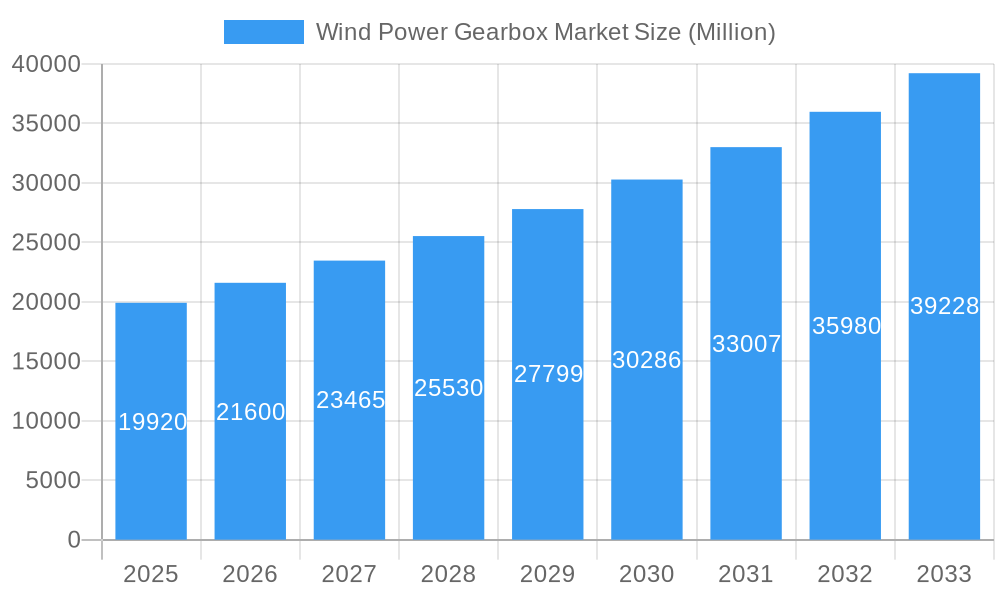
The global wind power gearbox market, valued at $19.92 billion in 2025, is projected to experience robust growth, driven by the escalating demand for renewable energy sources and the increasing deployment of onshore and offshore wind farms. A compound annual growth rate (CAGR) of 8.70% from 2025 to 2033 indicates a significant expansion of the market, reaching an estimated value exceeding $40 billion by 2033. This growth is fueled by several key factors. Government incentives and supportive policies aimed at reducing carbon emissions are stimulating investments in wind energy projects globally. Technological advancements, such as the development of more efficient and durable gearboxes designed to withstand harsher offshore environments, are also contributing to market expansion. Furthermore, the increasing capacity of wind turbines necessitates larger and more sophisticated gearboxes, driving demand for higher-capacity models. Competition among major players, including Dana Brevini SpA, Siemens Gamesa Renewable Energy SA, and ZF Friedrichshafen AG, is further intensifying innovation and driving down costs, making wind energy more economically viable.
Wind Power Gearbox Market Market Size (In Billion)
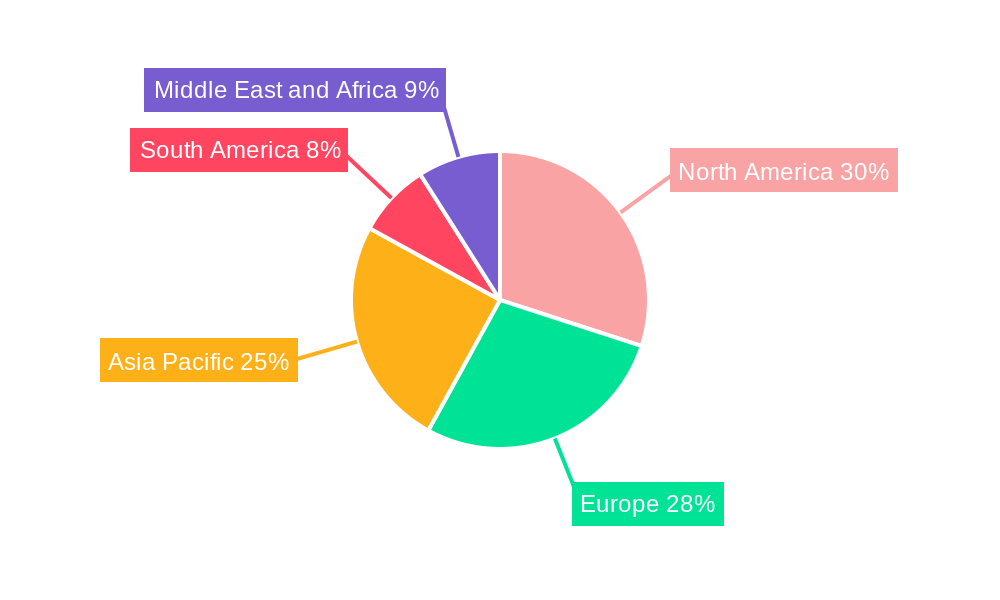
However, the market faces some challenges. The high initial investment costs associated with wind power projects, along with the potential for supply chain disruptions and material price fluctuations, could pose some restraints to growth. The geographical distribution of the market is also uneven, with North America, Europe, and Asia-Pacific representing the largest market segments due to significant wind energy projects in these regions. Nevertheless, the long-term outlook for the wind power gearbox market remains positive, as the global transition towards cleaner energy sources continues to accelerate, thereby fueling demand for robust and efficient gearbox technologies. The continued development of innovative designs and the expansion of wind farm projects, particularly in emerging markets, are expected to drive significant growth throughout the forecast period.
Wind Power Gearbox Market Company Market Share
Wind Power Gearbox Market Report: 2019-2033 Forecast
This comprehensive report provides an in-depth analysis of the global Wind Power Gearbox Market, offering valuable insights for industry professionals, investors, and strategic decision-makers. Covering the period from 2019 to 2033, with a focus on 2025, this report unveils the market's structure, dynamics, key players, and future outlook. The report leverages extensive data and analysis to project a compound annual growth rate (CAGR) of xx% during the forecast period (2025-2033).
Wind Power Gearbox Market Structure & Innovation Trends
This section analyzes the competitive landscape of the wind power gearbox market, examining market concentration, innovation drivers, regulatory influences, and market dynamics. We explore the role of mergers and acquisitions (M&A) activity, quantifying deal values where possible.
Market Concentration: The market exhibits a moderately concentrated structure, with a few major players holding significant market share. The top five companies—Dana Brevini SpA, Siemens Gamesa Renewable Energy SA, ME Production AS, Stork Gears & Services BV, and Winergy Group—account for approximately xx% of the total market share in 2025. Other key players include Turbine Repair Solutions, Elecon Engineering Company Limited, ZF Friedrichshafen AG, and several smaller regional players.
Innovation Drivers: Key innovation drivers include the increasing demand for higher capacity wind turbines, advancements in bearing technology (as seen with SKF's innovations), and the development of more efficient and durable gearbox designs. These innovations focus on reducing weight, enhancing reliability, and lowering the levelized cost of energy (LCOE).
Regulatory Frameworks: Government policies promoting renewable energy adoption, including subsidies and tax incentives, significantly influence market growth. Stringent environmental regulations also drive the adoption of more efficient and sustainable gearbox technologies.
Product Substitutes: While gearboxes remain dominant, the market faces pressure from alternative drivetrain technologies like direct-drive systems. However, gearboxes maintain a competitive edge in terms of cost-effectiveness for many applications.
M&A Activities: The wind power gearbox market has witnessed moderate M&A activity in recent years, with deal values totaling approximately $xx Million in 2024. These transactions often involve strategic partnerships to enhance technological capabilities or expand geographical reach.
Wind Power Gearbox Market Dynamics & Trends
This section delves into the market's growth drivers, technological disruptions, and competitive dynamics, providing a comprehensive understanding of the market's evolution. We analyze market growth drivers, technological disruptions, consumer preferences, and competitive dynamics, with a focus on the impact of these factors on market penetration and the overall CAGR.
The market's growth is primarily driven by the expanding global renewable energy sector, coupled with favorable government policies and a growing awareness of climate change. Technological advancements, leading to more efficient and reliable gearboxes, contribute significantly to market expansion. The increasing demand for larger capacity wind turbines, particularly offshore, creates further opportunities. However, intense competition among established players and emerging technologies, like direct drive systems, present challenges. The market is projected to witness a CAGR of xx% during the forecast period, driven by increasing wind power installations globally, especially in Asia and Europe. Market penetration of advanced gearbox technologies is expected to increase from xx% in 2025 to xx% by 2033.
Dominant Regions & Segments in Wind Power Gearbox Market
This section identifies the leading regions and segments within the wind power gearbox market, focusing on onshore and offshore deployments.
The onshore segment currently dominates the market, accounting for xx% of the total market share in 2025, due to the higher number of onshore wind farms globally. However, the offshore segment is projected to witness faster growth, driven by technological advancements allowing for larger and more efficient offshore wind turbines.
Onshore Segment Key Drivers:
- Abundant land availability in many regions.
- Lower initial investment costs compared to offshore installations.
- Easier access for maintenance and repair.
- Established grid infrastructure in many areas.
Offshore Segment Key Drivers:
- Higher wind speeds and energy yields compared to onshore locations.
- Growing government support for offshore wind energy projects.
- Technological advancements making offshore installations more cost-effective.
The leading region for wind power gearbox deployment is currently Asia, followed by Europe and North America. Asia's dominance is driven by large-scale wind power projects in countries like China and India. Europe benefits from established renewable energy policies and infrastructure, while North America's market is driven by increasing government investments and technological advancements.
Wind Power Gearbox Market Product Innovations
Recent innovations in wind power gearboxes focus on enhancing efficiency, durability, and reducing weight. Advancements in bearing technology, as demonstrated by SKF, allow for more compact designs and improved performance. Modular gearbox designs are also gaining traction, facilitating easier maintenance and customization. These innovations are crucial in responding to the growing demand for larger and more efficient wind turbines, especially in the offshore sector. The market fit for these innovations is strong, driven by the increasing need for cost-effective and reliable solutions in the renewable energy sector.
Report Scope & Segmentation Analysis
This report segments the wind power gearbox market based on location of deployment: Onshore and Offshore.
Onshore: The onshore segment is characterized by a relatively mature market with established players and a large installed base. This segment is projected to grow at a CAGR of xx% during the forecast period, driven by continued expansion of onshore wind farms globally. Competitive dynamics are intense, with established players facing challenges from new entrants offering innovative solutions.
Offshore: The offshore segment is characterized by rapid growth, driven by the increasing adoption of large-scale offshore wind farms. This segment is projected to grow at a CAGR of xx% during the forecast period, outpacing the onshore segment. The competitive landscape is evolving, with a focus on technological innovation and strategic partnerships.
Key Drivers of Wind Power Gearbox Market Growth
The growth of the wind power gearbox market is propelled by several key factors. Firstly, the global push towards renewable energy sources, driven by climate change concerns and government policies promoting sustainable energy, is a major catalyst. Secondly, technological advancements in gearbox design, materials, and manufacturing processes are leading to more efficient and reliable products. Finally, the increasing demand for higher-capacity wind turbines, particularly in offshore environments, creates substantial market opportunities.
Challenges in the Wind Power Gearbox Market Sector
Despite the promising outlook, the wind power gearbox market faces significant challenges. Supply chain disruptions can lead to production delays and cost increases. Intense competition among manufacturers exerts downward pressure on prices and profit margins. The increasing complexity of modern wind turbines adds to the challenges of maintenance and repair, increasing operational costs. Furthermore, the need for skilled labor for installation and maintenance is another key challenge.
Emerging Opportunities in Wind Power Gearbox Market
The wind power gearbox market presents several promising opportunities. The growing adoption of larger capacity wind turbines opens up possibilities for specialized gearbox designs. Advancements in digital technologies, including predictive maintenance and remote diagnostics, offer opportunities for optimizing gearbox performance and reducing downtime. Expansion into new markets, particularly in developing economies with significant renewable energy potential, presents substantial growth opportunities.
Leading Players in the Wind Power Gearbox Market Market
- Dana Brevini SpA
- Siemens Gamesa Renewable Energy SA
- ME Production AS
- Stork Gears & Services BV
- Winergy Group
- Turbine Repair Solutions
- Elecon Engineering Company Limited
- ZF Friedrichshafen AG
Key Developments in Wind Power Gearbox Market Industry
September 2023: Sany Renewable Energy unveils its 919 wind turbine platform, featuring modular gearboxes designed for 8.5 MW to 11 MW turbines. This indicates a trend towards higher capacity and modular design.
June 2022: Eickhoff Wind Asia opens a state-of-the-art manufacturing facility in Chennai, expanding its Asian presence and capacity for gearboxes up to 8 MW. This highlights the growing importance of the Asian market.
March 2022: SKF introduces innovative rolling bearing technology, reducing drivetrain weight and potentially increasing turbine size while adhering to transportation constraints. This showcases advancements in core component technology.
Future Outlook for Wind Power Gearbox Market Market
The future of the wind power gearbox market is bright, driven by the continued growth of the renewable energy sector and ongoing technological advancements. The increasing demand for larger, more efficient wind turbines, particularly in offshore applications, will fuel demand for advanced gearbox technologies. Strategic partnerships and M&A activity will likely shape the competitive landscape, leading to further innovation and consolidation within the market. The focus on reducing LCOE and enhancing reliability will continue to drive product development and market expansion.
Wind Power Gearbox Market Segmentation
-
1. Location of Deployment
- 1.1. Onshore
- 1.2. Offshore
Wind Power Gearbox Market Segmentation By Geography
-
1. North America
- 1.1. United States
- 1.2. Canada
- 1.3. Rest of North America
-
2. Asia Pacific
- 2.1. China
- 2.2. India
- 2.3. Japan
- 2.4. Asutralia
- 2.5. Rest of Asia Pacific
-
3. Europe
- 3.1. United Kingdom
- 3.2. Germany
- 3.3. France
- 3.4. Spain
- 3.5. Rest of Europe
-
4. South America
- 4.1. Brazil
- 4.2. Argentina
- 4.3. Chile
- 4.4. Rest of South America
-
5. Middle East and Africa
- 5.1. Saudi Arabia
- 5.2. United Arab Emirates
- 5.3. South Africa
- 5.4. Rest of Middle East
Wind Power Gearbox Market Regional Market Share
Geographic Coverage of Wind Power Gearbox Market
Wind Power Gearbox Market REPORT HIGHLIGHTS
| Aspects | Details |
|---|---|
| Study Period | 2020-2034 |
| Base Year | 2025 |
| Estimated Year | 2026 |
| Forecast Period | 2026-2034 |
| Historical Period | 2020-2025 |
| Growth Rate | CAGR of 8.70% from 2020-2034 |
| Segmentation |
|
Table of Contents
- 1. Introduction
- 1.1. Research Scope
- 1.2. Market Segmentation
- 1.3. Research Objective
- 1.4. Definitions and Assumptions
- 2. Executive Summary
- 2.1. Market Snapshot
- 3. Market Dynamics
- 3.1. Market Drivers
- 3.2. Market Restrains
- 3.3. Market Trends
- 3.4. Market Opportunities
- 4. Market Factor Analysis
- 4.1. Porters Five Forces
- 4.1.1. Bargaining Power of Suppliers
- 4.1.2. Bargaining Power of Buyers
- 4.1.3. Threat of New Entrants
- 4.1.4. Threat of Substitutes
- 4.1.5. Competitive Rivalry
- 4.2. PESTEL analysis
- 4.3. BCG Analysis
- 4.3.1. Stars (High Growth, High Market Share)
- 4.3.2. Cash Cows (Low Growth, High Market Share)
- 4.3.3. Question Mark (High Growth, Low Market Share)
- 4.3.4. Dogs (Low Growth, Low Market Share)
- 4.4. Ansoff Matrix Analysis
- 4.5. Supply Chain Analysis
- 4.6. Regulatory Landscape
- 4.7. Current Market Potential and Opportunity Assessment (TAM–SAM–SOM Framework)
- 4.8. PRI Analyst Note
- 4.1. Porters Five Forces
- 5. Market Analysis, Insights and Forecast 2021-2033
- 5.1. Market Analysis, Insights and Forecast - by Location of Deployment
- 5.1.1. Onshore
- 5.1.2. Offshore
- 5.2. Market Analysis, Insights and Forecast - by Region
- 5.2.1. North America
- 5.2.2. Asia Pacific
- 5.2.3. Europe
- 5.2.4. South America
- 5.2.5. Middle East and Africa
- 5.1. Market Analysis, Insights and Forecast - by Location of Deployment
- 6. Global Wind Power Gearbox Market Analysis, Insights and Forecast, 2021-2033
- 6.1. Market Analysis, Insights and Forecast - by Location of Deployment
- 6.1.1. Onshore
- 6.1.2. Offshore
- 6.1. Market Analysis, Insights and Forecast - by Location of Deployment
- 7. North America Wind Power Gearbox Market Analysis, Insights and Forecast, 2020-2032
- 7.1. Market Analysis, Insights and Forecast - by Location of Deployment
- 7.1.1. Onshore
- 7.1.2. Offshore
- 7.1. Market Analysis, Insights and Forecast - by Location of Deployment
- 8. Asia Pacific Wind Power Gearbox Market Analysis, Insights and Forecast, 2020-2032
- 8.1. Market Analysis, Insights and Forecast - by Location of Deployment
- 8.1.1. Onshore
- 8.1.2. Offshore
- 8.1. Market Analysis, Insights and Forecast - by Location of Deployment
- 9. Europe Wind Power Gearbox Market Analysis, Insights and Forecast, 2020-2032
- 9.1. Market Analysis, Insights and Forecast - by Location of Deployment
- 9.1.1. Onshore
- 9.1.2. Offshore
- 9.1. Market Analysis, Insights and Forecast - by Location of Deployment
- 10. South America Wind Power Gearbox Market Analysis, Insights and Forecast, 2020-2032
- 10.1. Market Analysis, Insights and Forecast - by Location of Deployment
- 10.1.1. Onshore
- 10.1.2. Offshore
- 10.1. Market Analysis, Insights and Forecast - by Location of Deployment
- 11. Middle East and Africa Wind Power Gearbox Market Analysis, Insights and Forecast, 2020-2032
- 11.1. Market Analysis, Insights and Forecast - by Location of Deployment
- 11.1.1. Onshore
- 11.1.2. Offshore
- 11.1. Market Analysis, Insights and Forecast - by Location of Deployment
- 12. Competitive Analysis
- 12.1. Company Profiles
- 12.1.1 Dana Brevini SpA
- 12.1.1.1. Company Overview
- 12.1.1.2. Products
- 12.1.1.3. Company Financials
- 12.1.1.4. SWOT Analysis
- 12.1.2 Siemens Gamesa Renewable Energy SA
- 12.1.2.1. Company Overview
- 12.1.2.2. Products
- 12.1.2.3. Company Financials
- 12.1.2.4. SWOT Analysis
- 12.1.3 ME Production AS
- 12.1.3.1. Company Overview
- 12.1.3.2. Products
- 12.1.3.3. Company Financials
- 12.1.3.4. SWOT Analysis
- 12.1.4 Stork Gears & Services BV
- 12.1.4.1. Company Overview
- 12.1.4.2. Products
- 12.1.4.3. Company Financials
- 12.1.4.4. SWOT Analysis
- 12.1.5 Winergy Group
- 12.1.5.1. Company Overview
- 12.1.5.2. Products
- 12.1.5.3. Company Financials
- 12.1.5.4. SWOT Analysis
- 12.1.6 Turbine Repair Solutions
- 12.1.6.1. Company Overview
- 12.1.6.2. Products
- 12.1.6.3. Company Financials
- 12.1.6.4. SWOT Analysis
- 12.1.7 Elecon Engineering Company Limited*List Not Exhaustive
- 12.1.7.1. Company Overview
- 12.1.7.2. Products
- 12.1.7.3. Company Financials
- 12.1.7.4. SWOT Analysis
- 12.1.8 ZF Friedrichshafen AG
- 12.1.8.1. Company Overview
- 12.1.8.2. Products
- 12.1.8.3. Company Financials
- 12.1.8.4. SWOT Analysis
- 12.1.1 Dana Brevini SpA
- 12.2. Market Entropy
- 12.2.1 Company's Key Areas Served
- 12.2.2 Recent Developments
- 12.3. Company Market Share Analysis 2025
- 12.3.1 Top 5 Companies Market Share Analysis
- 12.3.2 Top 3 Companies Market Share Analysis
- 12.4. List of Potential Customers
- 13. Research Methodology
List of Figures
- Figure 1: Global Wind Power Gearbox Market Revenue Breakdown (Million, %) by Region 2025 & 2033
- Figure 2: Global Wind Power Gearbox Market Volume Breakdown (K Unit, %) by Region 2025 & 2033
- Figure 3: North America Wind Power Gearbox Market Revenue (Million), by Location of Deployment 2025 & 2033
- Figure 4: North America Wind Power Gearbox Market Volume (K Unit), by Location of Deployment 2025 & 2033
- Figure 5: North America Wind Power Gearbox Market Revenue Share (%), by Location of Deployment 2025 & 2033
- Figure 6: North America Wind Power Gearbox Market Volume Share (%), by Location of Deployment 2025 & 2033
- Figure 7: North America Wind Power Gearbox Market Revenue (Million), by Country 2025 & 2033
- Figure 8: North America Wind Power Gearbox Market Volume (K Unit), by Country 2025 & 2033
- Figure 9: North America Wind Power Gearbox Market Revenue Share (%), by Country 2025 & 2033
- Figure 10: North America Wind Power Gearbox Market Volume Share (%), by Country 2025 & 2033
- Figure 11: Asia Pacific Wind Power Gearbox Market Revenue (Million), by Location of Deployment 2025 & 2033
- Figure 12: Asia Pacific Wind Power Gearbox Market Volume (K Unit), by Location of Deployment 2025 & 2033
- Figure 13: Asia Pacific Wind Power Gearbox Market Revenue Share (%), by Location of Deployment 2025 & 2033
- Figure 14: Asia Pacific Wind Power Gearbox Market Volume Share (%), by Location of Deployment 2025 & 2033
- Figure 15: Asia Pacific Wind Power Gearbox Market Revenue (Million), by Country 2025 & 2033
- Figure 16: Asia Pacific Wind Power Gearbox Market Volume (K Unit), by Country 2025 & 2033
- Figure 17: Asia Pacific Wind Power Gearbox Market Revenue Share (%), by Country 2025 & 2033
- Figure 18: Asia Pacific Wind Power Gearbox Market Volume Share (%), by Country 2025 & 2033
- Figure 19: Europe Wind Power Gearbox Market Revenue (Million), by Location of Deployment 2025 & 2033
- Figure 20: Europe Wind Power Gearbox Market Volume (K Unit), by Location of Deployment 2025 & 2033
- Figure 21: Europe Wind Power Gearbox Market Revenue Share (%), by Location of Deployment 2025 & 2033
- Figure 22: Europe Wind Power Gearbox Market Volume Share (%), by Location of Deployment 2025 & 2033
- Figure 23: Europe Wind Power Gearbox Market Revenue (Million), by Country 2025 & 2033
- Figure 24: Europe Wind Power Gearbox Market Volume (K Unit), by Country 2025 & 2033
- Figure 25: Europe Wind Power Gearbox Market Revenue Share (%), by Country 2025 & 2033
- Figure 26: Europe Wind Power Gearbox Market Volume Share (%), by Country 2025 & 2033
- Figure 27: South America Wind Power Gearbox Market Revenue (Million), by Location of Deployment 2025 & 2033
- Figure 28: South America Wind Power Gearbox Market Volume (K Unit), by Location of Deployment 2025 & 2033
- Figure 29: South America Wind Power Gearbox Market Revenue Share (%), by Location of Deployment 2025 & 2033
- Figure 30: South America Wind Power Gearbox Market Volume Share (%), by Location of Deployment 2025 & 2033
- Figure 31: South America Wind Power Gearbox Market Revenue (Million), by Country 2025 & 2033
- Figure 32: South America Wind Power Gearbox Market Volume (K Unit), by Country 2025 & 2033
- Figure 33: South America Wind Power Gearbox Market Revenue Share (%), by Country 2025 & 2033
- Figure 34: South America Wind Power Gearbox Market Volume Share (%), by Country 2025 & 2033
- Figure 35: Middle East and Africa Wind Power Gearbox Market Revenue (Million), by Location of Deployment 2025 & 2033
- Figure 36: Middle East and Africa Wind Power Gearbox Market Volume (K Unit), by Location of Deployment 2025 & 2033
- Figure 37: Middle East and Africa Wind Power Gearbox Market Revenue Share (%), by Location of Deployment 2025 & 2033
- Figure 38: Middle East and Africa Wind Power Gearbox Market Volume Share (%), by Location of Deployment 2025 & 2033
- Figure 39: Middle East and Africa Wind Power Gearbox Market Revenue (Million), by Country 2025 & 2033
- Figure 40: Middle East and Africa Wind Power Gearbox Market Volume (K Unit), by Country 2025 & 2033
- Figure 41: Middle East and Africa Wind Power Gearbox Market Revenue Share (%), by Country 2025 & 2033
- Figure 42: Middle East and Africa Wind Power Gearbox Market Volume Share (%), by Country 2025 & 2033
List of Tables
- Table 1: Global Wind Power Gearbox Market Revenue Million Forecast, by Location of Deployment 2020 & 2033
- Table 2: Global Wind Power Gearbox Market Volume K Unit Forecast, by Location of Deployment 2020 & 2033
- Table 3: Global Wind Power Gearbox Market Revenue Million Forecast, by Region 2020 & 2033
- Table 4: Global Wind Power Gearbox Market Volume K Unit Forecast, by Region 2020 & 2033
- Table 5: Global Wind Power Gearbox Market Revenue Million Forecast, by Location of Deployment 2020 & 2033
- Table 6: Global Wind Power Gearbox Market Volume K Unit Forecast, by Location of Deployment 2020 & 2033
- Table 7: Global Wind Power Gearbox Market Revenue Million Forecast, by Country 2020 & 2033
- Table 8: Global Wind Power Gearbox Market Volume K Unit Forecast, by Country 2020 & 2033
- Table 9: United States Wind Power Gearbox Market Revenue (Million) Forecast, by Application 2020 & 2033
- Table 10: United States Wind Power Gearbox Market Volume (K Unit) Forecast, by Application 2020 & 2033
- Table 11: Canada Wind Power Gearbox Market Revenue (Million) Forecast, by Application 2020 & 2033
- Table 12: Canada Wind Power Gearbox Market Volume (K Unit) Forecast, by Application 2020 & 2033
- Table 13: Rest of North America Wind Power Gearbox Market Revenue (Million) Forecast, by Application 2020 & 2033
- Table 14: Rest of North America Wind Power Gearbox Market Volume (K Unit) Forecast, by Application 2020 & 2033
- Table 15: Global Wind Power Gearbox Market Revenue Million Forecast, by Location of Deployment 2020 & 2033
- Table 16: Global Wind Power Gearbox Market Volume K Unit Forecast, by Location of Deployment 2020 & 2033
- Table 17: Global Wind Power Gearbox Market Revenue Million Forecast, by Country 2020 & 2033
- Table 18: Global Wind Power Gearbox Market Volume K Unit Forecast, by Country 2020 & 2033
- Table 19: China Wind Power Gearbox Market Revenue (Million) Forecast, by Application 2020 & 2033
- Table 20: China Wind Power Gearbox Market Volume (K Unit) Forecast, by Application 2020 & 2033
- Table 21: India Wind Power Gearbox Market Revenue (Million) Forecast, by Application 2020 & 2033
- Table 22: India Wind Power Gearbox Market Volume (K Unit) Forecast, by Application 2020 & 2033
- Table 23: Japan Wind Power Gearbox Market Revenue (Million) Forecast, by Application 2020 & 2033
- Table 24: Japan Wind Power Gearbox Market Volume (K Unit) Forecast, by Application 2020 & 2033
- Table 25: Asutralia Wind Power Gearbox Market Revenue (Million) Forecast, by Application 2020 & 2033
- Table 26: Asutralia Wind Power Gearbox Market Volume (K Unit) Forecast, by Application 2020 & 2033
- Table 27: Rest of Asia Pacific Wind Power Gearbox Market Revenue (Million) Forecast, by Application 2020 & 2033
- Table 28: Rest of Asia Pacific Wind Power Gearbox Market Volume (K Unit) Forecast, by Application 2020 & 2033
- Table 29: Global Wind Power Gearbox Market Revenue Million Forecast, by Location of Deployment 2020 & 2033
- Table 30: Global Wind Power Gearbox Market Volume K Unit Forecast, by Location of Deployment 2020 & 2033
- Table 31: Global Wind Power Gearbox Market Revenue Million Forecast, by Country 2020 & 2033
- Table 32: Global Wind Power Gearbox Market Volume K Unit Forecast, by Country 2020 & 2033
- Table 33: United Kingdom Wind Power Gearbox Market Revenue (Million) Forecast, by Application 2020 & 2033
- Table 34: United Kingdom Wind Power Gearbox Market Volume (K Unit) Forecast, by Application 2020 & 2033
- Table 35: Germany Wind Power Gearbox Market Revenue (Million) Forecast, by Application 2020 & 2033
- Table 36: Germany Wind Power Gearbox Market Volume (K Unit) Forecast, by Application 2020 & 2033
- Table 37: France Wind Power Gearbox Market Revenue (Million) Forecast, by Application 2020 & 2033
- Table 38: France Wind Power Gearbox Market Volume (K Unit) Forecast, by Application 2020 & 2033
- Table 39: Spain Wind Power Gearbox Market Revenue (Million) Forecast, by Application 2020 & 2033
- Table 40: Spain Wind Power Gearbox Market Volume (K Unit) Forecast, by Application 2020 & 2033
- Table 41: Rest of Europe Wind Power Gearbox Market Revenue (Million) Forecast, by Application 2020 & 2033
- Table 42: Rest of Europe Wind Power Gearbox Market Volume (K Unit) Forecast, by Application 2020 & 2033
- Table 43: Global Wind Power Gearbox Market Revenue Million Forecast, by Location of Deployment 2020 & 2033
- Table 44: Global Wind Power Gearbox Market Volume K Unit Forecast, by Location of Deployment 2020 & 2033
- Table 45: Global Wind Power Gearbox Market Revenue Million Forecast, by Country 2020 & 2033
- Table 46: Global Wind Power Gearbox Market Volume K Unit Forecast, by Country 2020 & 2033
- Table 47: Brazil Wind Power Gearbox Market Revenue (Million) Forecast, by Application 2020 & 2033
- Table 48: Brazil Wind Power Gearbox Market Volume (K Unit) Forecast, by Application 2020 & 2033
- Table 49: Argentina Wind Power Gearbox Market Revenue (Million) Forecast, by Application 2020 & 2033
- Table 50: Argentina Wind Power Gearbox Market Volume (K Unit) Forecast, by Application 2020 & 2033
- Table 51: Chile Wind Power Gearbox Market Revenue (Million) Forecast, by Application 2020 & 2033
- Table 52: Chile Wind Power Gearbox Market Volume (K Unit) Forecast, by Application 2020 & 2033
- Table 53: Rest of South America Wind Power Gearbox Market Revenue (Million) Forecast, by Application 2020 & 2033
- Table 54: Rest of South America Wind Power Gearbox Market Volume (K Unit) Forecast, by Application 2020 & 2033
- Table 55: Global Wind Power Gearbox Market Revenue Million Forecast, by Location of Deployment 2020 & 2033
- Table 56: Global Wind Power Gearbox Market Volume K Unit Forecast, by Location of Deployment 2020 & 2033
- Table 57: Global Wind Power Gearbox Market Revenue Million Forecast, by Country 2020 & 2033
- Table 58: Global Wind Power Gearbox Market Volume K Unit Forecast, by Country 2020 & 2033
- Table 59: Saudi Arabia Wind Power Gearbox Market Revenue (Million) Forecast, by Application 2020 & 2033
- Table 60: Saudi Arabia Wind Power Gearbox Market Volume (K Unit) Forecast, by Application 2020 & 2033
- Table 61: United Arab Emirates Wind Power Gearbox Market Revenue (Million) Forecast, by Application 2020 & 2033
- Table 62: United Arab Emirates Wind Power Gearbox Market Volume (K Unit) Forecast, by Application 2020 & 2033
- Table 63: South Africa Wind Power Gearbox Market Revenue (Million) Forecast, by Application 2020 & 2033
- Table 64: South Africa Wind Power Gearbox Market Volume (K Unit) Forecast, by Application 2020 & 2033
- Table 65: Rest of Middle East Wind Power Gearbox Market Revenue (Million) Forecast, by Application 2020 & 2033
- Table 66: Rest of Middle East Wind Power Gearbox Market Volume (K Unit) Forecast, by Application 2020 & 2033
Frequently Asked Questions
1. What is the projected Compound Annual Growth Rate (CAGR) of the Wind Power Gearbox Market?
The projected CAGR is approximately 8.70%.
2. Which companies are prominent players in the Wind Power Gearbox Market?
Key companies in the market include Dana Brevini SpA, Siemens Gamesa Renewable Energy SA, ME Production AS, Stork Gears & Services BV, Winergy Group, Turbine Repair Solutions, Elecon Engineering Company Limited*List Not Exhaustive, ZF Friedrichshafen AG.
3. What are the main segments of the Wind Power Gearbox Market?
The market segments include Location of Deployment.
4. Can you provide details about the market size?
The market size is estimated to be USD 19.92 Million as of 2022.
5. What are some drivers contributing to market growth?
Increasing Adoption of Wind Energy4.; Growing Investments in Wind Energy.
6. What are the notable trends driving market growth?
Offshore Segment to Register Higher Growth.
7. Are there any restraints impacting market growth?
Increasing Penetration of Other Sources of Renewable Energy.
8. Can you provide examples of recent developments in the market?
In September 2023, Sany Renewable Energy (Sany RE) revealed its latest 919 wind turbine platform. The 919 Platform adopts an integrated design, and developments on the 919 Platform share structural components such as the hub, main shaft, front bedplate, blades, gearboxes, and electrical systems are developed as modular systems to cover capacity from 8.5 MW to 11 MW wind turbines with rotor diameters ranging from 214 meters to 230 meters.
9. What pricing options are available for accessing the report?
Pricing options include single-user, multi-user, and enterprise licenses priced at USD 4750, USD 5250, and USD 8750 respectively.
10. Is the market size provided in terms of value or volume?
The market size is provided in terms of value, measured in Million and volume, measured in K Unit.
11. Are there any specific market keywords associated with the report?
Yes, the market keyword associated with the report is "Wind Power Gearbox Market," which aids in identifying and referencing the specific market segment covered.
12. How do I determine which pricing option suits my needs best?
The pricing options vary based on user requirements and access needs. Individual users may opt for single-user licenses, while businesses requiring broader access may choose multi-user or enterprise licenses for cost-effective access to the report.
13. Are there any additional resources or data provided in the Wind Power Gearbox Market report?
While the report offers comprehensive insights, it's advisable to review the specific contents or supplementary materials provided to ascertain if additional resources or data are available.
14. How can I stay updated on further developments or reports in the Wind Power Gearbox Market?
To stay informed about further developments, trends, and reports in the Wind Power Gearbox Market, consider subscribing to industry newsletters, following relevant companies and organizations, or regularly checking reputable industry news sources and publications.
Methodology
Step 1 - Identification of Relevant Samples Size from Population Database


Step 2 - Approaches for Defining Global Market Size (Value, Volume* & Price*)

Note*: In applicable scenarios
Step 3 - Data Sources
Primary Research
- Web Analytics
- Survey Reports
- Research Institute
- Latest Research Reports
- Opinion Leaders
Secondary Research
- Annual Reports
- White Paper
- Latest Press Release
- Industry Association
- Paid Database
- Investor Presentations

Step 4 - Data Triangulation
Involves using different sources of information in order to increase the validity of a study
These sources are likely to be stakeholders in a program - participants, other researchers, program staff, other community members, and so on.
Then we put all data in single framework & apply various statistical tools to find out the dynamic on the market.
During the analysis stage, feedback from the stakeholder groups would be compared to determine areas of agreement as well as areas of divergence