
Key Insights
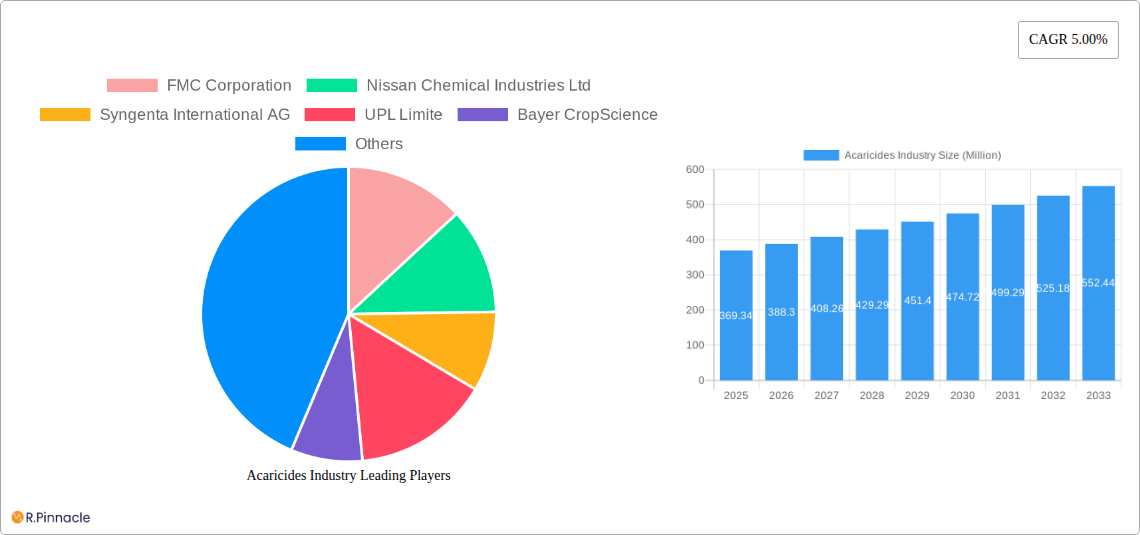
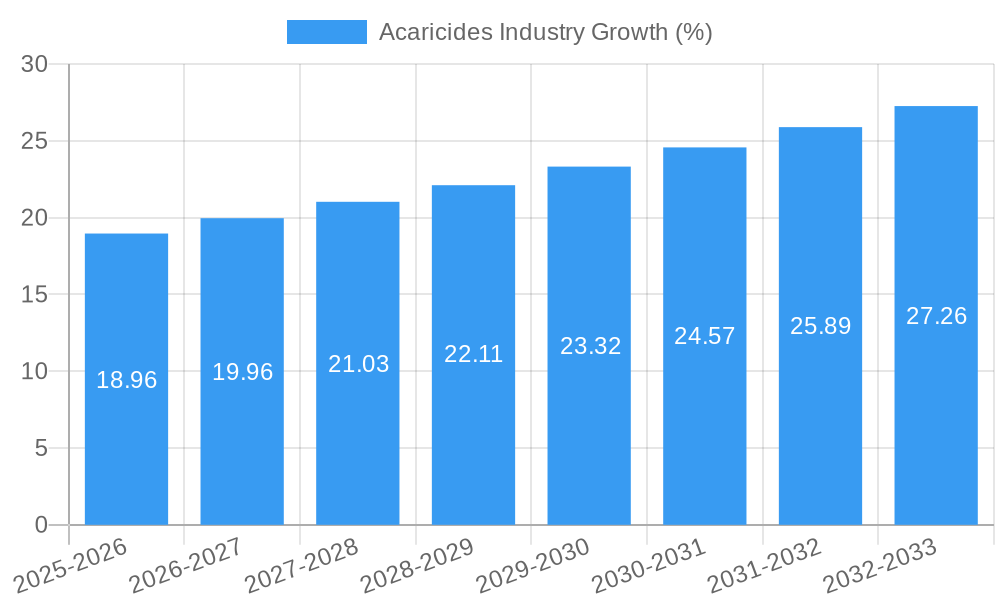
The global acaricide market, valued at $369.34 million in 2025, is projected to experience robust growth, driven by a Compound Annual Growth Rate (CAGR) of 5.00% from 2025 to 2033. This expansion is fueled by several key factors. The increasing prevalence of acaricide-resistant mites and ticks necessitates the development and adoption of new, effective acaricides. Furthermore, the growing global demand for agricultural produce, coupled with intensified farming practices, is leading to a higher incidence of mite and tick infestations, thereby boosting acaricide demand. Intensified research and development efforts focusing on novel chemical formulations and biological control methods are further contributing to market growth. However, stringent regulations surrounding pesticide use and growing concerns regarding the environmental impact of certain acaricides pose significant restraints on market expansion. The market is segmented by chemical type (Organophosphates, Carbamates, Organochlorines, Pyrethrins, Pyrethroids, and Others) and application (Spray, Dipping, Hand Dressing, and Others). Organophosphates and pyrethroids currently dominate the chemical type segment due to their efficacy and established usage. Spray application holds the largest market share among application methods due to its widespread applicability across various agricultural settings. Key players like FMC Corporation, Syngenta, Bayer CropScience, and BASF are driving innovation and market competition through strategic partnerships, mergers, and acquisitions, as well as the introduction of novel acaricide products. Regional analysis reveals strong growth in the Asia-Pacific region driven by the expansion of agricultural activities and rising demand in countries like India and China. North America and Europe, while having established markets, are also expected to witness steady growth, albeit at a slightly slower pace compared to the Asia-Pacific region.
The acaricide market is expected to see a shift towards more environmentally friendly and sustainable options in the coming years. This trend is driven by increasing consumer awareness and stricter regulatory policies. Biopesticides and integrated pest management (IPM) strategies are gaining traction as alternatives to traditional chemical acaricides. However, the efficacy and cost-effectiveness of these alternatives remain crucial factors impacting their widespread adoption. Future market growth will largely depend on the successful development and commercialization of novel, environmentally sound acaricides that address the challenges posed by acaricide resistance and stringent regulatory frameworks. Continuous innovation in formulation technologies and targeted delivery systems will further contribute to market expansion. The competitive landscape is expected to remain dynamic, with ongoing consolidation and strategic alliances among key players shaping the future trajectory of the acaricide market.
Acaricides Industry Market Report: 2019-2033
This comprehensive report provides an in-depth analysis of the global acaricide industry, offering valuable insights for industry professionals, investors, and stakeholders. Covering the period 2019-2033, with a focus on 2025, this report unveils market trends, growth drivers, challenges, and future opportunities. The study incorporates detailed segmentations by chemical type and application, alongside competitive landscape analysis, including key players like FMC Corporation, Nissan Chemical Industries Ltd, Syngenta International AG, UPL Limited, Bayer CropScience, Corteva Agriscience, and BASF SE. The global market size is projected to reach xx Million by 2033.
Acaricides Industry Market Structure & Innovation Trends
The acaricide market exhibits a moderately concentrated structure, with a few multinational corporations holding significant market share. FMC Corporation, Syngenta International AG, and Bayer CropScience collectively account for approximately xx% of the global market in 2025. Innovation is driven by the need for more effective, environmentally friendly, and cost-effective acaricides to combat evolving pest resistance. Stringent regulatory frameworks, particularly concerning the use of organochlorines, are shaping product development. The market also witnesses ongoing M&A activities, with deal values exceeding xx Million in the past five years. These activities often involve smaller companies being acquired by larger players seeking to expand their product portfolios and geographical reach. Substitutes, such as biological control agents, are gaining traction, but chemical acaricides remain the dominant solution due to their efficacy and cost-effectiveness. End-user demographics are predominantly agricultural businesses and professional pest control services.
- Market Share (2025): FMC Corporation (xx%), Syngenta International AG (xx%), Bayer CropScience (xx%), Others (xx%)
- M&A Deal Value (2019-2024): Over xx Million
Acaricides Industry Market Dynamics & Trends
The acaricide market is experiencing steady growth, driven by the increasing prevalence of mite infestations in agriculture and horticulture. The CAGR during the forecast period (2025-2033) is estimated at xx%. Technological disruptions, particularly in formulation and delivery systems, are improving efficacy and reducing environmental impact. Consumer preferences are shifting towards safer and more sustainable acaricides, pushing companies to develop bio-pesticides and other environmentally friendly alternatives. The competitive landscape is characterized by intense rivalry, with companies focusing on product differentiation, innovation, and strategic partnerships to maintain market share. Market penetration in developing economies remains relatively low, presenting significant growth potential.
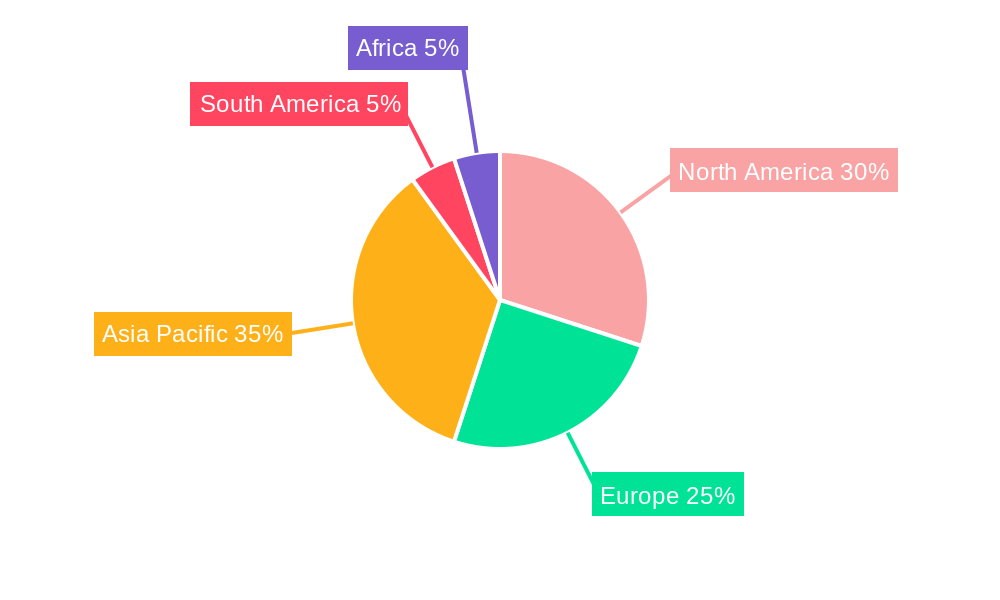
Dominant Regions & Segments in Acaricides Industry
The Asia-Pacific region dominates the acaricide market, driven by the rapid growth of agriculture and horticulture in countries like China and India. Key drivers include favorable government policies supporting agricultural development and expanding infrastructure for efficient pesticide application.
Dominant Segments:
- Chemical Type: Pyrethroids currently hold the largest market share, owing to their broad-spectrum efficacy and relatively lower toxicity.
- Application: Spray application dominates the market due to its widespread usage and convenience.
Key Regional Drivers:
- Asia-Pacific: Rapid agricultural expansion, supportive government policies, and increasing awareness of pest control.
- North America: High adoption of advanced agricultural practices and stringent regulations driving demand for advanced acaricides.
- Europe: Stringent environmental regulations promoting the adoption of more sustainable acaricide solutions.
Acaricides Industry Product Innovations
Recent product innovations focus on enhanced efficacy, reduced environmental impact, and improved safety profiles. Formulations like microencapsulated acaricides are gaining popularity due to their controlled release and reduced environmental risk. The development of biological acaricides is another major trend, offering a sustainable alternative to chemical pesticides. These innovations are enhancing the market fit by addressing consumer demand for environmentally friendly and effective pest control solutions.
Report Scope & Segmentation Analysis
This report segments the acaricide market based on chemical type (Organophosphates, Carbamates, Organochlorines, Pyrethrins, Pyrethroids, Other Chemical Types) and application (Spray, Dipping, Hand Dressing, Other Applications). Each segment's growth projections, market size, and competitive dynamics are analyzed, providing a granular understanding of the industry structure. Growth rates vary considerably between segments, with Pyrethroids and spray application expected to see the highest growth over the forecast period.
Key Drivers of Acaricides Industry Growth
Several factors fuel the acaricide market's expansion. The rising incidence of mite infestations across various agricultural crops is a significant driver. Technological advancements leading to more effective and eco-friendly formulations also contribute to market growth. Favorable government policies supporting agricultural development in many regions further boost demand. Finally, increasing awareness of pest management and its importance in ensuring food security is a key growth driver.
Challenges in the Acaricides Industry Sector
The acaricide industry faces several challenges. Stringent environmental regulations restrict the use of certain chemical types, impacting product availability and pricing. The development of pest resistance poses a major threat to the efficacy of existing acaricides, necessitating continuous research and development. Supply chain disruptions and fluctuating raw material prices also contribute to industry volatility.
Emerging Opportunities in Acaricides Industry
Emerging opportunities lie in the growing adoption of integrated pest management (IPM) strategies and the development of novel acaricide formulations. The demand for bio-pesticides and other environmentally friendly solutions presents significant opportunities. Expanding into new markets in developing economies, particularly in Africa and Latin America, offers considerable growth potential.
Leading Players in the Acaricides Industry Market
- FMC Corporation
- Nissan Chemical Industries Ltd
- Syngenta International AG
- UPL Limited
- Bayer CropScience
- Corteva Agriscience
- BASF SE
Key Developments in Acaricides Industry Industry
- 2022 Q4: FMC Corporation launched a new acaricide formulation with enhanced efficacy against key mite species.
- 2023 Q1: Syngenta International AG announced a strategic partnership to develop bio-pesticides.
- 2024 Q2: Bayer CropScience acquired a smaller acaricide producer to expand its product portfolio. (Further details on specific dates and impacts would be included in the full report)
Future Outlook for Acaricides Industry Market
The acaricide market is poised for continued growth, driven by factors such as increasing agricultural production, the growing threat of mite infestations, and the development of innovative and sustainable products. Strategic investments in research and development, coupled with strategic partnerships and acquisitions, will shape the competitive landscape. The focus on developing eco-friendly and effective solutions will be critical for future market success.
Acaricides Industry Segmentation
- 1. Production Analysis
- 2. Consumption Analysis
- 3. Import Market Analysis (Value & Volume)
- 4. Export Market Analysis (Value & Volume)
- 5. Price Trend Analysis
Acaricides Industry Segmentation By Geography
-
1. North America
- 1.1. United States
- 1.2. Canada
- 1.3. Mexico
-
2. South America
- 2.1. Brazil
- 2.2. Argentina
- 2.3. Rest of South America
-
3. Europe
- 3.1. United Kingdom
- 3.2. Germany
- 3.3. France
- 3.4. Italy
- 3.5. Spain
- 3.6. Russia
- 3.7. Benelux
- 3.8. Nordics
- 3.9. Rest of Europe
-
4. Middle East & Africa
- 4.1. Turkey
- 4.2. Israel
- 4.3. GCC
- 4.4. North Africa
- 4.5. South Africa
- 4.6. Rest of Middle East & Africa
-
5. Asia Pacific
- 5.1. China
- 5.2. India
- 5.3. Japan
- 5.4. South Korea
- 5.5. ASEAN
- 5.6. Oceania
- 5.7. Rest of Asia Pacific
Acaricides Industry REPORT HIGHLIGHTS
| Aspects | Details |
|---|---|
| Study Period | 2019-2033 |
| Base Year | 2024 |
| Estimated Year | 2025 |
| Forecast Period | 2025-2033 |
| Historical Period | 2019-2024 |
| Growth Rate | CAGR of 5.00% from 2019-2033 |
| Segmentation |
|
Table of Contents
- 1. Introduction
- 1.1. Research Scope
- 1.2. Market Segmentation
- 1.3. Research Methodology
- 1.4. Definitions and Assumptions
- 2. Executive Summary
- 2.1. Introduction
- 3. Market Dynamics
- 3.1. Introduction
- 3.2. Market Drivers
- 3.2.1. Shortage of Skilled Labor; Government Support to Enhance Farm Mechanization
- 3.3. Market Restrains
- 3.3.1. Heavy Initial Procurement Cost and High Expenditure on Maintenance
- 3.4. Market Trends
- 3.4.1. Increasing Demand for Natural Products
- 4. Market Factor Analysis
- 4.1. Porters Five Forces
- 4.2. Supply/Value Chain
- 4.3. PESTEL analysis
- 4.4. Market Entropy
- 4.5. Patent/Trademark Analysis
- 5. Global Acaricides Industry Analysis, Insights and Forecast, 2019-2031
- 5.1. Market Analysis, Insights and Forecast - by Production Analysis
- 5.2. Market Analysis, Insights and Forecast - by Consumption Analysis
- 5.3. Market Analysis, Insights and Forecast - by Import Market Analysis (Value & Volume)
- 5.4. Market Analysis, Insights and Forecast - by Export Market Analysis (Value & Volume)
- 5.5. Market Analysis, Insights and Forecast - by Price Trend Analysis
- 5.6. Market Analysis, Insights and Forecast - by Region
- 5.6.1. North America
- 5.6.2. South America
- 5.6.3. Europe
- 5.6.4. Middle East & Africa
- 5.6.5. Asia Pacific
- 5.1. Market Analysis, Insights and Forecast - by Production Analysis
- 6. North America Acaricides Industry Analysis, Insights and Forecast, 2019-2031
- 6.1. Market Analysis, Insights and Forecast - by Production Analysis
- 6.2. Market Analysis, Insights and Forecast - by Consumption Analysis
- 6.3. Market Analysis, Insights and Forecast - by Import Market Analysis (Value & Volume)
- 6.4. Market Analysis, Insights and Forecast - by Export Market Analysis (Value & Volume)
- 6.5. Market Analysis, Insights and Forecast - by Price Trend Analysis
- 6.1. Market Analysis, Insights and Forecast - by Production Analysis
- 7. South America Acaricides Industry Analysis, Insights and Forecast, 2019-2031
- 7.1. Market Analysis, Insights and Forecast - by Production Analysis
- 7.2. Market Analysis, Insights and Forecast - by Consumption Analysis
- 7.3. Market Analysis, Insights and Forecast - by Import Market Analysis (Value & Volume)
- 7.4. Market Analysis, Insights and Forecast - by Export Market Analysis (Value & Volume)
- 7.5. Market Analysis, Insights and Forecast - by Price Trend Analysis
- 7.1. Market Analysis, Insights and Forecast - by Production Analysis
- 8. Europe Acaricides Industry Analysis, Insights and Forecast, 2019-2031
- 8.1. Market Analysis, Insights and Forecast - by Production Analysis
- 8.2. Market Analysis, Insights and Forecast - by Consumption Analysis
- 8.3. Market Analysis, Insights and Forecast - by Import Market Analysis (Value & Volume)
- 8.4. Market Analysis, Insights and Forecast - by Export Market Analysis (Value & Volume)
- 8.5. Market Analysis, Insights and Forecast - by Price Trend Analysis
- 8.1. Market Analysis, Insights and Forecast - by Production Analysis
- 9. Middle East & Africa Acaricides Industry Analysis, Insights and Forecast, 2019-2031
- 9.1. Market Analysis, Insights and Forecast - by Production Analysis
- 9.2. Market Analysis, Insights and Forecast - by Consumption Analysis
- 9.3. Market Analysis, Insights and Forecast - by Import Market Analysis (Value & Volume)
- 9.4. Market Analysis, Insights and Forecast - by Export Market Analysis (Value & Volume)
- 9.5. Market Analysis, Insights and Forecast - by Price Trend Analysis
- 9.1. Market Analysis, Insights and Forecast - by Production Analysis
- 10. Asia Pacific Acaricides Industry Analysis, Insights and Forecast, 2019-2031
- 10.1. Market Analysis, Insights and Forecast - by Production Analysis
- 10.2. Market Analysis, Insights and Forecast - by Consumption Analysis
- 10.3. Market Analysis, Insights and Forecast - by Import Market Analysis (Value & Volume)
- 10.4. Market Analysis, Insights and Forecast - by Export Market Analysis (Value & Volume)
- 10.5. Market Analysis, Insights and Forecast - by Price Trend Analysis
- 10.1. Market Analysis, Insights and Forecast - by Production Analysis
- 11. North America Acaricides Industry Analysis, Insights and Forecast, 2019-2031
- 11.1. Market Analysis, Insights and Forecast - By Country/Sub-region
- 11.1.1 United States
- 11.1.2 Canada
- 11.1.3 Mexico
- 11.1.4 Rest of North America
- 12. Europe Acaricides Industry Analysis, Insights and Forecast, 2019-2031
- 12.1. Market Analysis, Insights and Forecast - By Country/Sub-region
- 12.1.1 Germany
- 12.1.2 United Kingdom
- 12.1.3 Spain
- 12.1.4 France
- 12.1.5 Italy
- 12.1.6 Russia
- 12.1.7 Rest of Europe
- 13. Asia Pacific Acaricides Industry Analysis, Insights and Forecast, 2019-2031
- 13.1. Market Analysis, Insights and Forecast - By Country/Sub-region
- 13.1.1 China
- 13.1.2 India
- 13.1.3 Japan
- 13.1.4 Australia
- 13.1.5 Rest of Asia Pacific
- 14. South America Acaricides Industry Analysis, Insights and Forecast, 2019-2031
- 14.1. Market Analysis, Insights and Forecast - By Country/Sub-region
- 14.1.1 Brazil
- 14.1.2 Argentina
- 14.1.3 Rest of South America
- 15. Africa Acaricides Industry Analysis, Insights and Forecast, 2019-2031
- 15.1. Market Analysis, Insights and Forecast - By Country/Sub-region
- 15.1.1 South Africa
- 15.1.2 Rest of Africa
- 16. Competitive Analysis
- 16.1. Global Market Share Analysis 2024
- 16.2. Company Profiles
- 16.2.1 FMC Corporation
- 16.2.1.1. Overview
- 16.2.1.2. Products
- 16.2.1.3. SWOT Analysis
- 16.2.1.4. Recent Developments
- 16.2.1.5. Financials (Based on Availability)
- 16.2.2 Nissan Chemical Industries Ltd
- 16.2.2.1. Overview
- 16.2.2.2. Products
- 16.2.2.3. SWOT Analysis
- 16.2.2.4. Recent Developments
- 16.2.2.5. Financials (Based on Availability)
- 16.2.3 Syngenta International AG
- 16.2.3.1. Overview
- 16.2.3.2. Products
- 16.2.3.3. SWOT Analysis
- 16.2.3.4. Recent Developments
- 16.2.3.5. Financials (Based on Availability)
- 16.2.4 UPL Limite
- 16.2.4.1. Overview
- 16.2.4.2. Products
- 16.2.4.3. SWOT Analysis
- 16.2.4.4. Recent Developments
- 16.2.4.5. Financials (Based on Availability)
- 16.2.5 Bayer CropScience
- 16.2.5.1. Overview
- 16.2.5.2. Products
- 16.2.5.3. SWOT Analysis
- 16.2.5.4. Recent Developments
- 16.2.5.5. Financials (Based on Availability)
- 16.2.6 Corteva Agriscience
- 16.2.6.1. Overview
- 16.2.6.2. Products
- 16.2.6.3. SWOT Analysis
- 16.2.6.4. Recent Developments
- 16.2.6.5. Financials (Based on Availability)
- 16.2.7 BASF SE
- 16.2.7.1. Overview
- 16.2.7.2. Products
- 16.2.7.3. SWOT Analysis
- 16.2.7.4. Recent Developments
- 16.2.7.5. Financials (Based on Availability)
- 16.2.1 FMC Corporation
List of Figures
- Figure 1: Global Acaricides Industry Revenue Breakdown (Million, %) by Region 2024 & 2032
- Figure 2: North America Acaricides Industry Revenue (Million), by Country 2024 & 2032
- Figure 3: North America Acaricides Industry Revenue Share (%), by Country 2024 & 2032
- Figure 4: Europe Acaricides Industry Revenue (Million), by Country 2024 & 2032
- Figure 5: Europe Acaricides Industry Revenue Share (%), by Country 2024 & 2032
- Figure 6: Asia Pacific Acaricides Industry Revenue (Million), by Country 2024 & 2032
- Figure 7: Asia Pacific Acaricides Industry Revenue Share (%), by Country 2024 & 2032
- Figure 8: South America Acaricides Industry Revenue (Million), by Country 2024 & 2032
- Figure 9: South America Acaricides Industry Revenue Share (%), by Country 2024 & 2032
- Figure 10: Africa Acaricides Industry Revenue (Million), by Country 2024 & 2032
- Figure 11: Africa Acaricides Industry Revenue Share (%), by Country 2024 & 2032
- Figure 12: North America Acaricides Industry Revenue (Million), by Production Analysis 2024 & 2032
- Figure 13: North America Acaricides Industry Revenue Share (%), by Production Analysis 2024 & 2032
- Figure 14: North America Acaricides Industry Revenue (Million), by Consumption Analysis 2024 & 2032
- Figure 15: North America Acaricides Industry Revenue Share (%), by Consumption Analysis 2024 & 2032
- Figure 16: North America Acaricides Industry Revenue (Million), by Import Market Analysis (Value & Volume) 2024 & 2032
- Figure 17: North America Acaricides Industry Revenue Share (%), by Import Market Analysis (Value & Volume) 2024 & 2032
- Figure 18: North America Acaricides Industry Revenue (Million), by Export Market Analysis (Value & Volume) 2024 & 2032
- Figure 19: North America Acaricides Industry Revenue Share (%), by Export Market Analysis (Value & Volume) 2024 & 2032
- Figure 20: North America Acaricides Industry Revenue (Million), by Price Trend Analysis 2024 & 2032
- Figure 21: North America Acaricides Industry Revenue Share (%), by Price Trend Analysis 2024 & 2032
- Figure 22: North America Acaricides Industry Revenue (Million), by Country 2024 & 2032
- Figure 23: North America Acaricides Industry Revenue Share (%), by Country 2024 & 2032
- Figure 24: South America Acaricides Industry Revenue (Million), by Production Analysis 2024 & 2032
- Figure 25: South America Acaricides Industry Revenue Share (%), by Production Analysis 2024 & 2032
- Figure 26: South America Acaricides Industry Revenue (Million), by Consumption Analysis 2024 & 2032
- Figure 27: South America Acaricides Industry Revenue Share (%), by Consumption Analysis 2024 & 2032
- Figure 28: South America Acaricides Industry Revenue (Million), by Import Market Analysis (Value & Volume) 2024 & 2032
- Figure 29: South America Acaricides Industry Revenue Share (%), by Import Market Analysis (Value & Volume) 2024 & 2032
- Figure 30: South America Acaricides Industry Revenue (Million), by Export Market Analysis (Value & Volume) 2024 & 2032
- Figure 31: South America Acaricides Industry Revenue Share (%), by Export Market Analysis (Value & Volume) 2024 & 2032
- Figure 32: South America Acaricides Industry Revenue (Million), by Price Trend Analysis 2024 & 2032
- Figure 33: South America Acaricides Industry Revenue Share (%), by Price Trend Analysis 2024 & 2032
- Figure 34: South America Acaricides Industry Revenue (Million), by Country 2024 & 2032
- Figure 35: South America Acaricides Industry Revenue Share (%), by Country 2024 & 2032
- Figure 36: Europe Acaricides Industry Revenue (Million), by Production Analysis 2024 & 2032
- Figure 37: Europe Acaricides Industry Revenue Share (%), by Production Analysis 2024 & 2032
- Figure 38: Europe Acaricides Industry Revenue (Million), by Consumption Analysis 2024 & 2032
- Figure 39: Europe Acaricides Industry Revenue Share (%), by Consumption Analysis 2024 & 2032
- Figure 40: Europe Acaricides Industry Revenue (Million), by Import Market Analysis (Value & Volume) 2024 & 2032
- Figure 41: Europe Acaricides Industry Revenue Share (%), by Import Market Analysis (Value & Volume) 2024 & 2032
- Figure 42: Europe Acaricides Industry Revenue (Million), by Export Market Analysis (Value & Volume) 2024 & 2032
- Figure 43: Europe Acaricides Industry Revenue Share (%), by Export Market Analysis (Value & Volume) 2024 & 2032
- Figure 44: Europe Acaricides Industry Revenue (Million), by Price Trend Analysis 2024 & 2032
- Figure 45: Europe Acaricides Industry Revenue Share (%), by Price Trend Analysis 2024 & 2032
- Figure 46: Europe Acaricides Industry Revenue (Million), by Country 2024 & 2032
- Figure 47: Europe Acaricides Industry Revenue Share (%), by Country 2024 & 2032
- Figure 48: Middle East & Africa Acaricides Industry Revenue (Million), by Production Analysis 2024 & 2032
- Figure 49: Middle East & Africa Acaricides Industry Revenue Share (%), by Production Analysis 2024 & 2032
- Figure 50: Middle East & Africa Acaricides Industry Revenue (Million), by Consumption Analysis 2024 & 2032
- Figure 51: Middle East & Africa Acaricides Industry Revenue Share (%), by Consumption Analysis 2024 & 2032
- Figure 52: Middle East & Africa Acaricides Industry Revenue (Million), by Import Market Analysis (Value & Volume) 2024 & 2032
- Figure 53: Middle East & Africa Acaricides Industry Revenue Share (%), by Import Market Analysis (Value & Volume) 2024 & 2032
- Figure 54: Middle East & Africa Acaricides Industry Revenue (Million), by Export Market Analysis (Value & Volume) 2024 & 2032
- Figure 55: Middle East & Africa Acaricides Industry Revenue Share (%), by Export Market Analysis (Value & Volume) 2024 & 2032
- Figure 56: Middle East & Africa Acaricides Industry Revenue (Million), by Price Trend Analysis 2024 & 2032
- Figure 57: Middle East & Africa Acaricides Industry Revenue Share (%), by Price Trend Analysis 2024 & 2032
- Figure 58: Middle East & Africa Acaricides Industry Revenue (Million), by Country 2024 & 2032
- Figure 59: Middle East & Africa Acaricides Industry Revenue Share (%), by Country 2024 & 2032
- Figure 60: Asia Pacific Acaricides Industry Revenue (Million), by Production Analysis 2024 & 2032
- Figure 61: Asia Pacific Acaricides Industry Revenue Share (%), by Production Analysis 2024 & 2032
- Figure 62: Asia Pacific Acaricides Industry Revenue (Million), by Consumption Analysis 2024 & 2032
- Figure 63: Asia Pacific Acaricides Industry Revenue Share (%), by Consumption Analysis 2024 & 2032
- Figure 64: Asia Pacific Acaricides Industry Revenue (Million), by Import Market Analysis (Value & Volume) 2024 & 2032
- Figure 65: Asia Pacific Acaricides Industry Revenue Share (%), by Import Market Analysis (Value & Volume) 2024 & 2032
- Figure 66: Asia Pacific Acaricides Industry Revenue (Million), by Export Market Analysis (Value & Volume) 2024 & 2032
- Figure 67: Asia Pacific Acaricides Industry Revenue Share (%), by Export Market Analysis (Value & Volume) 2024 & 2032
- Figure 68: Asia Pacific Acaricides Industry Revenue (Million), by Price Trend Analysis 2024 & 2032
- Figure 69: Asia Pacific Acaricides Industry Revenue Share (%), by Price Trend Analysis 2024 & 2032
- Figure 70: Asia Pacific Acaricides Industry Revenue (Million), by Country 2024 & 2032
- Figure 71: Asia Pacific Acaricides Industry Revenue Share (%), by Country 2024 & 2032
List of Tables
- Table 1: Global Acaricides Industry Revenue Million Forecast, by Region 2019 & 2032
- Table 2: Global Acaricides Industry Revenue Million Forecast, by Production Analysis 2019 & 2032
- Table 3: Global Acaricides Industry Revenue Million Forecast, by Consumption Analysis 2019 & 2032
- Table 4: Global Acaricides Industry Revenue Million Forecast, by Import Market Analysis (Value & Volume) 2019 & 2032
- Table 5: Global Acaricides Industry Revenue Million Forecast, by Export Market Analysis (Value & Volume) 2019 & 2032
- Table 6: Global Acaricides Industry Revenue Million Forecast, by Price Trend Analysis 2019 & 2032
- Table 7: Global Acaricides Industry Revenue Million Forecast, by Region 2019 & 2032
- Table 8: Global Acaricides Industry Revenue Million Forecast, by Country 2019 & 2032
- Table 9: United States Acaricides Industry Revenue (Million) Forecast, by Application 2019 & 2032
- Table 10: Canada Acaricides Industry Revenue (Million) Forecast, by Application 2019 & 2032
- Table 11: Mexico Acaricides Industry Revenue (Million) Forecast, by Application 2019 & 2032
- Table 12: Rest of North America Acaricides Industry Revenue (Million) Forecast, by Application 2019 & 2032
- Table 13: Global Acaricides Industry Revenue Million Forecast, by Country 2019 & 2032
- Table 14: Germany Acaricides Industry Revenue (Million) Forecast, by Application 2019 & 2032
- Table 15: United Kingdom Acaricides Industry Revenue (Million) Forecast, by Application 2019 & 2032
- Table 16: Spain Acaricides Industry Revenue (Million) Forecast, by Application 2019 & 2032
- Table 17: France Acaricides Industry Revenue (Million) Forecast, by Application 2019 & 2032
- Table 18: Italy Acaricides Industry Revenue (Million) Forecast, by Application 2019 & 2032
- Table 19: Russia Acaricides Industry Revenue (Million) Forecast, by Application 2019 & 2032
- Table 20: Rest of Europe Acaricides Industry Revenue (Million) Forecast, by Application 2019 & 2032
- Table 21: Global Acaricides Industry Revenue Million Forecast, by Country 2019 & 2032
- Table 22: China Acaricides Industry Revenue (Million) Forecast, by Application 2019 & 2032
- Table 23: India Acaricides Industry Revenue (Million) Forecast, by Application 2019 & 2032
- Table 24: Japan Acaricides Industry Revenue (Million) Forecast, by Application 2019 & 2032
- Table 25: Australia Acaricides Industry Revenue (Million) Forecast, by Application 2019 & 2032
- Table 26: Rest of Asia Pacific Acaricides Industry Revenue (Million) Forecast, by Application 2019 & 2032
- Table 27: Global Acaricides Industry Revenue Million Forecast, by Country 2019 & 2032
- Table 28: Brazil Acaricides Industry Revenue (Million) Forecast, by Application 2019 & 2032
- Table 29: Argentina Acaricides Industry Revenue (Million) Forecast, by Application 2019 & 2032
- Table 30: Rest of South America Acaricides Industry Revenue (Million) Forecast, by Application 2019 & 2032
- Table 31: Global Acaricides Industry Revenue Million Forecast, by Country 2019 & 2032
- Table 32: South Africa Acaricides Industry Revenue (Million) Forecast, by Application 2019 & 2032
- Table 33: Rest of Africa Acaricides Industry Revenue (Million) Forecast, by Application 2019 & 2032
- Table 34: Global Acaricides Industry Revenue Million Forecast, by Production Analysis 2019 & 2032
- Table 35: Global Acaricides Industry Revenue Million Forecast, by Consumption Analysis 2019 & 2032
- Table 36: Global Acaricides Industry Revenue Million Forecast, by Import Market Analysis (Value & Volume) 2019 & 2032
- Table 37: Global Acaricides Industry Revenue Million Forecast, by Export Market Analysis (Value & Volume) 2019 & 2032
- Table 38: Global Acaricides Industry Revenue Million Forecast, by Price Trend Analysis 2019 & 2032
- Table 39: Global Acaricides Industry Revenue Million Forecast, by Country 2019 & 2032
- Table 40: United States Acaricides Industry Revenue (Million) Forecast, by Application 2019 & 2032
- Table 41: Canada Acaricides Industry Revenue (Million) Forecast, by Application 2019 & 2032
- Table 42: Mexico Acaricides Industry Revenue (Million) Forecast, by Application 2019 & 2032
- Table 43: Global Acaricides Industry Revenue Million Forecast, by Production Analysis 2019 & 2032
- Table 44: Global Acaricides Industry Revenue Million Forecast, by Consumption Analysis 2019 & 2032
- Table 45: Global Acaricides Industry Revenue Million Forecast, by Import Market Analysis (Value & Volume) 2019 & 2032
- Table 46: Global Acaricides Industry Revenue Million Forecast, by Export Market Analysis (Value & Volume) 2019 & 2032
- Table 47: Global Acaricides Industry Revenue Million Forecast, by Price Trend Analysis 2019 & 2032
- Table 48: Global Acaricides Industry Revenue Million Forecast, by Country 2019 & 2032
- Table 49: Brazil Acaricides Industry Revenue (Million) Forecast, by Application 2019 & 2032
- Table 50: Argentina Acaricides Industry Revenue (Million) Forecast, by Application 2019 & 2032
- Table 51: Rest of South America Acaricides Industry Revenue (Million) Forecast, by Application 2019 & 2032
- Table 52: Global Acaricides Industry Revenue Million Forecast, by Production Analysis 2019 & 2032
- Table 53: Global Acaricides Industry Revenue Million Forecast, by Consumption Analysis 2019 & 2032
- Table 54: Global Acaricides Industry Revenue Million Forecast, by Import Market Analysis (Value & Volume) 2019 & 2032
- Table 55: Global Acaricides Industry Revenue Million Forecast, by Export Market Analysis (Value & Volume) 2019 & 2032
- Table 56: Global Acaricides Industry Revenue Million Forecast, by Price Trend Analysis 2019 & 2032
- Table 57: Global Acaricides Industry Revenue Million Forecast, by Country 2019 & 2032
- Table 58: United Kingdom Acaricides Industry Revenue (Million) Forecast, by Application 2019 & 2032
- Table 59: Germany Acaricides Industry Revenue (Million) Forecast, by Application 2019 & 2032
- Table 60: France Acaricides Industry Revenue (Million) Forecast, by Application 2019 & 2032
- Table 61: Italy Acaricides Industry Revenue (Million) Forecast, by Application 2019 & 2032
- Table 62: Spain Acaricides Industry Revenue (Million) Forecast, by Application 2019 & 2032
- Table 63: Russia Acaricides Industry Revenue (Million) Forecast, by Application 2019 & 2032
- Table 64: Benelux Acaricides Industry Revenue (Million) Forecast, by Application 2019 & 2032
- Table 65: Nordics Acaricides Industry Revenue (Million) Forecast, by Application 2019 & 2032
- Table 66: Rest of Europe Acaricides Industry Revenue (Million) Forecast, by Application 2019 & 2032
- Table 67: Global Acaricides Industry Revenue Million Forecast, by Production Analysis 2019 & 2032
- Table 68: Global Acaricides Industry Revenue Million Forecast, by Consumption Analysis 2019 & 2032
- Table 69: Global Acaricides Industry Revenue Million Forecast, by Import Market Analysis (Value & Volume) 2019 & 2032
- Table 70: Global Acaricides Industry Revenue Million Forecast, by Export Market Analysis (Value & Volume) 2019 & 2032
- Table 71: Global Acaricides Industry Revenue Million Forecast, by Price Trend Analysis 2019 & 2032
- Table 72: Global Acaricides Industry Revenue Million Forecast, by Country 2019 & 2032
- Table 73: Turkey Acaricides Industry Revenue (Million) Forecast, by Application 2019 & 2032
- Table 74: Israel Acaricides Industry Revenue (Million) Forecast, by Application 2019 & 2032
- Table 75: GCC Acaricides Industry Revenue (Million) Forecast, by Application 2019 & 2032
- Table 76: North Africa Acaricides Industry Revenue (Million) Forecast, by Application 2019 & 2032
- Table 77: South Africa Acaricides Industry Revenue (Million) Forecast, by Application 2019 & 2032
- Table 78: Rest of Middle East & Africa Acaricides Industry Revenue (Million) Forecast, by Application 2019 & 2032
- Table 79: Global Acaricides Industry Revenue Million Forecast, by Production Analysis 2019 & 2032
- Table 80: Global Acaricides Industry Revenue Million Forecast, by Consumption Analysis 2019 & 2032
- Table 81: Global Acaricides Industry Revenue Million Forecast, by Import Market Analysis (Value & Volume) 2019 & 2032
- Table 82: Global Acaricides Industry Revenue Million Forecast, by Export Market Analysis (Value & Volume) 2019 & 2032
- Table 83: Global Acaricides Industry Revenue Million Forecast, by Price Trend Analysis 2019 & 2032
- Table 84: Global Acaricides Industry Revenue Million Forecast, by Country 2019 & 2032
- Table 85: China Acaricides Industry Revenue (Million) Forecast, by Application 2019 & 2032
- Table 86: India Acaricides Industry Revenue (Million) Forecast, by Application 2019 & 2032
- Table 87: Japan Acaricides Industry Revenue (Million) Forecast, by Application 2019 & 2032
- Table 88: South Korea Acaricides Industry Revenue (Million) Forecast, by Application 2019 & 2032
- Table 89: ASEAN Acaricides Industry Revenue (Million) Forecast, by Application 2019 & 2032
- Table 90: Oceania Acaricides Industry Revenue (Million) Forecast, by Application 2019 & 2032
- Table 91: Rest of Asia Pacific Acaricides Industry Revenue (Million) Forecast, by Application 2019 & 2032
Frequently Asked Questions
1. What is the projected Compound Annual Growth Rate (CAGR) of the Acaricides Industry?
The projected CAGR is approximately 5.00%.
2. Which companies are prominent players in the Acaricides Industry?
Key companies in the market include FMC Corporation, Nissan Chemical Industries Ltd, Syngenta International AG, UPL Limite, Bayer CropScience, Corteva Agriscience, BASF SE.
3. What are the main segments of the Acaricides Industry?
The market segments include Production Analysis, Consumption Analysis, Import Market Analysis (Value & Volume), Export Market Analysis (Value & Volume), Price Trend Analysis.
4. Can you provide details about the market size?
The market size is estimated to be USD 369.34 Million as of 2022.
5. What are some drivers contributing to market growth?
Shortage of Skilled Labor; Government Support to Enhance Farm Mechanization.
6. What are the notable trends driving market growth?
Increasing Demand for Natural Products.
7. Are there any restraints impacting market growth?
Heavy Initial Procurement Cost and High Expenditure on Maintenance.
8. Can you provide examples of recent developments in the market?
N/A
9. What pricing options are available for accessing the report?
Pricing options include single-user, multi-user, and enterprise licenses priced at USD 4750, USD 5250, and USD 8750 respectively.
10. Is the market size provided in terms of value or volume?
The market size is provided in terms of value, measured in Million.
11. Are there any specific market keywords associated with the report?
Yes, the market keyword associated with the report is "Acaricides Industry," which aids in identifying and referencing the specific market segment covered.
12. How do I determine which pricing option suits my needs best?
The pricing options vary based on user requirements and access needs. Individual users may opt for single-user licenses, while businesses requiring broader access may choose multi-user or enterprise licenses for cost-effective access to the report.
13. Are there any additional resources or data provided in the Acaricides Industry report?
While the report offers comprehensive insights, it's advisable to review the specific contents or supplementary materials provided to ascertain if additional resources or data are available.
14. How can I stay updated on further developments or reports in the Acaricides Industry?
To stay informed about further developments, trends, and reports in the Acaricides Industry, consider subscribing to industry newsletters, following relevant companies and organizations, or regularly checking reputable industry news sources and publications.
Methodology
Step 1 - Identification of Relevant Samples Size from Population Database


Step 2 - Approaches for Defining Global Market Size (Value, Volume* & Price*)

Note*: In applicable scenarios
Step 3 - Data Sources
Primary Research
- Web Analytics
- Survey Reports
- Research Institute
- Latest Research Reports
- Opinion Leaders
Secondary Research
- Annual Reports
- White Paper
- Latest Press Release
- Industry Association
- Paid Database
- Investor Presentations

Step 4 - Data Triangulation
Involves using different sources of information in order to increase the validity of a study
These sources are likely to be stakeholders in a program - participants, other researchers, program staff, other community members, and so on.
Then we put all data in single framework & apply various statistical tools to find out the dynamic on the market.
During the analysis stage, feedback from the stakeholder groups would be compared to determine areas of agreement as well as areas of divergence


