
Key Insights
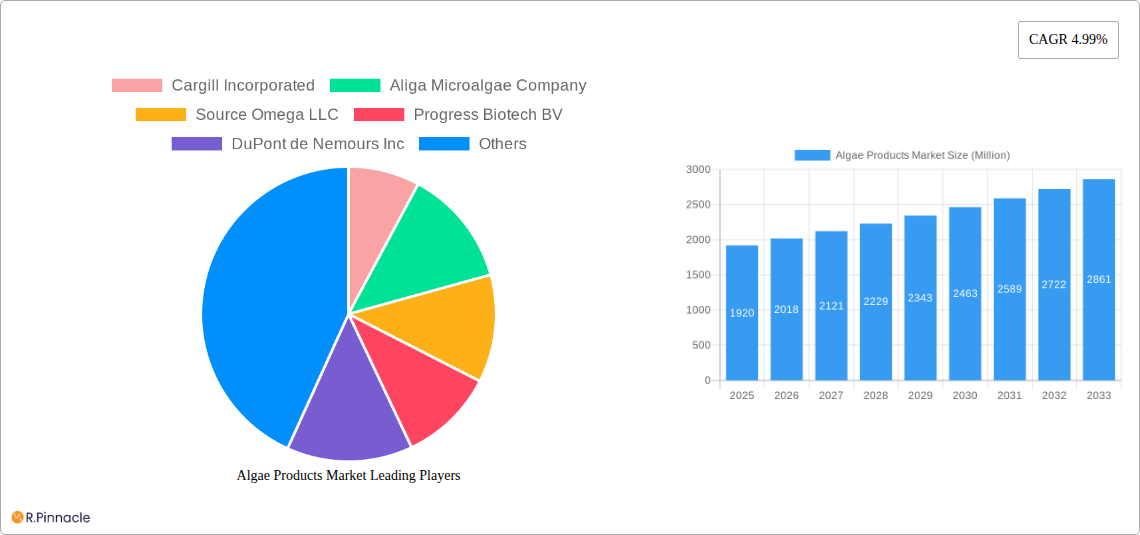
The global algae products market, valued at $1.92 billion in 2025, is projected to experience robust growth, driven by a compound annual growth rate (CAGR) of 4.99% from 2025 to 2033. This expansion is fueled by several key factors. The increasing demand for sustainable and eco-friendly ingredients in various sectors, including food and beverages, personal care, and pharmaceuticals, is a major catalyst. Consumers are increasingly aware of the health benefits associated with algae-based products, such as their high protein content, rich nutrient profile (including essential fatty acids and vitamins), and potential role in promoting gut health. This rising consumer preference for natural and functional foods is significantly boosting the market. Furthermore, ongoing research and development efforts are leading to innovative applications of algae products, expanding their market reach and creating new revenue streams. The development of cost-effective and efficient algae cultivation techniques is also contributing to the market's positive trajectory.
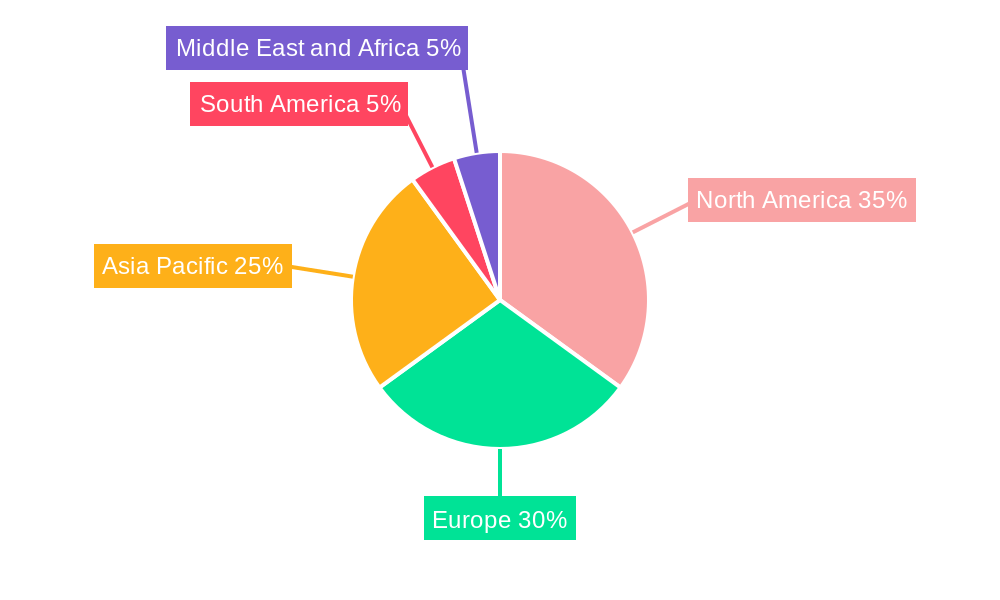
Specific segments within the market are experiencing varying levels of growth. The algal protein segment is expected to witness significant expansion due to its use as a sustainable alternative to traditional protein sources, aligning with global efforts towards reducing reliance on animal agriculture. The personal care sector is showing strong uptake of algae-based ingredients due to their moisturizing and anti-aging properties. Geographical distribution reveals strong demand in North America and Europe, driven by high consumer awareness and regulatory support for sustainable products. However, the Asia-Pacific region is anticipated to show substantial growth potential in the coming years, fueled by rising disposable incomes and increasing demand for health and wellness products. Despite these positive trends, challenges such as the high initial investment required for algae cultivation and potential scalability issues may pose some restraints on overall market growth.
Algae Products Market Report: A Comprehensive Analysis (2019-2033)
This in-depth report provides a comprehensive analysis of the Algae Products Market, offering actionable insights for industry professionals, investors, and stakeholders. Covering the period from 2019 to 2033, with a focus on 2025 (Base Year and Estimated Year), this report meticulously examines market dynamics, segmentation, key players, and future growth prospects. The projected market size for 2033 is xx Million.
Algae Products Market Structure & Innovation Trends
This section analyzes the Algae Products Market's competitive landscape, encompassing market concentration, innovation drivers, regulatory landscapes, product substitutes, end-user demographics, and mergers & acquisitions (M&A) activities. The market is moderately fragmented, with key players holding significant market share but facing competition from smaller, specialized firms.
- Market Concentration: The top five companies hold approximately xx% of the market share in 2025. This figure is expected to slightly decrease to xx% by 2033 due to increased competition.
- Innovation Drivers: Technological advancements in algae cultivation, extraction, and processing are driving market innovation. Sustainable practices and consumer demand for eco-friendly products are further accelerating innovation.
- Regulatory Frameworks: Varying regional regulations concerning food safety, labeling, and sustainability impact market growth, particularly for food and beverage applications.
- Product Substitutes: Traditional sources of proteins, oils, and other ingredients pose competition. However, the unique properties of algae products and the rising preference for sustainable options are mitigating this challenge.
- End-User Demographics: Growing health consciousness and increasing demand for functional foods are driving consumption in health-conscious demographics. The market is witnessing expansion across diverse end-use segments.
- M&A Activities: Recent M&A activities, such as Aliga Microalgae's acquisition of a chlorella algae facility (September 2022), demonstrate industry consolidation and strategic investments. The total value of M&A deals in the sector from 2019 to 2024 is estimated at xx Million.
Algae Products Market Dynamics & Trends
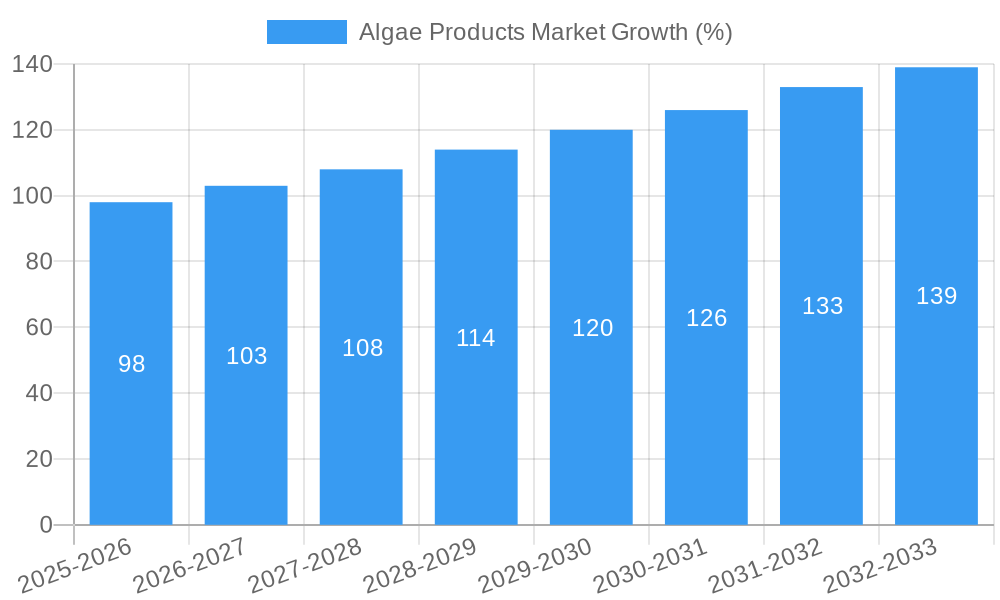
This section delves into the key factors influencing the growth of the Algae Products Market. The market is experiencing robust growth, driven by several factors. The Compound Annual Growth Rate (CAGR) is projected at xx% during the forecast period (2025-2033). Market penetration is increasing steadily across various applications, particularly in the food and beverage and personal care sectors.
The increasing demand for sustainable and healthy food products is a major driver. Consumers are actively seeking alternatives to traditional ingredients due to their environmental impact and health concerns. Technological advancements in algae cultivation, extraction, and processing are significantly lowering production costs and enhancing product quality, thereby improving market competitiveness. The expanding personal care industry, looking for eco-friendly and performance-enhancing ingredients, represents a significant growth opportunity. Competitive dynamics are characterized by both established players and emerging startups striving for market dominance. These startups are often focused on specific niche applications or unique algae strains, adding diversity and dynamism to the market.
Dominant Regions & Segments in Algae Products Market
This section identifies the leading regions, countries, and segments within the Algae Products Market.
Leading Regions: North America and Europe are currently the dominant regions, owing to strong consumer demand, robust research and development infrastructure, and favorable regulatory environments. Asia-Pacific is expected to show significant growth in the coming years due to rising population and increased awareness of algae products' benefits.
Leading Segments:
- By Source: Brown algae currently holds the largest market share due to its wide availability and diverse applications. However, green and blue-green algae segments are witnessing rapid growth, driven by innovation in cultivation and extraction techniques.
- By Product Type: Algal protein and lipids are currently the largest product segments, driven by their nutritional value and versatility in various applications. Carrageenan and alginate are also significant contributors, primarily used as thickening and stabilizing agents in the food industry.
- By Application: The food and beverage segment currently holds the largest market share due to the increasing demand for sustainable and healthy food products. The personal care segment is expected to witness significant growth owing to the rising demand for eco-friendly cosmetics and personal care products.
Key Drivers: Economic policies supporting sustainable agriculture, advancements in biotechnology, and government initiatives promoting sustainable sourcing are driving the market's growth in various regions. Developed infrastructure and substantial research and development investment further contribute to the market dominance of certain regions.
Algae Products Market Product Innovations
Recent product innovations include novel algae-based ingredients for food, dietary supplements, and cosmetics, incorporating enhanced functionalities and improved processing methods. The focus is on developing sustainable, cost-effective algae cultivation techniques while improving product quality and functionality, thereby expanding market reach and enhancing competitiveness. Technological trends encompass advanced bioreactor design, efficient harvesting and extraction methods, and sophisticated product formulation technologies.
Report Scope & Segmentation Analysis
This report encompasses a detailed segmentation of the Algae Products Market based on Source (Brown Algae, Red Algae, Green Algae, Blue-green Algae), Product Type (Algal Protein, Alginate, Carrageenan, Carotenoids, Lipids, Other Product Types), and Application (Personal Care, Food and Beverage, Dietary Supplements, Pharmaceuticals, Animal Feed, Other Applications). Each segment's growth projections, market size, and competitive dynamics are analyzed in detail, providing a clear understanding of market opportunities and challenges. For instance, the algal protein segment is expected to witness significant growth, driven by its high protein content and sustainability. Similarly, the food and beverage application is projected to remain dominant, owing to expanding consumer awareness of algae's health benefits.
Key Drivers of Algae Products Market Growth
The Algae Products Market growth is driven by several key factors. The increasing demand for sustainable and eco-friendly ingredients across various industries is a significant driver. Technological advancements in algae cultivation and extraction methods are reducing production costs and improving product quality. Growing health consciousness among consumers fuels the demand for nutrient-rich and functional food products, boosting the market. Favorable government regulations and initiatives promoting sustainable agriculture and bio-based products are further stimulating market growth.
Challenges in the Algae Products Market Sector
Despite significant growth potential, the Algae Products Market faces several challenges. High initial investment costs for algae cultivation facilities are a barrier to entry for smaller businesses. Scalability and cost-effectiveness of production remain crucial challenges. The inconsistent quality of algae-based products from different sources poses a quality control issue, requiring stringent regulatory frameworks and efficient quality testing procedures. Furthermore, competition from traditional sources of ingredients and fluctuating raw material prices also impact profitability.
Emerging Opportunities in Algae Products Market
Emerging opportunities lie in the development of novel algae-based products for niche applications, including pharmaceuticals and high-value biomaterials. Further innovations in algae cultivation, harvesting, and extraction technologies will reduce production costs and improve efficiency. Expansion into new geographic markets, particularly in developing countries, promises significant growth. A key opportunity is to leverage the growing consumer awareness of sustainability and health benefits by creating effective marketing campaigns targeting specific end-user segments.
Leading Players in the Algae Products Market Market
- Cargill Incorporated
- Aliga Microalgae Company
- Source Omega LLC
- Progress Biotech BV
- DuPont de Nemours Inc
- Archer Daniels Midland Company
- BASF SE
- Koninklijke DSM N.V.
- Algenol Biotech LLC
- Yemoja Ltd
- ACCEL Carrageenan Corporation
Key Developments in Algae Products Market Industry
- September 2022: Aliga Microalgae acquired a large chlorella algae facility in the Netherlands, boosting its production capacity and market presence.
- April 2022: Koninklijke DSM N.V. expanded its algal-sourced omega-3 product line, strengthening its position in the market.
- September 2021: AAK partnered with Progress Biotech to supply algae-based DHA for infant formula, signifying the growing use of algae in specialized nutrition products.
Future Outlook for Algae Products Market Market
The Algae Products Market is poised for substantial growth in the coming years, driven by increasing consumer demand for sustainable and healthy products. Technological advancements will continue to improve production efficiency and lower costs. Expanding applications in various sectors, along with supportive government policies, will unlock significant opportunities for market expansion. Strategic partnerships and collaborations will be crucial for players to stay competitive and capitalize on emerging market trends.
Algae Products Market Segmentation
-
1. Source
- 1.1. Brown Algae
- 1.2. Red Algae
- 1.3. Green Algae
- 1.4. Blue-green Algae
-
2. Product Type
- 2.1. Algal Protein
- 2.2. Alginate
- 2.3. Carrageenan
- 2.4. Carotenoids
- 2.5. Lipids
- 2.6. Other Product Types
-
3. Application
- 3.1. Personal Care
- 3.2. Food and Beverage
- 3.3. Dietary Supplements
- 3.4. Pharmaceuticals
- 3.5. Animal Feed
- 3.6. Other Applications
Algae Products Market Segmentation By Geography
-
1. North America
- 1.1. United States
- 1.2. Canada
- 1.3. Mexico
- 1.4. Rest of North America
-
2. Europe
- 2.1. Spain
- 2.2. United Kingdom
- 2.3. Germany
- 2.4. France
- 2.5. Italy
- 2.6. Russia
- 2.7. Rest of Europe
-
3. Asia Pacific
- 3.1. China
- 3.2. Japan
- 3.3. India
- 3.4. Australia
- 3.5. Rest of Asia Pacific
-
4. South America
- 4.1. Brazil
- 4.2. Argentina
- 4.3. Rest of South America
-
5. Middle East and Africa
- 5.1. South Africa
- 5.2. United Arab Emirates
- 5.3. Rest of Middle East and Africa
Algae Products Market REPORT HIGHLIGHTS
| Aspects | Details |
|---|---|
| Study Period | 2019-2033 |
| Base Year | 2024 |
| Estimated Year | 2025 |
| Forecast Period | 2025-2033 |
| Historical Period | 2019-2024 |
| Growth Rate | CAGR of 4.99% from 2019-2033 |
| Segmentation |
|
Table of Contents
- 1. Introduction
- 1.1. Research Scope
- 1.2. Market Segmentation
- 1.3. Research Methodology
- 1.4. Definitions and Assumptions
- 2. Executive Summary
- 2.1. Introduction
- 3. Market Dynamics
- 3.1. Introduction
- 3.2. Market Drivers
- 3.2.1. Increasing Demand for Processed Food Products; Technological Advancements Supporting Market Growth
- 3.3. Market Restrains
- 3.3.1. Increasing Cost of Production Due to Rise in Energy and Labor Cost
- 3.4. Market Trends
- 3.4.1. Health Benefits Associated With Algae Products' Consumption
- 4. Market Factor Analysis
- 4.1. Porters Five Forces
- 4.2. Supply/Value Chain
- 4.3. PESTEL analysis
- 4.4. Market Entropy
- 4.5. Patent/Trademark Analysis
- 5. Global Algae Products Market Analysis, Insights and Forecast, 2019-2031
- 5.1. Market Analysis, Insights and Forecast - by Source
- 5.1.1. Brown Algae
- 5.1.2. Red Algae
- 5.1.3. Green Algae
- 5.1.4. Blue-green Algae
- 5.2. Market Analysis, Insights and Forecast - by Product Type
- 5.2.1. Algal Protein
- 5.2.2. Alginate
- 5.2.3. Carrageenan
- 5.2.4. Carotenoids
- 5.2.5. Lipids
- 5.2.6. Other Product Types
- 5.3. Market Analysis, Insights and Forecast - by Application
- 5.3.1. Personal Care
- 5.3.2. Food and Beverage
- 5.3.3. Dietary Supplements
- 5.3.4. Pharmaceuticals
- 5.3.5. Animal Feed
- 5.3.6. Other Applications
- 5.4. Market Analysis, Insights and Forecast - by Region
- 5.4.1. North America
- 5.4.2. Europe
- 5.4.3. Asia Pacific
- 5.4.4. South America
- 5.4.5. Middle East and Africa
- 5.1. Market Analysis, Insights and Forecast - by Source
- 6. North America Algae Products Market Analysis, Insights and Forecast, 2019-2031
- 6.1. Market Analysis, Insights and Forecast - by Source
- 6.1.1. Brown Algae
- 6.1.2. Red Algae
- 6.1.3. Green Algae
- 6.1.4. Blue-green Algae
- 6.2. Market Analysis, Insights and Forecast - by Product Type
- 6.2.1. Algal Protein
- 6.2.2. Alginate
- 6.2.3. Carrageenan
- 6.2.4. Carotenoids
- 6.2.5. Lipids
- 6.2.6. Other Product Types
- 6.3. Market Analysis, Insights and Forecast - by Application
- 6.3.1. Personal Care
- 6.3.2. Food and Beverage
- 6.3.3. Dietary Supplements
- 6.3.4. Pharmaceuticals
- 6.3.5. Animal Feed
- 6.3.6. Other Applications
- 6.1. Market Analysis, Insights and Forecast - by Source
- 7. Europe Algae Products Market Analysis, Insights and Forecast, 2019-2031
- 7.1. Market Analysis, Insights and Forecast - by Source
- 7.1.1. Brown Algae
- 7.1.2. Red Algae
- 7.1.3. Green Algae
- 7.1.4. Blue-green Algae
- 7.2. Market Analysis, Insights and Forecast - by Product Type
- 7.2.1. Algal Protein
- 7.2.2. Alginate
- 7.2.3. Carrageenan
- 7.2.4. Carotenoids
- 7.2.5. Lipids
- 7.2.6. Other Product Types
- 7.3. Market Analysis, Insights and Forecast - by Application
- 7.3.1. Personal Care
- 7.3.2. Food and Beverage
- 7.3.3. Dietary Supplements
- 7.3.4. Pharmaceuticals
- 7.3.5. Animal Feed
- 7.3.6. Other Applications
- 7.1. Market Analysis, Insights and Forecast - by Source
- 8. Asia Pacific Algae Products Market Analysis, Insights and Forecast, 2019-2031
- 8.1. Market Analysis, Insights and Forecast - by Source
- 8.1.1. Brown Algae
- 8.1.2. Red Algae
- 8.1.3. Green Algae
- 8.1.4. Blue-green Algae
- 8.2. Market Analysis, Insights and Forecast - by Product Type
- 8.2.1. Algal Protein
- 8.2.2. Alginate
- 8.2.3. Carrageenan
- 8.2.4. Carotenoids
- 8.2.5. Lipids
- 8.2.6. Other Product Types
- 8.3. Market Analysis, Insights and Forecast - by Application
- 8.3.1. Personal Care
- 8.3.2. Food and Beverage
- 8.3.3. Dietary Supplements
- 8.3.4. Pharmaceuticals
- 8.3.5. Animal Feed
- 8.3.6. Other Applications
- 8.1. Market Analysis, Insights and Forecast - by Source
- 9. South America Algae Products Market Analysis, Insights and Forecast, 2019-2031
- 9.1. Market Analysis, Insights and Forecast - by Source
- 9.1.1. Brown Algae
- 9.1.2. Red Algae
- 9.1.3. Green Algae
- 9.1.4. Blue-green Algae
- 9.2. Market Analysis, Insights and Forecast - by Product Type
- 9.2.1. Algal Protein
- 9.2.2. Alginate
- 9.2.3. Carrageenan
- 9.2.4. Carotenoids
- 9.2.5. Lipids
- 9.2.6. Other Product Types
- 9.3. Market Analysis, Insights and Forecast - by Application
- 9.3.1. Personal Care
- 9.3.2. Food and Beverage
- 9.3.3. Dietary Supplements
- 9.3.4. Pharmaceuticals
- 9.3.5. Animal Feed
- 9.3.6. Other Applications
- 9.1. Market Analysis, Insights and Forecast - by Source
- 10. Middle East and Africa Algae Products Market Analysis, Insights and Forecast, 2019-2031
- 10.1. Market Analysis, Insights and Forecast - by Source
- 10.1.1. Brown Algae
- 10.1.2. Red Algae
- 10.1.3. Green Algae
- 10.1.4. Blue-green Algae
- 10.2. Market Analysis, Insights and Forecast - by Product Type
- 10.2.1. Algal Protein
- 10.2.2. Alginate
- 10.2.3. Carrageenan
- 10.2.4. Carotenoids
- 10.2.5. Lipids
- 10.2.6. Other Product Types
- 10.3. Market Analysis, Insights and Forecast - by Application
- 10.3.1. Personal Care
- 10.3.2. Food and Beverage
- 10.3.3. Dietary Supplements
- 10.3.4. Pharmaceuticals
- 10.3.5. Animal Feed
- 10.3.6. Other Applications
- 10.1. Market Analysis, Insights and Forecast - by Source
- 11. North America Algae Products Market Analysis, Insights and Forecast, 2019-2031
- 11.1. Market Analysis, Insights and Forecast - By Country/Sub-region
- 11.1.1 United States
- 11.1.2 Canada
- 11.1.3 Mexico
- 11.1.4 Rest of North America
- 12. Europe Algae Products Market Analysis, Insights and Forecast, 2019-2031
- 12.1. Market Analysis, Insights and Forecast - By Country/Sub-region
- 12.1.1 Spain
- 12.1.2 United Kingdom
- 12.1.3 Germany
- 12.1.4 France
- 12.1.5 Italy
- 12.1.6 Russia
- 12.1.7 Rest of Europe
- 13. Asia Pacific Algae Products Market Analysis, Insights and Forecast, 2019-2031
- 13.1. Market Analysis, Insights and Forecast - By Country/Sub-region
- 13.1.1 China
- 13.1.2 Japan
- 13.1.3 India
- 13.1.4 Australia
- 13.1.5 Rest of Asia Pacific
- 14. South America Algae Products Market Analysis, Insights and Forecast, 2019-2031
- 14.1. Market Analysis, Insights and Forecast - By Country/Sub-region
- 14.1.1 Brazil
- 14.1.2 Argentina
- 14.1.3 Rest of South America
- 15. Middle East and Africa Algae Products Market Analysis, Insights and Forecast, 2019-2031
- 15.1. Market Analysis, Insights and Forecast - By Country/Sub-region
- 15.1.1 South Africa
- 15.1.2 United Arab Emirates
- 15.1.3 Rest of Middle East and Africa
- 16. Competitive Analysis
- 16.1. Global Market Share Analysis 2024
- 16.2. Company Profiles
- 16.2.1 Cargill Incorporated
- 16.2.1.1. Overview
- 16.2.1.2. Products
- 16.2.1.3. SWOT Analysis
- 16.2.1.4. Recent Developments
- 16.2.1.5. Financials (Based on Availability)
- 16.2.2 Aliga Microalgae Company
- 16.2.2.1. Overview
- 16.2.2.2. Products
- 16.2.2.3. SWOT Analysis
- 16.2.2.4. Recent Developments
- 16.2.2.5. Financials (Based on Availability)
- 16.2.3 Source Omega LLC
- 16.2.3.1. Overview
- 16.2.3.2. Products
- 16.2.3.3. SWOT Analysis
- 16.2.3.4. Recent Developments
- 16.2.3.5. Financials (Based on Availability)
- 16.2.4 Progress Biotech BV
- 16.2.4.1. Overview
- 16.2.4.2. Products
- 16.2.4.3. SWOT Analysis
- 16.2.4.4. Recent Developments
- 16.2.4.5. Financials (Based on Availability)
- 16.2.5 DuPont de Nemours Inc
- 16.2.5.1. Overview
- 16.2.5.2. Products
- 16.2.5.3. SWOT Analysis
- 16.2.5.4. Recent Developments
- 16.2.5.5. Financials (Based on Availability)
- 16.2.6 Archer Daniels Midland Company
- 16.2.6.1. Overview
- 16.2.6.2. Products
- 16.2.6.3. SWOT Analysis
- 16.2.6.4. Recent Developments
- 16.2.6.5. Financials (Based on Availability)
- 16.2.7 BASF SE
- 16.2.7.1. Overview
- 16.2.7.2. Products
- 16.2.7.3. SWOT Analysis
- 16.2.7.4. Recent Developments
- 16.2.7.5. Financials (Based on Availability)
- 16.2.8 Koninklijke DSM N V
- 16.2.8.1. Overview
- 16.2.8.2. Products
- 16.2.8.3. SWOT Analysis
- 16.2.8.4. Recent Developments
- 16.2.8.5. Financials (Based on Availability)
- 16.2.9 Algenol Biotech LLC*List Not Exhaustive
- 16.2.9.1. Overview
- 16.2.9.2. Products
- 16.2.9.3. SWOT Analysis
- 16.2.9.4. Recent Developments
- 16.2.9.5. Financials (Based on Availability)
- 16.2.10 Yemoja Ltd
- 16.2.10.1. Overview
- 16.2.10.2. Products
- 16.2.10.3. SWOT Analysis
- 16.2.10.4. Recent Developments
- 16.2.10.5. Financials (Based on Availability)
- 16.2.11 ACCEL Carrageenan Corporation
- 16.2.11.1. Overview
- 16.2.11.2. Products
- 16.2.11.3. SWOT Analysis
- 16.2.11.4. Recent Developments
- 16.2.11.5. Financials (Based on Availability)
- 16.2.1 Cargill Incorporated
List of Figures
- Figure 1: Global Algae Products Market Revenue Breakdown (Million, %) by Region 2024 & 2032
- Figure 2: Global Algae Products Market Volume Breakdown (k Tons, %) by Region 2024 & 2032
- Figure 3: North America Algae Products Market Revenue (Million), by Country 2024 & 2032
- Figure 4: North America Algae Products Market Volume (k Tons), by Country 2024 & 2032
- Figure 5: North America Algae Products Market Revenue Share (%), by Country 2024 & 2032
- Figure 6: North America Algae Products Market Volume Share (%), by Country 2024 & 2032
- Figure 7: Europe Algae Products Market Revenue (Million), by Country 2024 & 2032
- Figure 8: Europe Algae Products Market Volume (k Tons), by Country 2024 & 2032
- Figure 9: Europe Algae Products Market Revenue Share (%), by Country 2024 & 2032
- Figure 10: Europe Algae Products Market Volume Share (%), by Country 2024 & 2032
- Figure 11: Asia Pacific Algae Products Market Revenue (Million), by Country 2024 & 2032
- Figure 12: Asia Pacific Algae Products Market Volume (k Tons), by Country 2024 & 2032
- Figure 13: Asia Pacific Algae Products Market Revenue Share (%), by Country 2024 & 2032
- Figure 14: Asia Pacific Algae Products Market Volume Share (%), by Country 2024 & 2032
- Figure 15: South America Algae Products Market Revenue (Million), by Country 2024 & 2032
- Figure 16: South America Algae Products Market Volume (k Tons), by Country 2024 & 2032
- Figure 17: South America Algae Products Market Revenue Share (%), by Country 2024 & 2032
- Figure 18: South America Algae Products Market Volume Share (%), by Country 2024 & 2032
- Figure 19: Middle East and Africa Algae Products Market Revenue (Million), by Country 2024 & 2032
- Figure 20: Middle East and Africa Algae Products Market Volume (k Tons), by Country 2024 & 2032
- Figure 21: Middle East and Africa Algae Products Market Revenue Share (%), by Country 2024 & 2032
- Figure 22: Middle East and Africa Algae Products Market Volume Share (%), by Country 2024 & 2032
- Figure 23: North America Algae Products Market Revenue (Million), by Source 2024 & 2032
- Figure 24: North America Algae Products Market Volume (k Tons), by Source 2024 & 2032
- Figure 25: North America Algae Products Market Revenue Share (%), by Source 2024 & 2032
- Figure 26: North America Algae Products Market Volume Share (%), by Source 2024 & 2032
- Figure 27: North America Algae Products Market Revenue (Million), by Product Type 2024 & 2032
- Figure 28: North America Algae Products Market Volume (k Tons), by Product Type 2024 & 2032
- Figure 29: North America Algae Products Market Revenue Share (%), by Product Type 2024 & 2032
- Figure 30: North America Algae Products Market Volume Share (%), by Product Type 2024 & 2032
- Figure 31: North America Algae Products Market Revenue (Million), by Application 2024 & 2032
- Figure 32: North America Algae Products Market Volume (k Tons), by Application 2024 & 2032
- Figure 33: North America Algae Products Market Revenue Share (%), by Application 2024 & 2032
- Figure 34: North America Algae Products Market Volume Share (%), by Application 2024 & 2032
- Figure 35: North America Algae Products Market Revenue (Million), by Country 2024 & 2032
- Figure 36: North America Algae Products Market Volume (k Tons), by Country 2024 & 2032
- Figure 37: North America Algae Products Market Revenue Share (%), by Country 2024 & 2032
- Figure 38: North America Algae Products Market Volume Share (%), by Country 2024 & 2032
- Figure 39: Europe Algae Products Market Revenue (Million), by Source 2024 & 2032
- Figure 40: Europe Algae Products Market Volume (k Tons), by Source 2024 & 2032
- Figure 41: Europe Algae Products Market Revenue Share (%), by Source 2024 & 2032
- Figure 42: Europe Algae Products Market Volume Share (%), by Source 2024 & 2032
- Figure 43: Europe Algae Products Market Revenue (Million), by Product Type 2024 & 2032
- Figure 44: Europe Algae Products Market Volume (k Tons), by Product Type 2024 & 2032
- Figure 45: Europe Algae Products Market Revenue Share (%), by Product Type 2024 & 2032
- Figure 46: Europe Algae Products Market Volume Share (%), by Product Type 2024 & 2032
- Figure 47: Europe Algae Products Market Revenue (Million), by Application 2024 & 2032
- Figure 48: Europe Algae Products Market Volume (k Tons), by Application 2024 & 2032
- Figure 49: Europe Algae Products Market Revenue Share (%), by Application 2024 & 2032
- Figure 50: Europe Algae Products Market Volume Share (%), by Application 2024 & 2032
- Figure 51: Europe Algae Products Market Revenue (Million), by Country 2024 & 2032
- Figure 52: Europe Algae Products Market Volume (k Tons), by Country 2024 & 2032
- Figure 53: Europe Algae Products Market Revenue Share (%), by Country 2024 & 2032
- Figure 54: Europe Algae Products Market Volume Share (%), by Country 2024 & 2032
- Figure 55: Asia Pacific Algae Products Market Revenue (Million), by Source 2024 & 2032
- Figure 56: Asia Pacific Algae Products Market Volume (k Tons), by Source 2024 & 2032
- Figure 57: Asia Pacific Algae Products Market Revenue Share (%), by Source 2024 & 2032
- Figure 58: Asia Pacific Algae Products Market Volume Share (%), by Source 2024 & 2032
- Figure 59: Asia Pacific Algae Products Market Revenue (Million), by Product Type 2024 & 2032
- Figure 60: Asia Pacific Algae Products Market Volume (k Tons), by Product Type 2024 & 2032
- Figure 61: Asia Pacific Algae Products Market Revenue Share (%), by Product Type 2024 & 2032
- Figure 62: Asia Pacific Algae Products Market Volume Share (%), by Product Type 2024 & 2032
- Figure 63: Asia Pacific Algae Products Market Revenue (Million), by Application 2024 & 2032
- Figure 64: Asia Pacific Algae Products Market Volume (k Tons), by Application 2024 & 2032
- Figure 65: Asia Pacific Algae Products Market Revenue Share (%), by Application 2024 & 2032
- Figure 66: Asia Pacific Algae Products Market Volume Share (%), by Application 2024 & 2032
- Figure 67: Asia Pacific Algae Products Market Revenue (Million), by Country 2024 & 2032
- Figure 68: Asia Pacific Algae Products Market Volume (k Tons), by Country 2024 & 2032
- Figure 69: Asia Pacific Algae Products Market Revenue Share (%), by Country 2024 & 2032
- Figure 70: Asia Pacific Algae Products Market Volume Share (%), by Country 2024 & 2032
- Figure 71: South America Algae Products Market Revenue (Million), by Source 2024 & 2032
- Figure 72: South America Algae Products Market Volume (k Tons), by Source 2024 & 2032
- Figure 73: South America Algae Products Market Revenue Share (%), by Source 2024 & 2032
- Figure 74: South America Algae Products Market Volume Share (%), by Source 2024 & 2032
- Figure 75: South America Algae Products Market Revenue (Million), by Product Type 2024 & 2032
- Figure 76: South America Algae Products Market Volume (k Tons), by Product Type 2024 & 2032
- Figure 77: South America Algae Products Market Revenue Share (%), by Product Type 2024 & 2032
- Figure 78: South America Algae Products Market Volume Share (%), by Product Type 2024 & 2032
- Figure 79: South America Algae Products Market Revenue (Million), by Application 2024 & 2032
- Figure 80: South America Algae Products Market Volume (k Tons), by Application 2024 & 2032
- Figure 81: South America Algae Products Market Revenue Share (%), by Application 2024 & 2032
- Figure 82: South America Algae Products Market Volume Share (%), by Application 2024 & 2032
- Figure 83: South America Algae Products Market Revenue (Million), by Country 2024 & 2032
- Figure 84: South America Algae Products Market Volume (k Tons), by Country 2024 & 2032
- Figure 85: South America Algae Products Market Revenue Share (%), by Country 2024 & 2032
- Figure 86: South America Algae Products Market Volume Share (%), by Country 2024 & 2032
- Figure 87: Middle East and Africa Algae Products Market Revenue (Million), by Source 2024 & 2032
- Figure 88: Middle East and Africa Algae Products Market Volume (k Tons), by Source 2024 & 2032
- Figure 89: Middle East and Africa Algae Products Market Revenue Share (%), by Source 2024 & 2032
- Figure 90: Middle East and Africa Algae Products Market Volume Share (%), by Source 2024 & 2032
- Figure 91: Middle East and Africa Algae Products Market Revenue (Million), by Product Type 2024 & 2032
- Figure 92: Middle East and Africa Algae Products Market Volume (k Tons), by Product Type 2024 & 2032
- Figure 93: Middle East and Africa Algae Products Market Revenue Share (%), by Product Type 2024 & 2032
- Figure 94: Middle East and Africa Algae Products Market Volume Share (%), by Product Type 2024 & 2032
- Figure 95: Middle East and Africa Algae Products Market Revenue (Million), by Application 2024 & 2032
- Figure 96: Middle East and Africa Algae Products Market Volume (k Tons), by Application 2024 & 2032
- Figure 97: Middle East and Africa Algae Products Market Revenue Share (%), by Application 2024 & 2032
- Figure 98: Middle East and Africa Algae Products Market Volume Share (%), by Application 2024 & 2032
- Figure 99: Middle East and Africa Algae Products Market Revenue (Million), by Country 2024 & 2032
- Figure 100: Middle East and Africa Algae Products Market Volume (k Tons), by Country 2024 & 2032
- Figure 101: Middle East and Africa Algae Products Market Revenue Share (%), by Country 2024 & 2032
- Figure 102: Middle East and Africa Algae Products Market Volume Share (%), by Country 2024 & 2032
List of Tables
- Table 1: Global Algae Products Market Revenue Million Forecast, by Region 2019 & 2032
- Table 2: Global Algae Products Market Volume k Tons Forecast, by Region 2019 & 2032
- Table 3: Global Algae Products Market Revenue Million Forecast, by Source 2019 & 2032
- Table 4: Global Algae Products Market Volume k Tons Forecast, by Source 2019 & 2032
- Table 5: Global Algae Products Market Revenue Million Forecast, by Product Type 2019 & 2032
- Table 6: Global Algae Products Market Volume k Tons Forecast, by Product Type 2019 & 2032
- Table 7: Global Algae Products Market Revenue Million Forecast, by Application 2019 & 2032
- Table 8: Global Algae Products Market Volume k Tons Forecast, by Application 2019 & 2032
- Table 9: Global Algae Products Market Revenue Million Forecast, by Region 2019 & 2032
- Table 10: Global Algae Products Market Volume k Tons Forecast, by Region 2019 & 2032
- Table 11: Global Algae Products Market Revenue Million Forecast, by Country 2019 & 2032
- Table 12: Global Algae Products Market Volume k Tons Forecast, by Country 2019 & 2032
- Table 13: United States Algae Products Market Revenue (Million) Forecast, by Application 2019 & 2032
- Table 14: United States Algae Products Market Volume (k Tons) Forecast, by Application 2019 & 2032
- Table 15: Canada Algae Products Market Revenue (Million) Forecast, by Application 2019 & 2032
- Table 16: Canada Algae Products Market Volume (k Tons) Forecast, by Application 2019 & 2032
- Table 17: Mexico Algae Products Market Revenue (Million) Forecast, by Application 2019 & 2032
- Table 18: Mexico Algae Products Market Volume (k Tons) Forecast, by Application 2019 & 2032
- Table 19: Rest of North America Algae Products Market Revenue (Million) Forecast, by Application 2019 & 2032
- Table 20: Rest of North America Algae Products Market Volume (k Tons) Forecast, by Application 2019 & 2032
- Table 21: Global Algae Products Market Revenue Million Forecast, by Country 2019 & 2032
- Table 22: Global Algae Products Market Volume k Tons Forecast, by Country 2019 & 2032
- Table 23: Spain Algae Products Market Revenue (Million) Forecast, by Application 2019 & 2032
- Table 24: Spain Algae Products Market Volume (k Tons) Forecast, by Application 2019 & 2032
- Table 25: United Kingdom Algae Products Market Revenue (Million) Forecast, by Application 2019 & 2032
- Table 26: United Kingdom Algae Products Market Volume (k Tons) Forecast, by Application 2019 & 2032
- Table 27: Germany Algae Products Market Revenue (Million) Forecast, by Application 2019 & 2032
- Table 28: Germany Algae Products Market Volume (k Tons) Forecast, by Application 2019 & 2032
- Table 29: France Algae Products Market Revenue (Million) Forecast, by Application 2019 & 2032
- Table 30: France Algae Products Market Volume (k Tons) Forecast, by Application 2019 & 2032
- Table 31: Italy Algae Products Market Revenue (Million) Forecast, by Application 2019 & 2032
- Table 32: Italy Algae Products Market Volume (k Tons) Forecast, by Application 2019 & 2032
- Table 33: Russia Algae Products Market Revenue (Million) Forecast, by Application 2019 & 2032
- Table 34: Russia Algae Products Market Volume (k Tons) Forecast, by Application 2019 & 2032
- Table 35: Rest of Europe Algae Products Market Revenue (Million) Forecast, by Application 2019 & 2032
- Table 36: Rest of Europe Algae Products Market Volume (k Tons) Forecast, by Application 2019 & 2032
- Table 37: Global Algae Products Market Revenue Million Forecast, by Country 2019 & 2032
- Table 38: Global Algae Products Market Volume k Tons Forecast, by Country 2019 & 2032
- Table 39: China Algae Products Market Revenue (Million) Forecast, by Application 2019 & 2032
- Table 40: China Algae Products Market Volume (k Tons) Forecast, by Application 2019 & 2032
- Table 41: Japan Algae Products Market Revenue (Million) Forecast, by Application 2019 & 2032
- Table 42: Japan Algae Products Market Volume (k Tons) Forecast, by Application 2019 & 2032
- Table 43: India Algae Products Market Revenue (Million) Forecast, by Application 2019 & 2032
- Table 44: India Algae Products Market Volume (k Tons) Forecast, by Application 2019 & 2032
- Table 45: Australia Algae Products Market Revenue (Million) Forecast, by Application 2019 & 2032
- Table 46: Australia Algae Products Market Volume (k Tons) Forecast, by Application 2019 & 2032
- Table 47: Rest of Asia Pacific Algae Products Market Revenue (Million) Forecast, by Application 2019 & 2032
- Table 48: Rest of Asia Pacific Algae Products Market Volume (k Tons) Forecast, by Application 2019 & 2032
- Table 49: Global Algae Products Market Revenue Million Forecast, by Country 2019 & 2032
- Table 50: Global Algae Products Market Volume k Tons Forecast, by Country 2019 & 2032
- Table 51: Brazil Algae Products Market Revenue (Million) Forecast, by Application 2019 & 2032
- Table 52: Brazil Algae Products Market Volume (k Tons) Forecast, by Application 2019 & 2032
- Table 53: Argentina Algae Products Market Revenue (Million) Forecast, by Application 2019 & 2032
- Table 54: Argentina Algae Products Market Volume (k Tons) Forecast, by Application 2019 & 2032
- Table 55: Rest of South America Algae Products Market Revenue (Million) Forecast, by Application 2019 & 2032
- Table 56: Rest of South America Algae Products Market Volume (k Tons) Forecast, by Application 2019 & 2032
- Table 57: Global Algae Products Market Revenue Million Forecast, by Country 2019 & 2032
- Table 58: Global Algae Products Market Volume k Tons Forecast, by Country 2019 & 2032
- Table 59: South Africa Algae Products Market Revenue (Million) Forecast, by Application 2019 & 2032
- Table 60: South Africa Algae Products Market Volume (k Tons) Forecast, by Application 2019 & 2032
- Table 61: United Arab Emirates Algae Products Market Revenue (Million) Forecast, by Application 2019 & 2032
- Table 62: United Arab Emirates Algae Products Market Volume (k Tons) Forecast, by Application 2019 & 2032
- Table 63: Rest of Middle East and Africa Algae Products Market Revenue (Million) Forecast, by Application 2019 & 2032
- Table 64: Rest of Middle East and Africa Algae Products Market Volume (k Tons) Forecast, by Application 2019 & 2032
- Table 65: Global Algae Products Market Revenue Million Forecast, by Source 2019 & 2032
- Table 66: Global Algae Products Market Volume k Tons Forecast, by Source 2019 & 2032
- Table 67: Global Algae Products Market Revenue Million Forecast, by Product Type 2019 & 2032
- Table 68: Global Algae Products Market Volume k Tons Forecast, by Product Type 2019 & 2032
- Table 69: Global Algae Products Market Revenue Million Forecast, by Application 2019 & 2032
- Table 70: Global Algae Products Market Volume k Tons Forecast, by Application 2019 & 2032
- Table 71: Global Algae Products Market Revenue Million Forecast, by Country 2019 & 2032
- Table 72: Global Algae Products Market Volume k Tons Forecast, by Country 2019 & 2032
- Table 73: United States Algae Products Market Revenue (Million) Forecast, by Application 2019 & 2032
- Table 74: United States Algae Products Market Volume (k Tons) Forecast, by Application 2019 & 2032
- Table 75: Canada Algae Products Market Revenue (Million) Forecast, by Application 2019 & 2032
- Table 76: Canada Algae Products Market Volume (k Tons) Forecast, by Application 2019 & 2032
- Table 77: Mexico Algae Products Market Revenue (Million) Forecast, by Application 2019 & 2032
- Table 78: Mexico Algae Products Market Volume (k Tons) Forecast, by Application 2019 & 2032
- Table 79: Rest of North America Algae Products Market Revenue (Million) Forecast, by Application 2019 & 2032
- Table 80: Rest of North America Algae Products Market Volume (k Tons) Forecast, by Application 2019 & 2032
- Table 81: Global Algae Products Market Revenue Million Forecast, by Source 2019 & 2032
- Table 82: Global Algae Products Market Volume k Tons Forecast, by Source 2019 & 2032
- Table 83: Global Algae Products Market Revenue Million Forecast, by Product Type 2019 & 2032
- Table 84: Global Algae Products Market Volume k Tons Forecast, by Product Type 2019 & 2032
- Table 85: Global Algae Products Market Revenue Million Forecast, by Application 2019 & 2032
- Table 86: Global Algae Products Market Volume k Tons Forecast, by Application 2019 & 2032
- Table 87: Global Algae Products Market Revenue Million Forecast, by Country 2019 & 2032
- Table 88: Global Algae Products Market Volume k Tons Forecast, by Country 2019 & 2032
- Table 89: Spain Algae Products Market Revenue (Million) Forecast, by Application 2019 & 2032
- Table 90: Spain Algae Products Market Volume (k Tons) Forecast, by Application 2019 & 2032
- Table 91: United Kingdom Algae Products Market Revenue (Million) Forecast, by Application 2019 & 2032
- Table 92: United Kingdom Algae Products Market Volume (k Tons) Forecast, by Application 2019 & 2032
- Table 93: Germany Algae Products Market Revenue (Million) Forecast, by Application 2019 & 2032
- Table 94: Germany Algae Products Market Volume (k Tons) Forecast, by Application 2019 & 2032
- Table 95: France Algae Products Market Revenue (Million) Forecast, by Application 2019 & 2032
- Table 96: France Algae Products Market Volume (k Tons) Forecast, by Application 2019 & 2032
- Table 97: Italy Algae Products Market Revenue (Million) Forecast, by Application 2019 & 2032
- Table 98: Italy Algae Products Market Volume (k Tons) Forecast, by Application 2019 & 2032
- Table 99: Russia Algae Products Market Revenue (Million) Forecast, by Application 2019 & 2032
- Table 100: Russia Algae Products Market Volume (k Tons) Forecast, by Application 2019 & 2032
- Table 101: Rest of Europe Algae Products Market Revenue (Million) Forecast, by Application 2019 & 2032
- Table 102: Rest of Europe Algae Products Market Volume (k Tons) Forecast, by Application 2019 & 2032
- Table 103: Global Algae Products Market Revenue Million Forecast, by Source 2019 & 2032
- Table 104: Global Algae Products Market Volume k Tons Forecast, by Source 2019 & 2032
- Table 105: Global Algae Products Market Revenue Million Forecast, by Product Type 2019 & 2032
- Table 106: Global Algae Products Market Volume k Tons Forecast, by Product Type 2019 & 2032
- Table 107: Global Algae Products Market Revenue Million Forecast, by Application 2019 & 2032
- Table 108: Global Algae Products Market Volume k Tons Forecast, by Application 2019 & 2032
- Table 109: Global Algae Products Market Revenue Million Forecast, by Country 2019 & 2032
- Table 110: Global Algae Products Market Volume k Tons Forecast, by Country 2019 & 2032
- Table 111: China Algae Products Market Revenue (Million) Forecast, by Application 2019 & 2032
- Table 112: China Algae Products Market Volume (k Tons) Forecast, by Application 2019 & 2032
- Table 113: Japan Algae Products Market Revenue (Million) Forecast, by Application 2019 & 2032
- Table 114: Japan Algae Products Market Volume (k Tons) Forecast, by Application 2019 & 2032
- Table 115: India Algae Products Market Revenue (Million) Forecast, by Application 2019 & 2032
- Table 116: India Algae Products Market Volume (k Tons) Forecast, by Application 2019 & 2032
- Table 117: Australia Algae Products Market Revenue (Million) Forecast, by Application 2019 & 2032
- Table 118: Australia Algae Products Market Volume (k Tons) Forecast, by Application 2019 & 2032
- Table 119: Rest of Asia Pacific Algae Products Market Revenue (Million) Forecast, by Application 2019 & 2032
- Table 120: Rest of Asia Pacific Algae Products Market Volume (k Tons) Forecast, by Application 2019 & 2032
- Table 121: Global Algae Products Market Revenue Million Forecast, by Source 2019 & 2032
- Table 122: Global Algae Products Market Volume k Tons Forecast, by Source 2019 & 2032
- Table 123: Global Algae Products Market Revenue Million Forecast, by Product Type 2019 & 2032
- Table 124: Global Algae Products Market Volume k Tons Forecast, by Product Type 2019 & 2032
- Table 125: Global Algae Products Market Revenue Million Forecast, by Application 2019 & 2032
- Table 126: Global Algae Products Market Volume k Tons Forecast, by Application 2019 & 2032
- Table 127: Global Algae Products Market Revenue Million Forecast, by Country 2019 & 2032
- Table 128: Global Algae Products Market Volume k Tons Forecast, by Country 2019 & 2032
- Table 129: Brazil Algae Products Market Revenue (Million) Forecast, by Application 2019 & 2032
- Table 130: Brazil Algae Products Market Volume (k Tons) Forecast, by Application 2019 & 2032
- Table 131: Argentina Algae Products Market Revenue (Million) Forecast, by Application 2019 & 2032
- Table 132: Argentina Algae Products Market Volume (k Tons) Forecast, by Application 2019 & 2032
- Table 133: Rest of South America Algae Products Market Revenue (Million) Forecast, by Application 2019 & 2032
- Table 134: Rest of South America Algae Products Market Volume (k Tons) Forecast, by Application 2019 & 2032
- Table 135: Global Algae Products Market Revenue Million Forecast, by Source 2019 & 2032
- Table 136: Global Algae Products Market Volume k Tons Forecast, by Source 2019 & 2032
- Table 137: Global Algae Products Market Revenue Million Forecast, by Product Type 2019 & 2032
- Table 138: Global Algae Products Market Volume k Tons Forecast, by Product Type 2019 & 2032
- Table 139: Global Algae Products Market Revenue Million Forecast, by Application 2019 & 2032
- Table 140: Global Algae Products Market Volume k Tons Forecast, by Application 2019 & 2032
- Table 141: Global Algae Products Market Revenue Million Forecast, by Country 2019 & 2032
- Table 142: Global Algae Products Market Volume k Tons Forecast, by Country 2019 & 2032
- Table 143: South Africa Algae Products Market Revenue (Million) Forecast, by Application 2019 & 2032
- Table 144: South Africa Algae Products Market Volume (k Tons) Forecast, by Application 2019 & 2032
- Table 145: United Arab Emirates Algae Products Market Revenue (Million) Forecast, by Application 2019 & 2032
- Table 146: United Arab Emirates Algae Products Market Volume (k Tons) Forecast, by Application 2019 & 2032
- Table 147: Rest of Middle East and Africa Algae Products Market Revenue (Million) Forecast, by Application 2019 & 2032
- Table 148: Rest of Middle East and Africa Algae Products Market Volume (k Tons) Forecast, by Application 2019 & 2032
Frequently Asked Questions
1. What is the projected Compound Annual Growth Rate (CAGR) of the Algae Products Market?
The projected CAGR is approximately 4.99%.
2. Which companies are prominent players in the Algae Products Market?
Key companies in the market include Cargill Incorporated, Aliga Microalgae Company, Source Omega LLC, Progress Biotech BV, DuPont de Nemours Inc, Archer Daniels Midland Company, BASF SE, Koninklijke DSM N V, Algenol Biotech LLC*List Not Exhaustive, Yemoja Ltd, ACCEL Carrageenan Corporation.
3. What are the main segments of the Algae Products Market?
The market segments include Source, Product Type, Application.
4. Can you provide details about the market size?
The market size is estimated to be USD 1.92 Million as of 2022.
5. What are some drivers contributing to market growth?
Increasing Demand for Processed Food Products; Technological Advancements Supporting Market Growth.
6. What are the notable trends driving market growth?
Health Benefits Associated With Algae Products' Consumption.
7. Are there any restraints impacting market growth?
Increasing Cost of Production Due to Rise in Energy and Labor Cost.
8. Can you provide examples of recent developments in the market?
In September 2022, in the Netherlands, the Danish company Aliga Microalgae (Aliga) acquired a large chlorella algae facility. The company plans to use a modern production facility to commercialize its chlorella algae products.
9. What pricing options are available for accessing the report?
Pricing options include single-user, multi-user, and enterprise licenses priced at USD 4750, USD 5250, and USD 8750 respectively.
10. Is the market size provided in terms of value or volume?
The market size is provided in terms of value, measured in Million and volume, measured in k Tons.
11. Are there any specific market keywords associated with the report?
Yes, the market keyword associated with the report is "Algae Products Market," which aids in identifying and referencing the specific market segment covered.
12. How do I determine which pricing option suits my needs best?
The pricing options vary based on user requirements and access needs. Individual users may opt for single-user licenses, while businesses requiring broader access may choose multi-user or enterprise licenses for cost-effective access to the report.
13. Are there any additional resources or data provided in the Algae Products Market report?
While the report offers comprehensive insights, it's advisable to review the specific contents or supplementary materials provided to ascertain if additional resources or data are available.
14. How can I stay updated on further developments or reports in the Algae Products Market?
To stay informed about further developments, trends, and reports in the Algae Products Market, consider subscribing to industry newsletters, following relevant companies and organizations, or regularly checking reputable industry news sources and publications.
Methodology
Step 1 - Identification of Relevant Samples Size from Population Database


Step 2 - Approaches for Defining Global Market Size (Value, Volume* & Price*)

Note*: In applicable scenarios
Step 3 - Data Sources
Primary Research
- Web Analytics
- Survey Reports
- Research Institute
- Latest Research Reports
- Opinion Leaders
Secondary Research
- Annual Reports
- White Paper
- Latest Press Release
- Industry Association
- Paid Database
- Investor Presentations

Step 4 - Data Triangulation
Involves using different sources of information in order to increase the validity of a study
These sources are likely to be stakeholders in a program - participants, other researchers, program staff, other community members, and so on.
Then we put all data in single framework & apply various statistical tools to find out the dynamic on the market.
During the analysis stage, feedback from the stakeholder groups would be compared to determine areas of agreement as well as areas of divergence


