
Key Insights
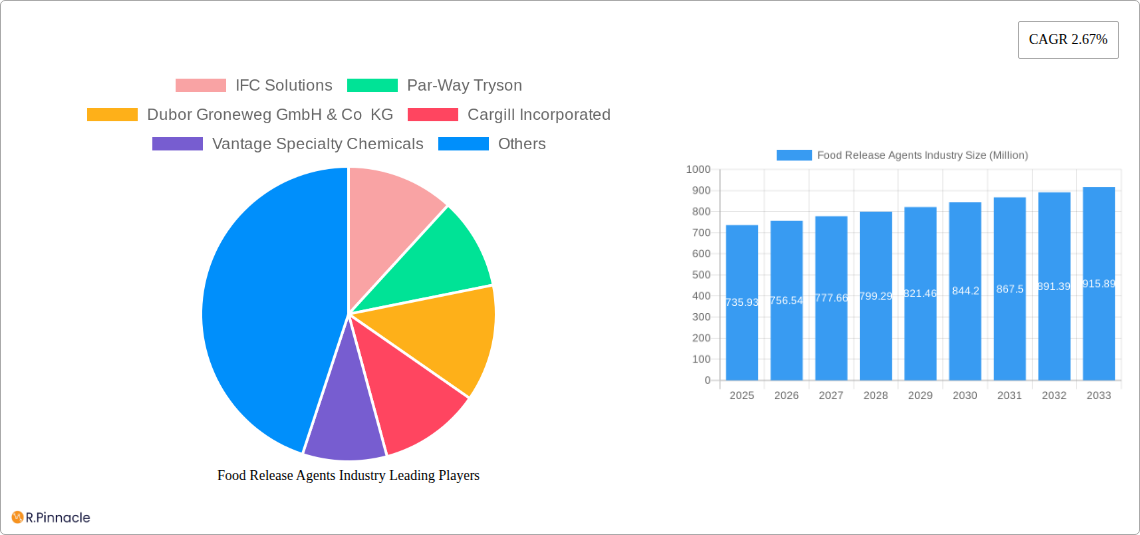
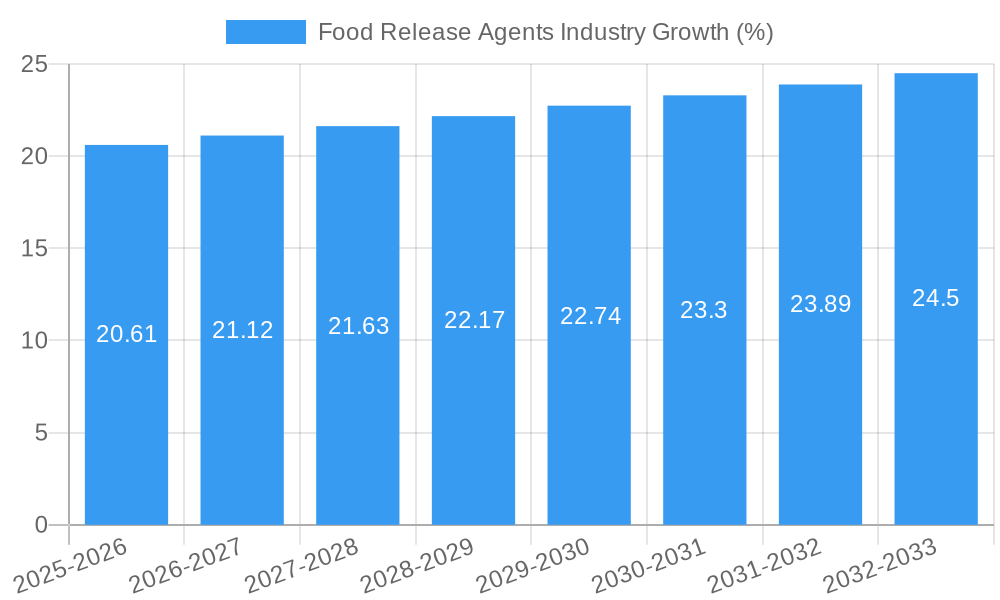
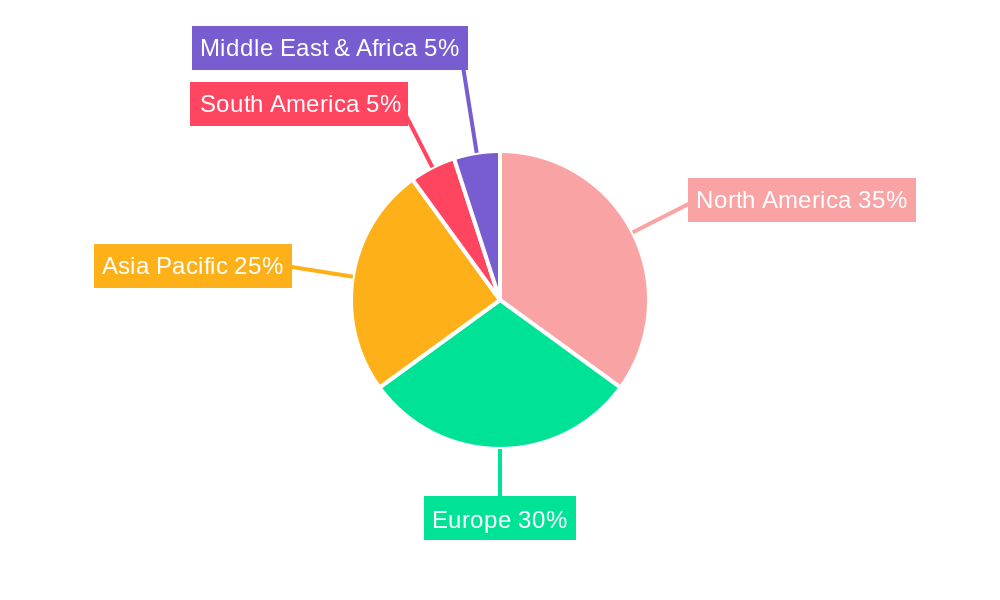
The global food release agents market, valued at $735.93 million in 2025, is projected to experience steady growth, driven by increasing demand for processed foods and the need for efficient manufacturing processes across various food segments like bakery, confectionery, and meat products. The market's Compound Annual Growth Rate (CAGR) of 2.67% from 2025 to 2033 indicates a consistent, albeit moderate, expansion. This growth is fueled by several key factors: the rising popularity of convenience foods, leading to increased production volumes requiring effective release agents; the ongoing innovation in food processing technologies, demanding specialized release agents to optimize production efficiency and product quality; and the increasing adoption of automation in food manufacturing plants. The market is segmented by product type (synthetic and bio-based) and application (bakery, confectionery, meat and meat products, and others). Synthetic release agents currently dominate due to their cost-effectiveness and performance characteristics, but the bio-based segment is experiencing significant growth driven by growing consumer demand for natural and sustainable food production methods. Geographic distribution reflects the established food processing industries, with North America and Europe holding significant market share initially, though Asia-Pacific is expected to show strong growth potential in the coming years due to rising disposable incomes and urbanization.
Despite the positive outlook, the market faces challenges. Fluctuations in raw material prices, particularly for synthetic components, could impact profitability. Stringent regulatory requirements regarding food safety and environmental concerns around certain release agents also pose constraints. However, the industry is adapting through research and development focusing on sustainable and high-performing bio-based alternatives and formulations to mitigate these challenges. Major players such as Cargill Incorporated, Archer-Daniels-Midland Co, and others are actively investing in research and development to enhance their product portfolios and capture a larger market share. Competition is expected to intensify, driven by both established industry giants and emerging specialty chemical companies. The continued emphasis on product innovation and adaptation to shifting consumer preferences will be key to future success in this evolving market.
Food Release Agents Industry Report: 2019-2033 Market Analysis & Forecast
This comprehensive report provides an in-depth analysis of the Food Release Agents industry, offering valuable insights for industry professionals, investors, and strategic decision-makers. Covering the period from 2019 to 2033, with a focus on 2025, this report unveils market dynamics, growth drivers, and future trends. The global market size is projected to reach xx Million by 2033, showcasing significant growth opportunities.
Food Release Agents Industry Market Structure & Innovation Trends
The Food Release Agents market exhibits a moderately consolidated structure, with key players like Cargill Incorporated, Bunge Limited, and Archer-Daniels-Midland Co holding significant market share. However, the presence of several smaller, specialized players fosters competition and innovation. Market share data for 2025 suggests Cargill holds approximately xx%, Bunge holds approximately xx%, and ADM holds approximately xx%, with the remaining share distributed amongst other players including IFC Solutions, Par-Way Tryson, Dubor Groneweg GmbH & Co KG, Vantage Specialty Chemicals, Lasenor Emul SL, Avatar Corporation, and Bundy Baking Solutions. Innovation is driven by the demand for sustainable, high-performing, and cost-effective solutions. Regulatory frameworks, particularly concerning food safety and sustainability, significantly impact product development and market entry. The market sees a steady stream of M&A activities, with deal values in recent years averaging xx Million. Product substitution is observed with the rising adoption of bio-based alternatives to synthetic agents. End-user demographics significantly influence product preferences, particularly in the bakery and confectionery segments.
- Market Concentration: Moderately Consolidated
- Innovation Drivers: Sustainability, Performance, Cost-Effectiveness
- Regulatory Framework: Stringent food safety and environmental regulations
- M&A Activity: Average deal value: xx Million in recent years
Food Release Agents Industry Market Dynamics & Trends
The Food Release Agents market is experiencing robust growth, driven by factors such as the rising demand for processed foods, increasing consumer preference for convenience foods, and the expansion of the bakery and confectionery industries. Technological advancements in release agent formulation are leading to enhanced product performance and increased efficiency. Consumer preferences are shifting towards natural and sustainable ingredients, driving the growth of the bio-based segment. Competitive dynamics are shaped by product differentiation, pricing strategies, and technological innovation. The market is projected to exhibit a CAGR of xx% during the forecast period (2025-2033), with market penetration expected to reach xx% by 2033. Technological disruptions are primarily focused on developing more sustainable and efficient production processes.
Dominant Regions & Segments in Food Release Agents Industry
North America currently holds the largest market share in the Food Release Agents industry, driven by robust demand from the food processing sector and well-established infrastructure. Europe follows closely, demonstrating strong growth potential. Within the segments:
- By Category: The synthetic segment currently dominates due to its established performance and cost-effectiveness, although bio-based agents are witnessing accelerated growth, driven by sustainability concerns.
- By Application: The bakery segment holds the largest share, followed closely by confectionery and meat and meat products. The ‘Other Applications’ segment shows promising growth, driven by diversification into areas like pharmaceuticals and cosmetics.
Key Drivers for North America:
- Robust food processing sector
- Strong consumer demand for convenience food
- Well-developed infrastructure
Key Drivers for Europe:
- Growing demand for processed foods
- Increasing focus on food safety and sustainability
Food Release Agents Industry Product Innovations
Recent innovations focus on developing food release agents with improved performance characteristics, such as enhanced release properties, improved heat resistance, and reduced migration into the food product. The emphasis is on sustainable and environmentally friendly formulations using bio-based materials. These innovations aim to meet the growing demand for clean-label products and reduce environmental impact. The competitive advantage lies in offering superior performance, cost-effectiveness, and eco-friendly solutions tailored to specific application needs.
Report Scope & Segmentation Analysis
This report provides a detailed segmentation analysis of the Food Release Agents market:
By Category:
- Synthetic: This segment is projected to grow at a CAGR of xx% during the forecast period, driven by its cost-effectiveness and superior performance characteristics. The market is characterized by intense competition among established players.
- Bio-based: This segment is expected to witness the highest growth rate (CAGR of xx%), fuelled by rising consumer demand for sustainable products. However, higher production costs pose a challenge.
By Application:
- Bakery: This segment dominates the market due to high demand for baked goods. Growth is projected at a CAGR of xx%.
- Confectionery: This segment exhibits moderate growth (CAGR of xx%), driven by the increasing popularity of confectionery products.
- Meat and Meat Products: This segment shows steady growth (CAGR of xx%), driven by the growing demand for processed meat products.
- Other Applications: This segment is expected to demonstrate high growth, showcasing potential in diverse applications.
Key Drivers of Food Release Agents Industry Growth
Several factors drive the growth of the Food Release Agents industry: The expansion of the food processing industry, particularly in developing economies, fuels the demand for efficient release agents. Increasing consumer demand for convenience and ready-to-eat foods necessitates the use of high-performing release agents. Technological advancements in release agent formulations constantly enhance product performance and efficiency. Government regulations promoting food safety and sustainability influence the adoption of eco-friendly release agents.
Challenges in the Food Release Agents Industry Sector
The industry faces challenges like stringent regulatory compliance requirements, which increase production costs and complexity. Fluctuations in raw material prices and supply chain disruptions impact production costs and profitability. Intense competition amongst established players and the emergence of new entrants puts pressure on pricing and margins. The industry needs to address sustainability concerns, particularly regarding the environmental impact of synthetic release agents.
Emerging Opportunities in Food Release Agents Industry
Emerging opportunities include the development and adoption of sustainable and biodegradable release agents to meet increasing environmental concerns. Expansion into new and developing markets with a growing food processing sector presents significant potential. Technological advancements in formulation and processing can lead to the development of customized release agents for specific applications. The rising demand for clean-label products offers opportunities for innovative, natural release agents.
Leading Players in the Food Release Agents Industry Market
- IFC Solutions
- Par-Way Tryson
- Dubor Groneweg GmbH & Co KG
- Cargill Incorporated
- Vantage Specialty Chemicals
- Lasenor Emul SL
- Bunge Limited
- Avatar Corporation
- Archer-Daniels-Midland Co
- Bundy Baking solutions
Key Developments in Food Release Agents Industry Industry
- 2022 Q4: Cargill Incorporated launched a new line of sustainable release agents.
- 2023 Q1: Bunge Limited acquired a smaller release agent manufacturer, expanding its market presence.
- 2023 Q3: Archer Daniels Midland Co invested in R&D for bio-based release agents. (Further specific developments with dates would be included in the full report)
Future Outlook for Food Release Agents Industry Market
The Food Release Agents market is poised for continued growth, driven by sustained demand for processed foods and the increasing adoption of sustainable solutions. Strategic opportunities lie in developing innovative, high-performance, and environmentally friendly release agents tailored to specific market needs. The focus on sustainability and consumer preferences for clean-label products will shape future product development and market leadership. The market is expected to continue its trajectory of growth and innovation throughout the forecast period.
Food Release Agents Industry Segmentation
-
1. Cateogry
- 1.1. Synthetic
- 1.2. Bio-based
-
2. Application
- 2.1. Bakery
- 2.2. Confectionery
- 2.3. Meat and Meat Products
- 2.4. Other Applications
Food Release Agents Industry Segmentation By Geography
-
1. North America
- 1.1. United States
- 1.2. Canada
- 1.3. Mexico
- 1.4. Rest of North America
-
2. Europe
- 2.1. United Kingdom
- 2.2. Germany
- 2.3. France
- 2.4. Russia
- 2.5. Italy
- 2.6. Spain
- 2.7. Rest of Europe
-
3. Asia Pacific
- 3.1. India
- 3.2. China
- 3.3. Japan
- 3.4. Australia
- 3.5. Rest of Asia Pacific
-
4. South America
- 4.1. Brazil
- 4.2. Argentina
- 4.3. Rest of South America
- 5. Middle East
-
6. South Africa
- 6.1. United Arab Emirates
- 6.2. Rest of Middle East
Food Release Agents Industry REPORT HIGHLIGHTS
| Aspects | Details |
|---|---|
| Study Period | 2019-2033 |
| Base Year | 2024 |
| Estimated Year | 2025 |
| Forecast Period | 2025-2033 |
| Historical Period | 2019-2024 |
| Growth Rate | CAGR of 2.67% from 2019-2033 |
| Segmentation |
|
Table of Contents
- 1. Introduction
- 1.1. Research Scope
- 1.2. Market Segmentation
- 1.3. Research Methodology
- 1.4. Definitions and Assumptions
- 2. Executive Summary
- 2.1. Introduction
- 3. Market Dynamics
- 3.1. Introduction
- 3.2. Market Drivers
- 3.2.1. Health Benefits Promoting Apple Cider Vinegar Demand; Unfiltered Apple Cider Vinegar Being Popular
- 3.3. Market Restrains
- 3.3.1. Rising Demand for Other Vinegar Types
- 3.4. Market Trends
- 3.4.1. Wide Applications and Functionality
- 4. Market Factor Analysis
- 4.1. Porters Five Forces
- 4.2. Supply/Value Chain
- 4.3. PESTEL analysis
- 4.4. Market Entropy
- 4.5. Patent/Trademark Analysis
- 5. Global Food Release Agents Industry Analysis, Insights and Forecast, 2019-2031
- 5.1. Market Analysis, Insights and Forecast - by Cateogry
- 5.1.1. Synthetic
- 5.1.2. Bio-based
- 5.2. Market Analysis, Insights and Forecast - by Application
- 5.2.1. Bakery
- 5.2.2. Confectionery
- 5.2.3. Meat and Meat Products
- 5.2.4. Other Applications
- 5.3. Market Analysis, Insights and Forecast - by Region
- 5.3.1. North America
- 5.3.2. Europe
- 5.3.3. Asia Pacific
- 5.3.4. South America
- 5.3.5. Middle East
- 5.3.6. South Africa
- 5.1. Market Analysis, Insights and Forecast - by Cateogry
- 6. North America Food Release Agents Industry Analysis, Insights and Forecast, 2019-2031
- 6.1. Market Analysis, Insights and Forecast - by Cateogry
- 6.1.1. Synthetic
- 6.1.2. Bio-based
- 6.2. Market Analysis, Insights and Forecast - by Application
- 6.2.1. Bakery
- 6.2.2. Confectionery
- 6.2.3. Meat and Meat Products
- 6.2.4. Other Applications
- 6.1. Market Analysis, Insights and Forecast - by Cateogry
- 7. Europe Food Release Agents Industry Analysis, Insights and Forecast, 2019-2031
- 7.1. Market Analysis, Insights and Forecast - by Cateogry
- 7.1.1. Synthetic
- 7.1.2. Bio-based
- 7.2. Market Analysis, Insights and Forecast - by Application
- 7.2.1. Bakery
- 7.2.2. Confectionery
- 7.2.3. Meat and Meat Products
- 7.2.4. Other Applications
- 7.1. Market Analysis, Insights and Forecast - by Cateogry
- 8. Asia Pacific Food Release Agents Industry Analysis, Insights and Forecast, 2019-2031
- 8.1. Market Analysis, Insights and Forecast - by Cateogry
- 8.1.1. Synthetic
- 8.1.2. Bio-based
- 8.2. Market Analysis, Insights and Forecast - by Application
- 8.2.1. Bakery
- 8.2.2. Confectionery
- 8.2.3. Meat and Meat Products
- 8.2.4. Other Applications
- 8.1. Market Analysis, Insights and Forecast - by Cateogry
- 9. South America Food Release Agents Industry Analysis, Insights and Forecast, 2019-2031
- 9.1. Market Analysis, Insights and Forecast - by Cateogry
- 9.1.1. Synthetic
- 9.1.2. Bio-based
- 9.2. Market Analysis, Insights and Forecast - by Application
- 9.2.1. Bakery
- 9.2.2. Confectionery
- 9.2.3. Meat and Meat Products
- 9.2.4. Other Applications
- 9.1. Market Analysis, Insights and Forecast - by Cateogry
- 10. Middle East Food Release Agents Industry Analysis, Insights and Forecast, 2019-2031
- 10.1. Market Analysis, Insights and Forecast - by Cateogry
- 10.1.1. Synthetic
- 10.1.2. Bio-based
- 10.2. Market Analysis, Insights and Forecast - by Application
- 10.2.1. Bakery
- 10.2.2. Confectionery
- 10.2.3. Meat and Meat Products
- 10.2.4. Other Applications
- 10.1. Market Analysis, Insights and Forecast - by Cateogry
- 11. South Africa Food Release Agents Industry Analysis, Insights and Forecast, 2019-2031
- 11.1. Market Analysis, Insights and Forecast - by Cateogry
- 11.1.1. Synthetic
- 11.1.2. Bio-based
- 11.2. Market Analysis, Insights and Forecast - by Application
- 11.2.1. Bakery
- 11.2.2. Confectionery
- 11.2.3. Meat and Meat Products
- 11.2.4. Other Applications
- 11.1. Market Analysis, Insights and Forecast - by Cateogry
- 12. North America Food Release Agents Industry Analysis, Insights and Forecast, 2019-2031
- 12.1. Market Analysis, Insights and Forecast - By Country/Sub-region
- 12.1.1 United States
- 12.1.2 Canada
- 12.1.3 Mexico
- 12.1.4 Rest of North America
- 13. Europe Food Release Agents Industry Analysis, Insights and Forecast, 2019-2031
- 13.1. Market Analysis, Insights and Forecast - By Country/Sub-region
- 13.1.1 United Kingdom
- 13.1.2 Germany
- 13.1.3 France
- 13.1.4 Russia
- 13.1.5 Italy
- 13.1.6 Spain
- 13.1.7 Rest of Europe
- 14. Asia Pacific Food Release Agents Industry Analysis, Insights and Forecast, 2019-2031
- 14.1. Market Analysis, Insights and Forecast - By Country/Sub-region
- 14.1.1 India
- 14.1.2 China
- 14.1.3 Japan
- 14.1.4 Australia
- 14.1.5 Rest of Asia Pacific
- 15. South America Food Release Agents Industry Analysis, Insights and Forecast, 2019-2031
- 15.1. Market Analysis, Insights and Forecast - By Country/Sub-region
- 15.1.1 Brazil
- 15.1.2 Argentina
- 15.1.3 Rest of South America
- 16. Middle East & Africa Food Release Agents Industry Analysis, Insights and Forecast, 2019-2031
- 16.1. Market Analysis, Insights and Forecast - By Country/Sub-region
- 16.1.1 UAE
- 16.1.2 South Africa
- 16.1.3 Saudi Arabia
- 16.1.4 Rest of MEA
- 17. Competitive Analysis
- 17.1. Global Market Share Analysis 2024
- 17.2. Company Profiles
- 17.2.1 IFC Solutions
- 17.2.1.1. Overview
- 17.2.1.2. Products
- 17.2.1.3. SWOT Analysis
- 17.2.1.4. Recent Developments
- 17.2.1.5. Financials (Based on Availability)
- 17.2.2 Par-Way Tryson
- 17.2.2.1. Overview
- 17.2.2.2. Products
- 17.2.2.3. SWOT Analysis
- 17.2.2.4. Recent Developments
- 17.2.2.5. Financials (Based on Availability)
- 17.2.3 Dubor Groneweg GmbH & Co KG
- 17.2.3.1. Overview
- 17.2.3.2. Products
- 17.2.3.3. SWOT Analysis
- 17.2.3.4. Recent Developments
- 17.2.3.5. Financials (Based on Availability)
- 17.2.4 Cargill Incorporated
- 17.2.4.1. Overview
- 17.2.4.2. Products
- 17.2.4.3. SWOT Analysis
- 17.2.4.4. Recent Developments
- 17.2.4.5. Financials (Based on Availability)
- 17.2.5 Vantage Specialty Chemicals
- 17.2.5.1. Overview
- 17.2.5.2. Products
- 17.2.5.3. SWOT Analysis
- 17.2.5.4. Recent Developments
- 17.2.5.5. Financials (Based on Availability)
- 17.2.6 Lasenor Emul SL
- 17.2.6.1. Overview
- 17.2.6.2. Products
- 17.2.6.3. SWOT Analysis
- 17.2.6.4. Recent Developments
- 17.2.6.5. Financials (Based on Availability)
- 17.2.7 Bunge Limited
- 17.2.7.1. Overview
- 17.2.7.2. Products
- 17.2.7.3. SWOT Analysis
- 17.2.7.4. Recent Developments
- 17.2.7.5. Financials (Based on Availability)
- 17.2.8 Avatar Corporation
- 17.2.8.1. Overview
- 17.2.8.2. Products
- 17.2.8.3. SWOT Analysis
- 17.2.8.4. Recent Developments
- 17.2.8.5. Financials (Based on Availability)
- 17.2.9 Archer-Daniels-Midland Co
- 17.2.9.1. Overview
- 17.2.9.2. Products
- 17.2.9.3. SWOT Analysis
- 17.2.9.4. Recent Developments
- 17.2.9.5. Financials (Based on Availability)
- 17.2.10 Bundy Baking solutions*List Not Exhaustive
- 17.2.10.1. Overview
- 17.2.10.2. Products
- 17.2.10.3. SWOT Analysis
- 17.2.10.4. Recent Developments
- 17.2.10.5. Financials (Based on Availability)
- 17.2.1 IFC Solutions
List of Figures
- Figure 1: Global Food Release Agents Industry Revenue Breakdown (Million, %) by Region 2024 & 2032
- Figure 2: North America Food Release Agents Industry Revenue (Million), by Country 2024 & 2032
- Figure 3: North America Food Release Agents Industry Revenue Share (%), by Country 2024 & 2032
- Figure 4: Europe Food Release Agents Industry Revenue (Million), by Country 2024 & 2032
- Figure 5: Europe Food Release Agents Industry Revenue Share (%), by Country 2024 & 2032
- Figure 6: Asia Pacific Food Release Agents Industry Revenue (Million), by Country 2024 & 2032
- Figure 7: Asia Pacific Food Release Agents Industry Revenue Share (%), by Country 2024 & 2032
- Figure 8: South America Food Release Agents Industry Revenue (Million), by Country 2024 & 2032
- Figure 9: South America Food Release Agents Industry Revenue Share (%), by Country 2024 & 2032
- Figure 10: Middle East & Africa Food Release Agents Industry Revenue (Million), by Country 2024 & 2032
- Figure 11: Middle East & Africa Food Release Agents Industry Revenue Share (%), by Country 2024 & 2032
- Figure 12: North America Food Release Agents Industry Revenue (Million), by Cateogry 2024 & 2032
- Figure 13: North America Food Release Agents Industry Revenue Share (%), by Cateogry 2024 & 2032
- Figure 14: North America Food Release Agents Industry Revenue (Million), by Application 2024 & 2032
- Figure 15: North America Food Release Agents Industry Revenue Share (%), by Application 2024 & 2032
- Figure 16: North America Food Release Agents Industry Revenue (Million), by Country 2024 & 2032
- Figure 17: North America Food Release Agents Industry Revenue Share (%), by Country 2024 & 2032
- Figure 18: Europe Food Release Agents Industry Revenue (Million), by Cateogry 2024 & 2032
- Figure 19: Europe Food Release Agents Industry Revenue Share (%), by Cateogry 2024 & 2032
- Figure 20: Europe Food Release Agents Industry Revenue (Million), by Application 2024 & 2032
- Figure 21: Europe Food Release Agents Industry Revenue Share (%), by Application 2024 & 2032
- Figure 22: Europe Food Release Agents Industry Revenue (Million), by Country 2024 & 2032
- Figure 23: Europe Food Release Agents Industry Revenue Share (%), by Country 2024 & 2032
- Figure 24: Asia Pacific Food Release Agents Industry Revenue (Million), by Cateogry 2024 & 2032
- Figure 25: Asia Pacific Food Release Agents Industry Revenue Share (%), by Cateogry 2024 & 2032
- Figure 26: Asia Pacific Food Release Agents Industry Revenue (Million), by Application 2024 & 2032
- Figure 27: Asia Pacific Food Release Agents Industry Revenue Share (%), by Application 2024 & 2032
- Figure 28: Asia Pacific Food Release Agents Industry Revenue (Million), by Country 2024 & 2032
- Figure 29: Asia Pacific Food Release Agents Industry Revenue Share (%), by Country 2024 & 2032
- Figure 30: South America Food Release Agents Industry Revenue (Million), by Cateogry 2024 & 2032
- Figure 31: South America Food Release Agents Industry Revenue Share (%), by Cateogry 2024 & 2032
- Figure 32: South America Food Release Agents Industry Revenue (Million), by Application 2024 & 2032
- Figure 33: South America Food Release Agents Industry Revenue Share (%), by Application 2024 & 2032
- Figure 34: South America Food Release Agents Industry Revenue (Million), by Country 2024 & 2032
- Figure 35: South America Food Release Agents Industry Revenue Share (%), by Country 2024 & 2032
- Figure 36: Middle East Food Release Agents Industry Revenue (Million), by Cateogry 2024 & 2032
- Figure 37: Middle East Food Release Agents Industry Revenue Share (%), by Cateogry 2024 & 2032
- Figure 38: Middle East Food Release Agents Industry Revenue (Million), by Application 2024 & 2032
- Figure 39: Middle East Food Release Agents Industry Revenue Share (%), by Application 2024 & 2032
- Figure 40: Middle East Food Release Agents Industry Revenue (Million), by Country 2024 & 2032
- Figure 41: Middle East Food Release Agents Industry Revenue Share (%), by Country 2024 & 2032
- Figure 42: South Africa Food Release Agents Industry Revenue (Million), by Cateogry 2024 & 2032
- Figure 43: South Africa Food Release Agents Industry Revenue Share (%), by Cateogry 2024 & 2032
- Figure 44: South Africa Food Release Agents Industry Revenue (Million), by Application 2024 & 2032
- Figure 45: South Africa Food Release Agents Industry Revenue Share (%), by Application 2024 & 2032
- Figure 46: South Africa Food Release Agents Industry Revenue (Million), by Country 2024 & 2032
- Figure 47: South Africa Food Release Agents Industry Revenue Share (%), by Country 2024 & 2032
List of Tables
- Table 1: Global Food Release Agents Industry Revenue Million Forecast, by Region 2019 & 2032
- Table 2: Global Food Release Agents Industry Revenue Million Forecast, by Cateogry 2019 & 2032
- Table 3: Global Food Release Agents Industry Revenue Million Forecast, by Application 2019 & 2032
- Table 4: Global Food Release Agents Industry Revenue Million Forecast, by Region 2019 & 2032
- Table 5: Global Food Release Agents Industry Revenue Million Forecast, by Country 2019 & 2032
- Table 6: United States Food Release Agents Industry Revenue (Million) Forecast, by Application 2019 & 2032
- Table 7: Canada Food Release Agents Industry Revenue (Million) Forecast, by Application 2019 & 2032
- Table 8: Mexico Food Release Agents Industry Revenue (Million) Forecast, by Application 2019 & 2032
- Table 9: Rest of North America Food Release Agents Industry Revenue (Million) Forecast, by Application 2019 & 2032
- Table 10: Global Food Release Agents Industry Revenue Million Forecast, by Country 2019 & 2032
- Table 11: United Kingdom Food Release Agents Industry Revenue (Million) Forecast, by Application 2019 & 2032
- Table 12: Germany Food Release Agents Industry Revenue (Million) Forecast, by Application 2019 & 2032
- Table 13: France Food Release Agents Industry Revenue (Million) Forecast, by Application 2019 & 2032
- Table 14: Russia Food Release Agents Industry Revenue (Million) Forecast, by Application 2019 & 2032
- Table 15: Italy Food Release Agents Industry Revenue (Million) Forecast, by Application 2019 & 2032
- Table 16: Spain Food Release Agents Industry Revenue (Million) Forecast, by Application 2019 & 2032
- Table 17: Rest of Europe Food Release Agents Industry Revenue (Million) Forecast, by Application 2019 & 2032
- Table 18: Global Food Release Agents Industry Revenue Million Forecast, by Country 2019 & 2032
- Table 19: India Food Release Agents Industry Revenue (Million) Forecast, by Application 2019 & 2032
- Table 20: China Food Release Agents Industry Revenue (Million) Forecast, by Application 2019 & 2032
- Table 21: Japan Food Release Agents Industry Revenue (Million) Forecast, by Application 2019 & 2032
- Table 22: Australia Food Release Agents Industry Revenue (Million) Forecast, by Application 2019 & 2032
- Table 23: Rest of Asia Pacific Food Release Agents Industry Revenue (Million) Forecast, by Application 2019 & 2032
- Table 24: Global Food Release Agents Industry Revenue Million Forecast, by Country 2019 & 2032
- Table 25: Brazil Food Release Agents Industry Revenue (Million) Forecast, by Application 2019 & 2032
- Table 26: Argentina Food Release Agents Industry Revenue (Million) Forecast, by Application 2019 & 2032
- Table 27: Rest of South America Food Release Agents Industry Revenue (Million) Forecast, by Application 2019 & 2032
- Table 28: Global Food Release Agents Industry Revenue Million Forecast, by Country 2019 & 2032
- Table 29: UAE Food Release Agents Industry Revenue (Million) Forecast, by Application 2019 & 2032
- Table 30: South Africa Food Release Agents Industry Revenue (Million) Forecast, by Application 2019 & 2032
- Table 31: Saudi Arabia Food Release Agents Industry Revenue (Million) Forecast, by Application 2019 & 2032
- Table 32: Rest of MEA Food Release Agents Industry Revenue (Million) Forecast, by Application 2019 & 2032
- Table 33: Global Food Release Agents Industry Revenue Million Forecast, by Cateogry 2019 & 2032
- Table 34: Global Food Release Agents Industry Revenue Million Forecast, by Application 2019 & 2032
- Table 35: Global Food Release Agents Industry Revenue Million Forecast, by Country 2019 & 2032
- Table 36: United States Food Release Agents Industry Revenue (Million) Forecast, by Application 2019 & 2032
- Table 37: Canada Food Release Agents Industry Revenue (Million) Forecast, by Application 2019 & 2032
- Table 38: Mexico Food Release Agents Industry Revenue (Million) Forecast, by Application 2019 & 2032
- Table 39: Rest of North America Food Release Agents Industry Revenue (Million) Forecast, by Application 2019 & 2032
- Table 40: Global Food Release Agents Industry Revenue Million Forecast, by Cateogry 2019 & 2032
- Table 41: Global Food Release Agents Industry Revenue Million Forecast, by Application 2019 & 2032
- Table 42: Global Food Release Agents Industry Revenue Million Forecast, by Country 2019 & 2032
- Table 43: United Kingdom Food Release Agents Industry Revenue (Million) Forecast, by Application 2019 & 2032
- Table 44: Germany Food Release Agents Industry Revenue (Million) Forecast, by Application 2019 & 2032
- Table 45: France Food Release Agents Industry Revenue (Million) Forecast, by Application 2019 & 2032
- Table 46: Russia Food Release Agents Industry Revenue (Million) Forecast, by Application 2019 & 2032
- Table 47: Italy Food Release Agents Industry Revenue (Million) Forecast, by Application 2019 & 2032
- Table 48: Spain Food Release Agents Industry Revenue (Million) Forecast, by Application 2019 & 2032
- Table 49: Rest of Europe Food Release Agents Industry Revenue (Million) Forecast, by Application 2019 & 2032
- Table 50: Global Food Release Agents Industry Revenue Million Forecast, by Cateogry 2019 & 2032
- Table 51: Global Food Release Agents Industry Revenue Million Forecast, by Application 2019 & 2032
- Table 52: Global Food Release Agents Industry Revenue Million Forecast, by Country 2019 & 2032
- Table 53: India Food Release Agents Industry Revenue (Million) Forecast, by Application 2019 & 2032
- Table 54: China Food Release Agents Industry Revenue (Million) Forecast, by Application 2019 & 2032
- Table 55: Japan Food Release Agents Industry Revenue (Million) Forecast, by Application 2019 & 2032
- Table 56: Australia Food Release Agents Industry Revenue (Million) Forecast, by Application 2019 & 2032
- Table 57: Rest of Asia Pacific Food Release Agents Industry Revenue (Million) Forecast, by Application 2019 & 2032
- Table 58: Global Food Release Agents Industry Revenue Million Forecast, by Cateogry 2019 & 2032
- Table 59: Global Food Release Agents Industry Revenue Million Forecast, by Application 2019 & 2032
- Table 60: Global Food Release Agents Industry Revenue Million Forecast, by Country 2019 & 2032
- Table 61: Brazil Food Release Agents Industry Revenue (Million) Forecast, by Application 2019 & 2032
- Table 62: Argentina Food Release Agents Industry Revenue (Million) Forecast, by Application 2019 & 2032
- Table 63: Rest of South America Food Release Agents Industry Revenue (Million) Forecast, by Application 2019 & 2032
- Table 64: Global Food Release Agents Industry Revenue Million Forecast, by Cateogry 2019 & 2032
- Table 65: Global Food Release Agents Industry Revenue Million Forecast, by Application 2019 & 2032
- Table 66: Global Food Release Agents Industry Revenue Million Forecast, by Country 2019 & 2032
- Table 67: Global Food Release Agents Industry Revenue Million Forecast, by Cateogry 2019 & 2032
- Table 68: Global Food Release Agents Industry Revenue Million Forecast, by Application 2019 & 2032
- Table 69: Global Food Release Agents Industry Revenue Million Forecast, by Country 2019 & 2032
- Table 70: United Arab Emirates Food Release Agents Industry Revenue (Million) Forecast, by Application 2019 & 2032
- Table 71: Rest of Middle East Food Release Agents Industry Revenue (Million) Forecast, by Application 2019 & 2032
Frequently Asked Questions
1. What is the projected Compound Annual Growth Rate (CAGR) of the Food Release Agents Industry?
The projected CAGR is approximately 2.67%.
2. Which companies are prominent players in the Food Release Agents Industry?
Key companies in the market include IFC Solutions, Par-Way Tryson, Dubor Groneweg GmbH & Co KG, Cargill Incorporated, Vantage Specialty Chemicals, Lasenor Emul SL, Bunge Limited, Avatar Corporation, Archer-Daniels-Midland Co, Bundy Baking solutions*List Not Exhaustive.
3. What are the main segments of the Food Release Agents Industry?
The market segments include Cateogry, Application.
4. Can you provide details about the market size?
The market size is estimated to be USD 735.93 Million as of 2022.
5. What are some drivers contributing to market growth?
Health Benefits Promoting Apple Cider Vinegar Demand; Unfiltered Apple Cider Vinegar Being Popular.
6. What are the notable trends driving market growth?
Wide Applications and Functionality.
7. Are there any restraints impacting market growth?
Rising Demand for Other Vinegar Types.
8. Can you provide examples of recent developments in the market?
N/A
9. What pricing options are available for accessing the report?
Pricing options include single-user, multi-user, and enterprise licenses priced at USD 4750, USD 5250, and USD 8750 respectively.
10. Is the market size provided in terms of value or volume?
The market size is provided in terms of value, measured in Million.
11. Are there any specific market keywords associated with the report?
Yes, the market keyword associated with the report is "Food Release Agents Industry," which aids in identifying and referencing the specific market segment covered.
12. How do I determine which pricing option suits my needs best?
The pricing options vary based on user requirements and access needs. Individual users may opt for single-user licenses, while businesses requiring broader access may choose multi-user or enterprise licenses for cost-effective access to the report.
13. Are there any additional resources or data provided in the Food Release Agents Industry report?
While the report offers comprehensive insights, it's advisable to review the specific contents or supplementary materials provided to ascertain if additional resources or data are available.
14. How can I stay updated on further developments or reports in the Food Release Agents Industry?
To stay informed about further developments, trends, and reports in the Food Release Agents Industry, consider subscribing to industry newsletters, following relevant companies and organizations, or regularly checking reputable industry news sources and publications.
Methodology
Step 1 - Identification of Relevant Samples Size from Population Database


Step 2 - Approaches for Defining Global Market Size (Value, Volume* & Price*)

Note*: In applicable scenarios
Step 3 - Data Sources
Primary Research
- Web Analytics
- Survey Reports
- Research Institute
- Latest Research Reports
- Opinion Leaders
Secondary Research
- Annual Reports
- White Paper
- Latest Press Release
- Industry Association
- Paid Database
- Investor Presentations

Step 4 - Data Triangulation
Involves using different sources of information in order to increase the validity of a study
These sources are likely to be stakeholders in a program - participants, other researchers, program staff, other community members, and so on.
Then we put all data in single framework & apply various statistical tools to find out the dynamic on the market.
During the analysis stage, feedback from the stakeholder groups would be compared to determine areas of agreement as well as areas of divergence


