
Key Insights
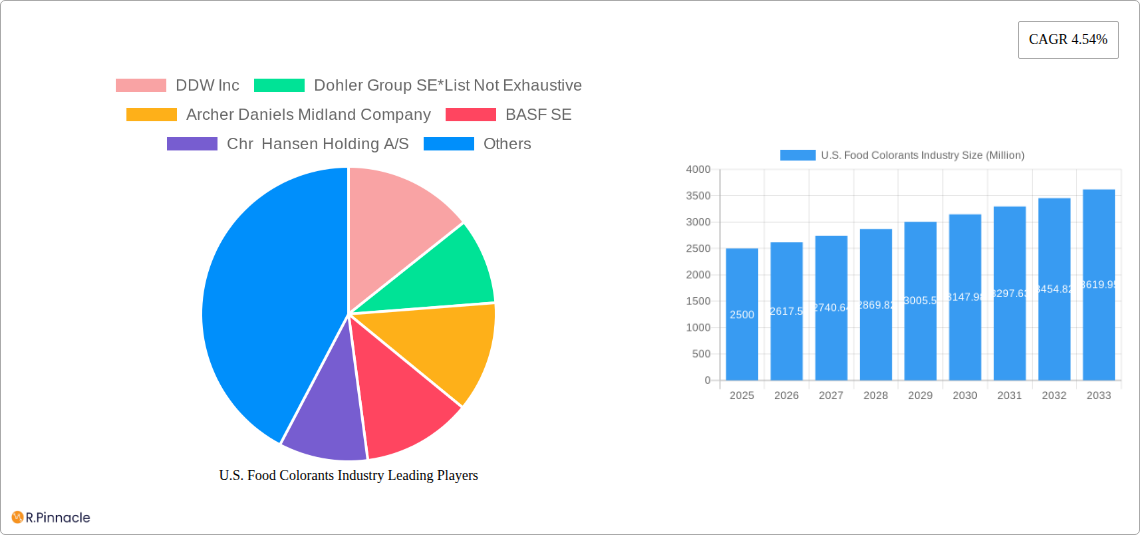
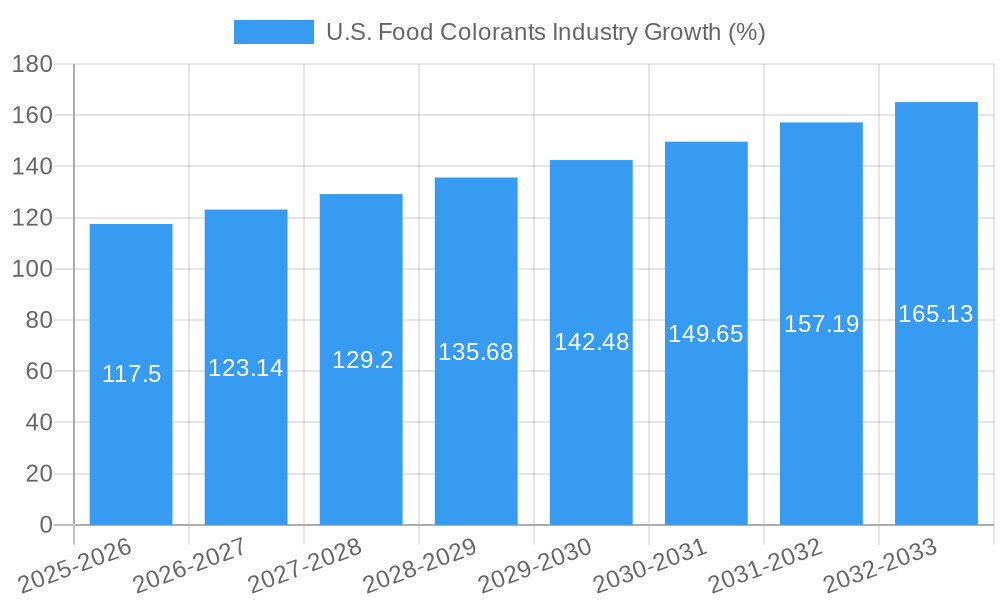
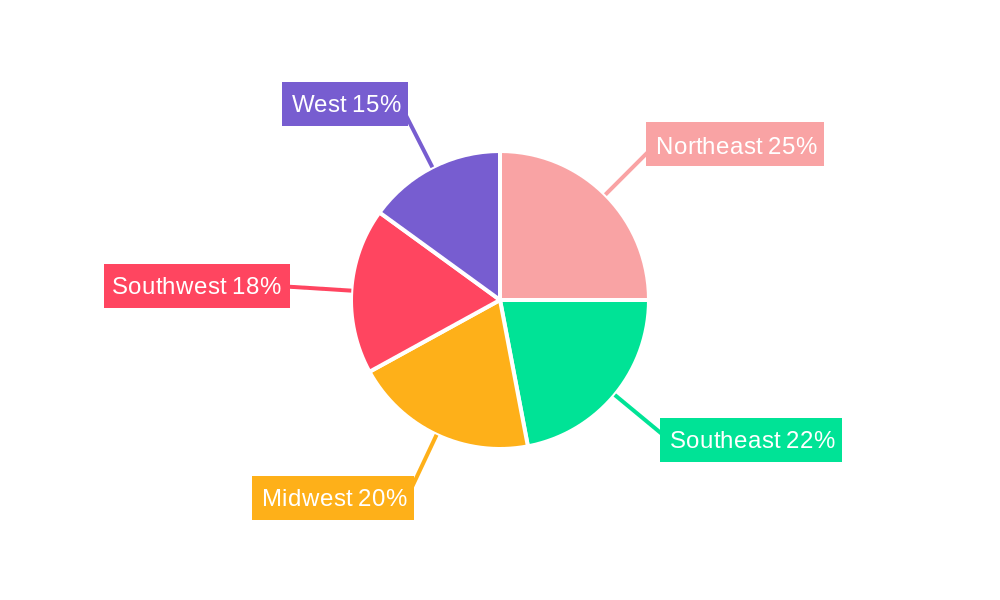
The U.S. food colorants market, valued at approximately $2.5 billion in 2025, is projected to experience robust growth, driven by increasing demand for visually appealing food products across various sectors. A compound annual growth rate (CAGR) of 4.54% from 2025 to 2033 indicates a significant expansion, reaching an estimated value exceeding $3.8 billion by 2033. This growth is fueled by several key factors. The rising popularity of processed foods, convenience foods, and ready-to-eat meals contributes significantly to the market's expansion. Furthermore, the increasing consumer preference for vibrant and aesthetically pleasing food products, particularly within the confectionery and beverage sectors, creates a strong demand for food colorants. Technological advancements in colorant production, leading to improved stability, safety, and natural options, also positively influence market growth. The market is segmented by type (synthetic and natural) and application (beverages, dairy, bakery, meat and poultry, confectionery, and others). While synthetic colorants currently hold a larger market share due to their cost-effectiveness and vibrant colors, the growing consumer preference for natural and clean-label products is driving the expansion of the natural colorants segment. This shift is also influenced by stricter regulations and increased awareness of potential health concerns associated with synthetic colorants. However, the higher cost of natural colorants compared to synthetic counterparts remains a restraining factor. Key players like DDW Inc, Dohler Group SE, Archer Daniels Midland Company, BASF SE, Chr. Hansen Holding A/S, Koninklijke DSM N.V., GNT Group B.V., and Sensient Technologies Corporation are shaping the market landscape through innovation and expansion strategies. Regional analysis reveals strong growth across all U.S. regions, with the Northeast and West potentially exhibiting faster growth due to higher per capita consumption of processed foods.
The competitive landscape of the U.S. food colorants market is characterized by the presence of both large multinational corporations and smaller specialized companies. These companies compete on several factors, including product quality, price, innovation, and customer service. The market is expected to witness increased consolidation and strategic partnerships in the coming years, as companies strive to expand their product portfolios and geographical reach. Furthermore, regulatory changes and evolving consumer preferences regarding food safety and sustainability will continue to shape the market dynamics. The increasing focus on natural and clean-label ingredients will likely drive innovation in the development of new and improved natural colorants, creating opportunities for companies specializing in sustainable and ethically sourced ingredients. Despite the challenges presented by fluctuating raw material prices and stringent regulatory compliance, the long-term outlook for the U.S. food colorants market remains positive, driven by the unwavering demand for visually appealing and convenient food products.
U.S. Food Colorants Industry Report: 2019-2033
This comprehensive report provides an in-depth analysis of the U.S. food colorants industry, offering invaluable insights for industry professionals, investors, and strategists. Covering the period from 2019 to 2033, with a focus on 2025, this report meticulously examines market dynamics, competitive landscapes, and future growth potential. The study incorporates detailed segmentation by type (synthetic and natural) and application (beverages, dairy, bakery, meat and poultry, confectionery, and others), providing a granular understanding of this vital sector.
U.S. Food Colorants Industry Market Structure & Innovation Trends
This section analyzes the competitive landscape of the U.S. food colorants market, encompassing market concentration, innovation drivers, regulatory frameworks, product substitutes, end-user demographics, and mergers & acquisitions (M&A) activities. The report details market share held by key players such as DDW Inc, Dohler Group SE, Archer Daniels Midland Company, BASF SE, Chr. Hansen Holding A/S, Koninklijke DSM N.V., GNT Group B.V., and Sensient Technologies Corporation (list not exhaustive). We examine the impact of M&A activities, estimating a total deal value of approximately xx Million during the historical period (2019-2024), with a focus on the strategic implications for market consolidation and innovation. The report also explores the influence of regulatory frameworks, such as FDA guidelines on permitted color additives, on market structure and innovation. Furthermore, the analysis considers the impact of consumer preferences for natural colorants and the emergence of substitute products, influencing market dynamics and future growth trajectories. The report uses a combination of primary and secondary research to analyze data collected across various sources. The predicted market share of DDW Inc. is estimated to be xx%, while BASF SE holds approximately xx%.
U.S. Food Colorants Industry Market Dynamics & Trends
This section delves into the key factors driving market growth, technological advancements, evolving consumer preferences, and the competitive dynamics within the U.S. food colorants industry. The report provides a detailed analysis of the market's Compound Annual Growth Rate (CAGR) during the historical period (2019-2024) and projects the CAGR for the forecast period (2025-2033). Key drivers, such as the increasing demand for processed foods, the growing popularity of natural and organic food products, and the expanding food and beverage industry, are explored in detail, with specific examples and quantifiable data. Furthermore, the report highlights the influence of technological disruptions, including advancements in colorant production and formulation, on market growth and innovation. The analysis incorporates the impact of consumer preferences, particularly the growing demand for clean-label products, and how this trend is shaping the competitive landscape. Market penetration rates for natural colorants are projected to reach xx% by 2033, reflecting the significant shift in consumer preferences.
Dominant Regions & Segments in U.S. Food Colorants Industry
This section identifies the leading regions and segments within the U.S. food colorants market. The analysis focuses on the dominance of specific regions, analyzing economic factors and infrastructure that contribute to their leading position.
By Type: The report details the market share and growth projections for both synthetic and natural colorants, highlighting the increasing preference for natural options and analyzing the key factors driving this shift. The projected market size for natural colorants in 2033 is estimated at xx Million.
By Application: The report examines the performance of each application segment—Beverages, Dairy, Bakery, Meat and Poultry, Confectionery, and Others—identifying the leading segments and analyzing the key drivers of their growth. The beverages segment is projected to remain the largest application sector, with a market size of xx Million in 2033, driven by the rising demand for ready-to-drink beverages and functional drinks.
U.S. Food Colorants Industry Product Innovations
The U.S. food colorants industry is witnessing significant product development, driven by the demand for clean-label ingredients and the pursuit of enhanced functionalities. Recent innovations include the development of more stable and vibrant natural colorants, along with advanced encapsulation technologies that improve color retention and delivery. These innovations provide competitive advantages, allowing manufacturers to create products with superior quality, extended shelf life, and improved sensory appeal. The trend toward plant-based colorants is also a key driver of innovation, expanding the availability of sustainable and ethically sourced options.
Report Scope & Segmentation Analysis
This report segments the U.S. food colorants market by type (synthetic and natural) and application (beverages, dairy products, bakery goods, meat and poultry products, confectionery, and other applications). Each segment is comprehensively analyzed, including projections for market size and growth, competitive dynamics, and key trends. The synthetic colorants segment is projected to maintain its significant market share, although natural colorants are predicted to experience robust growth driven by changing consumer preferences. Similarly, analysis of the application segments provides detailed insights into their specific growth drivers and challenges. For example, the dairy segment is expected to exhibit steady growth due to increasing demand for colored dairy products like yogurts and ice creams.
Key Drivers of U.S. Food Colorants Industry Growth
The growth of the U.S. food colorants industry is propelled by several key factors. The increasing demand for processed foods, particularly in convenient and ready-to-eat formats, fuels significant consumption of food colorants. Furthermore, the expanding food and beverage industry, with continuous innovation in product development, necessitates the utilization of colorants to enhance product aesthetics and appeal. Government regulations and health concerns are influencing the shift toward natural colorants, further driving industry growth. The adoption of advanced technologies in colorant production and formulation processes also contributes to expansion within the market.
Challenges in the U.S. Food Colorants Industry Sector
The U.S. food colorants industry faces several challenges. Stringent regulatory requirements for food additives can increase production costs and complexity. Supply chain disruptions and volatility in raw material prices pose significant operational challenges, affecting production costs and profitability. Intense competition from both domestic and international players creates pressure on pricing and margins. These factors contribute to a complex and dynamic market environment. The industry also faces hurdles in balancing consumer demand for natural colorants with the cost and performance limitations of some natural options.
Emerging Opportunities in U.S. Food Colorants Industry
The U.S. food colorants industry presents several attractive opportunities. The growing demand for natural and organic colorants creates opportunities for companies to develop and market sustainable, clean-label options. Technological advancements, such as improved extraction and purification techniques for natural colorants, open new avenues for innovation. The rising popularity of functional foods and beverages presents growth potential for colorants with added health benefits. Furthermore, exploring new application areas and expanding into emerging markets can further propel industry growth.
Leading Players in the U.S. Food Colorants Industry Market
- DDW Inc
- Dohler Group SE
- Archer Daniels Midland Company
- BASF SE
- Chr. Hansen Holding A/S
- Koninklijke DSM N.V.
- GNT Group B.V.
- Sensient Technologies Corporation
Key Developments in U.S. Food Colorants Industry
- 2022 Q3: DDW Inc. announced the launch of a new line of natural colorants derived from fruits and vegetables.
- 2023 Q1: BASF SE invested xx Million in expanding its natural colorant production facility.
- 2024 Q2: A significant merger between two smaller players consolidated market share. (Further specific details on mergers and acquisitions are detailed within the full report.)
Future Outlook for U.S. Food Colorants Industry Market
The U.S. food colorants industry is poised for continued growth, driven by sustained demand from the expanding food and beverage sector. The increasing adoption of natural colorants and technological advancements in colorant production will further stimulate market expansion. Strategic acquisitions and partnerships will play a crucial role in shaping the future competitive landscape. The industry's future outlook is positive, with ample opportunities for innovation and growth in the coming years. The market is expected to reach xx Million by 2033, representing substantial growth from the 2025 base year.
U.S. Food Colorants Industry Segmentation
-
1. Type
- 1.1. Synthetic
- 1.2. Natural
-
2. Application
- 2.1. Beverages
- 2.2. Dairy
- 2.3. Bakery
- 2.4. Meat and Poultry
- 2.5. Confectionery
- 2.6. Others
U.S. Food Colorants Industry Segmentation By Geography
- 1. U.S.
U.S. Food Colorants Industry REPORT HIGHLIGHTS
| Aspects | Details |
|---|---|
| Study Period | 2019-2033 |
| Base Year | 2024 |
| Estimated Year | 2025 |
| Forecast Period | 2025-2033 |
| Historical Period | 2019-2024 |
| Growth Rate | CAGR of 4.54% from 2019-2033 |
| Segmentation |
|
Table of Contents
- 1. Introduction
- 1.1. Research Scope
- 1.2. Market Segmentation
- 1.3. Research Methodology
- 1.4. Definitions and Assumptions
- 2. Executive Summary
- 2.1. Introduction
- 3. Market Dynamics
- 3.1. Introduction
- 3.2. Market Drivers
- 3.2.1. Rising Health Consciousness among consumer
- 3.3. Market Restrains
- 3.3.1. High Cost of natural Ingredients
- 3.4. Market Trends
- 3.4.1. Natural Colorants Dominate the Market
- 4. Market Factor Analysis
- 4.1. Porters Five Forces
- 4.2. Supply/Value Chain
- 4.3. PESTEL analysis
- 4.4. Market Entropy
- 4.5. Patent/Trademark Analysis
- 5. U.S. Food Colorants Industry Analysis, Insights and Forecast, 2019-2031
- 5.1. Market Analysis, Insights and Forecast - by Type
- 5.1.1. Synthetic
- 5.1.2. Natural
- 5.2. Market Analysis, Insights and Forecast - by Application
- 5.2.1. Beverages
- 5.2.2. Dairy
- 5.2.3. Bakery
- 5.2.4. Meat and Poultry
- 5.2.5. Confectionery
- 5.2.6. Others
- 5.3. Market Analysis, Insights and Forecast - by Region
- 5.3.1. U.S.
- 5.1. Market Analysis, Insights and Forecast - by Type
- 6. Northeast U.S. Food Colorants Industry Analysis, Insights and Forecast, 2019-2031
- 7. Southeast U.S. Food Colorants Industry Analysis, Insights and Forecast, 2019-2031
- 8. Midwest U.S. Food Colorants Industry Analysis, Insights and Forecast, 2019-2031
- 9. Southwest U.S. Food Colorants Industry Analysis, Insights and Forecast, 2019-2031
- 10. West U.S. Food Colorants Industry Analysis, Insights and Forecast, 2019-2031
- 11. Competitive Analysis
- 11.1. Market Share Analysis 2024
- 11.2. Company Profiles
- 11.2.1 DDW Inc
- 11.2.1.1. Overview
- 11.2.1.2. Products
- 11.2.1.3. SWOT Analysis
- 11.2.1.4. Recent Developments
- 11.2.1.5. Financials (Based on Availability)
- 11.2.2 Dohler Group SE*List Not Exhaustive
- 11.2.2.1. Overview
- 11.2.2.2. Products
- 11.2.2.3. SWOT Analysis
- 11.2.2.4. Recent Developments
- 11.2.2.5. Financials (Based on Availability)
- 11.2.3 Archer Daniels Midland Company
- 11.2.3.1. Overview
- 11.2.3.2. Products
- 11.2.3.3. SWOT Analysis
- 11.2.3.4. Recent Developments
- 11.2.3.5. Financials (Based on Availability)
- 11.2.4 BASF SE
- 11.2.4.1. Overview
- 11.2.4.2. Products
- 11.2.4.3. SWOT Analysis
- 11.2.4.4. Recent Developments
- 11.2.4.5. Financials (Based on Availability)
- 11.2.5 Chr Hansen Holding A/S
- 11.2.5.1. Overview
- 11.2.5.2. Products
- 11.2.5.3. SWOT Analysis
- 11.2.5.4. Recent Developments
- 11.2.5.5. Financials (Based on Availability)
- 11.2.6 Koninklijke DSM N V
- 11.2.6.1. Overview
- 11.2.6.2. Products
- 11.2.6.3. SWOT Analysis
- 11.2.6.4. Recent Developments
- 11.2.6.5. Financials (Based on Availability)
- 11.2.7 GNT Group B V
- 11.2.7.1. Overview
- 11.2.7.2. Products
- 11.2.7.3. SWOT Analysis
- 11.2.7.4. Recent Developments
- 11.2.7.5. Financials (Based on Availability)
- 11.2.8 Sensient Technologies Corporation
- 11.2.8.1. Overview
- 11.2.8.2. Products
- 11.2.8.3. SWOT Analysis
- 11.2.8.4. Recent Developments
- 11.2.8.5. Financials (Based on Availability)
- 11.2.1 DDW Inc
List of Figures
- Figure 1: U.S. Food Colorants Industry Revenue Breakdown (Million, %) by Product 2024 & 2032
- Figure 2: U.S. Food Colorants Industry Share (%) by Company 2024
List of Tables
- Table 1: U.S. Food Colorants Industry Revenue Million Forecast, by Region 2019 & 2032
- Table 2: U.S. Food Colorants Industry Revenue Million Forecast, by Type 2019 & 2032
- Table 3: U.S. Food Colorants Industry Revenue Million Forecast, by Application 2019 & 2032
- Table 4: U.S. Food Colorants Industry Revenue Million Forecast, by Region 2019 & 2032
- Table 5: U.S. Food Colorants Industry Revenue Million Forecast, by Country 2019 & 2032
- Table 6: Northeast U.S. Food Colorants Industry Revenue (Million) Forecast, by Application 2019 & 2032
- Table 7: Southeast U.S. Food Colorants Industry Revenue (Million) Forecast, by Application 2019 & 2032
- Table 8: Midwest U.S. Food Colorants Industry Revenue (Million) Forecast, by Application 2019 & 2032
- Table 9: Southwest U.S. Food Colorants Industry Revenue (Million) Forecast, by Application 2019 & 2032
- Table 10: West U.S. Food Colorants Industry Revenue (Million) Forecast, by Application 2019 & 2032
- Table 11: U.S. Food Colorants Industry Revenue Million Forecast, by Type 2019 & 2032
- Table 12: U.S. Food Colorants Industry Revenue Million Forecast, by Application 2019 & 2032
- Table 13: U.S. Food Colorants Industry Revenue Million Forecast, by Country 2019 & 2032
Frequently Asked Questions
1. What is the projected Compound Annual Growth Rate (CAGR) of the U.S. Food Colorants Industry?
The projected CAGR is approximately 4.54%.
2. Which companies are prominent players in the U.S. Food Colorants Industry?
Key companies in the market include DDW Inc, Dohler Group SE*List Not Exhaustive, Archer Daniels Midland Company, BASF SE, Chr Hansen Holding A/S, Koninklijke DSM N V, GNT Group B V, Sensient Technologies Corporation.
3. What are the main segments of the U.S. Food Colorants Industry?
The market segments include Type, Application.
4. Can you provide details about the market size?
The market size is estimated to be USD XX Million as of 2022.
5. What are some drivers contributing to market growth?
Rising Health Consciousness among consumer.
6. What are the notable trends driving market growth?
Natural Colorants Dominate the Market.
7. Are there any restraints impacting market growth?
High Cost of natural Ingredients.
8. Can you provide examples of recent developments in the market?
N/A
9. What pricing options are available for accessing the report?
Pricing options include single-user, multi-user, and enterprise licenses priced at USD 3800, USD 4500, and USD 5800 respectively.
10. Is the market size provided in terms of value or volume?
The market size is provided in terms of value, measured in Million.
11. Are there any specific market keywords associated with the report?
Yes, the market keyword associated with the report is "U.S. Food Colorants Industry," which aids in identifying and referencing the specific market segment covered.
12. How do I determine which pricing option suits my needs best?
The pricing options vary based on user requirements and access needs. Individual users may opt for single-user licenses, while businesses requiring broader access may choose multi-user or enterprise licenses for cost-effective access to the report.
13. Are there any additional resources or data provided in the U.S. Food Colorants Industry report?
While the report offers comprehensive insights, it's advisable to review the specific contents or supplementary materials provided to ascertain if additional resources or data are available.
14. How can I stay updated on further developments or reports in the U.S. Food Colorants Industry?
To stay informed about further developments, trends, and reports in the U.S. Food Colorants Industry, consider subscribing to industry newsletters, following relevant companies and organizations, or regularly checking reputable industry news sources and publications.
Methodology
Step 1 - Identification of Relevant Samples Size from Population Database


Step 2 - Approaches for Defining Global Market Size (Value, Volume* & Price*)

Note*: In applicable scenarios
Step 3 - Data Sources
Primary Research
- Web Analytics
- Survey Reports
- Research Institute
- Latest Research Reports
- Opinion Leaders
Secondary Research
- Annual Reports
- White Paper
- Latest Press Release
- Industry Association
- Paid Database
- Investor Presentations

Step 4 - Data Triangulation
Involves using different sources of information in order to increase the validity of a study
These sources are likely to be stakeholders in a program - participants, other researchers, program staff, other community members, and so on.
Then we put all data in single framework & apply various statistical tools to find out the dynamic on the market.
During the analysis stage, feedback from the stakeholder groups would be compared to determine areas of agreement as well as areas of divergence


