
Key Insights
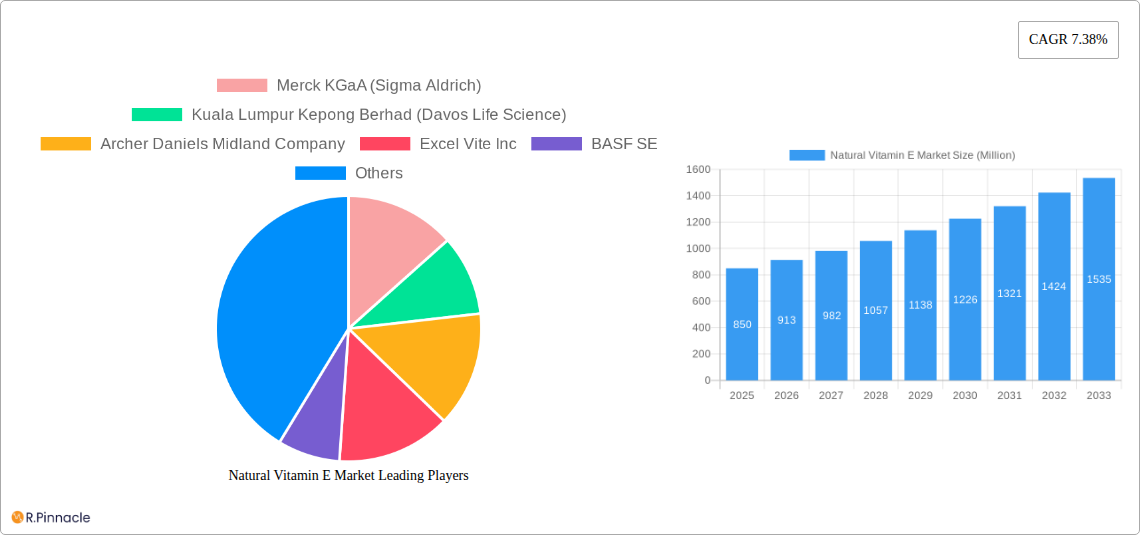
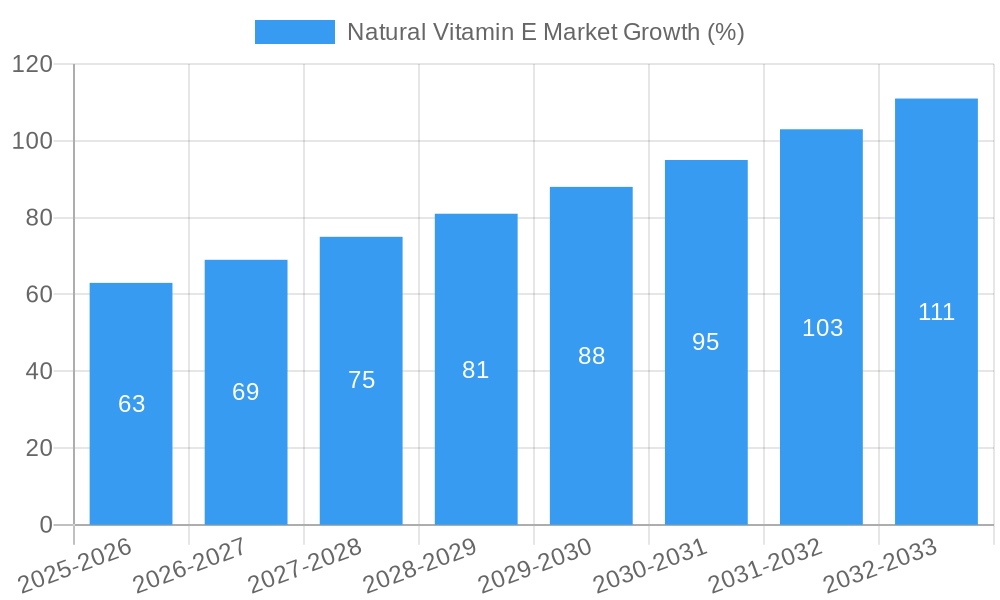
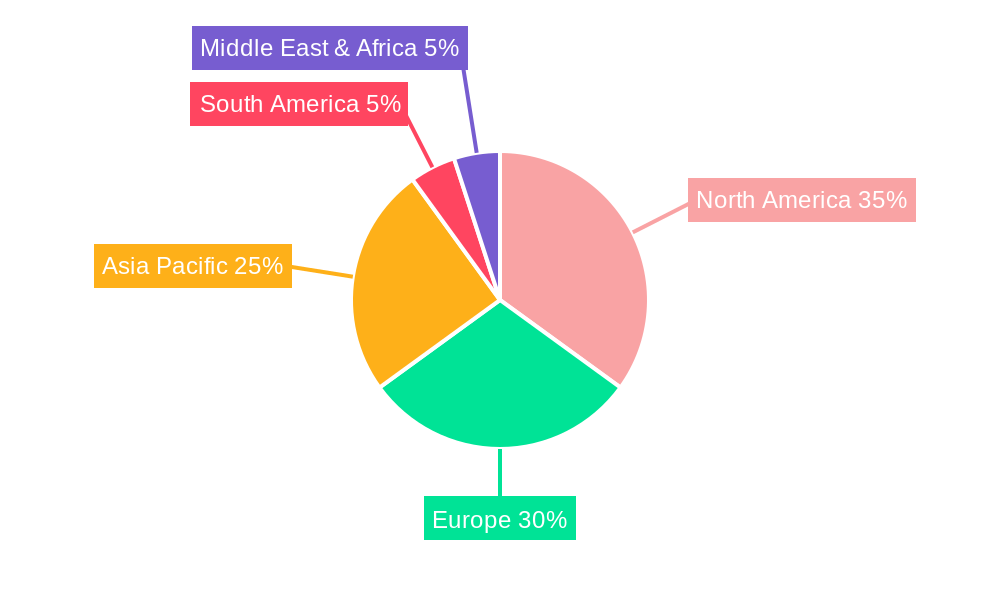
The global natural Vitamin E market, valued at approximately $850 million in 2025, is projected to experience robust growth, exhibiting a Compound Annual Growth Rate (CAGR) of 7.38% from 2025 to 2033. This expansion is driven by several key factors. The increasing consumer awareness regarding the health benefits of natural vitamins, coupled with a growing preference for clean-label products, is significantly boosting demand. The versatility of natural Vitamin E, finding applications in dietary supplements, fortified foods and beverages, cosmetics, and pharmaceuticals, further fuels market growth. The rising prevalence of chronic diseases and the consequent increase in demand for preventive healthcare solutions are also contributing to the market's expansion. Furthermore, the growing animal feed industry, increasingly incorporating natural Vitamin E for improved animal health and productivity, presents a significant opportunity for market expansion. The dominance of North America and Europe in the market is anticipated to continue, although Asia Pacific is projected to show considerable growth due to increasing disposable incomes and rising health consciousness within rapidly developing economies.
Despite these positive trends, certain challenges exist. Fluctuations in raw material prices, particularly those of palm oil—a significant source of natural Vitamin E—can impact profitability. Furthermore, stringent regulatory requirements concerning the production and labeling of natural Vitamin E can create hurdles for manufacturers. However, the overall market outlook remains optimistic, with continued innovation in product development and expansion into new application areas anticipated to drive sustained growth throughout the forecast period. Major players are likely to focus on strategic partnerships and acquisitions to strengthen their market positions and expand their product portfolios, contributing further to this positive trajectory.
Natural Vitamin E Market Report: 2019-2033
This comprehensive report provides a detailed analysis of the Natural Vitamin E market, offering invaluable insights for industry professionals, investors, and stakeholders. Covering the period from 2019 to 2033, with a focus on 2025, this report unveils market dynamics, competitive landscapes, and future growth projections. The report incorporates data on key players, segment analysis, and recent industry developments, offering actionable intelligence to navigate this thriving market. Expected market size in Million is predicted as xx Million for 2025.
Natural Vitamin E Market Structure & Innovation Trends
This section analyzes the market's competitive landscape, highlighting key players and their market shares. We examine innovation drivers, regulatory influences, and the impact of mergers and acquisitions (M&A) on market structure. The report includes a detailed assessment of product substitutes and end-user demographics to provide a comprehensive understanding of the market's evolution.
- Market Concentration: The market is characterized by a combination of large multinational corporations and specialized manufacturers. Market share data for key players will be presented in the full report.
- Innovation Drivers: Growing consumer demand for natural and organic products, coupled with advancements in extraction and purification technologies, are driving innovation.
- Regulatory Framework: Regulatory compliance concerning food safety and labeling significantly impacts market dynamics.
- Product Substitutes: Synthetic vitamin E remains a significant competitor, although consumer preference for natural alternatives is growing.
- M&A Activities: The report details recent M&A activities, including deal values, and their impact on market consolidation (e.g., the Kensing LLC acquisition of Vitae Naturals). An analysis of the strategic rationale behind these deals is included.
- End-user Demographics: The report analyzes the demographics of various end-user segments, including their purchasing behaviors and preferences.
Natural Vitamin E Market Dynamics & Trends
This section delves into the key factors driving market growth, including technological advancements, evolving consumer preferences, and competitive pressures. We explore market penetration rates and compound annual growth rates (CAGR) for various segments to project future market trends. The projected CAGR for the forecast period (2025-2033) is estimated at xx%.
(Paragraph detailing market growth drivers, technological disruptions, consumer preferences, and competitive dynamics with specific examples and metrics like CAGR and market penetration will be included in the full report.)
Dominant Regions & Segments in Natural Vitamin E Market
This section identifies the leading regions and segments within the Natural Vitamin E market. We provide a detailed analysis of the factors contributing to their dominance, along with growth projections for each segment.
- Product Type:
- Tocopherols: This segment is expected to hold the largest market share due to its wide range of applications and established market presence.
- Tocotrienols: This segment is anticipated to experience significant growth due to increasing awareness of its health benefits.
- Application:
- Dietary Supplements: This application segment is a major driver of market growth, fueled by the increasing health consciousness of consumers.
- Fortified/Functional Food and Beverage: This segment is expected to show substantial growth due to rising demand for nutrient-enriched products.
- Beauty and Personal Care Products: This segment represents a significant market opportunity due to the growing popularity of natural and organic beauty products.
- Pharmaceuticals: This segment exhibits moderate growth, driven by the use of vitamin E in various pharmaceutical formulations.
- Animal Feed: This segment demonstrates consistent growth, driven by the incorporation of vitamin E as a feed additive to improve animal health.
(Detailed dominance analysis, including key drivers for each leading region and segment, will be provided in the full report.)
Natural Vitamin E Market Product Innovations
(Paragraph summarizing recent product developments, focusing on technological trends, competitive advantages, and market fit will be included in the full report.)
Report Scope & Segmentation Analysis
This report provides a comprehensive segmentation analysis of the Natural Vitamin E market based on product type (Tocopherols, Tocotrienols) and application (Dietary Supplements, Fortified/Functional Food and Beverage, Beauty and Personal Care Products, Pharmaceuticals, Animal Feed). The report includes detailed market size estimations, growth projections, and competitive dynamics for each segment, providing a clear understanding of the market's diverse components.
(Detailed paragraph per segment with growth projections, market sizes, and competitive dynamics will be included in the full report.)
Key Drivers of Natural Vitamin E Market Growth
(Paragraph outlining key technological, economic, and regulatory factors driving market growth will be included in the full report.)
Challenges in the Natural Vitamin E Market Sector
(Paragraph or list addressing regulatory hurdles, supply chain issues, and competitive pressures, with quantifiable impacts, will be included in the full report.)
Emerging Opportunities in Natural Vitamin E Market
(Paragraph or list highlighting emerging trends and opportunities, focusing on new markets, technologies, or consumer preferences, will be included in the full report.)
Leading Players in the Natural Vitamin E Market Market
- Merck KGaA (Sigma Aldrich) [Merck KGaA]
- Kuala Lumpur Kepong Berhad (Davos Life Science) [Kuala Lumpur Kepong Berhad]
- Archer Daniels Midland Company [Archer Daniels Midland Company]
- Excel Vite Inc
- BASF SE [BASF SE]
- Brenntag AG [Brenntag AG]
- Orah Nutrichem Pvt Ltd
- One Rock Capital Partners LLC (Kensing LLC)
- Parachem Fine & Specialty Chemicals
- Koninklijke Dsm N V [Koninklijke Dsm N V]
Key Developments in Natural Vitamin E Market Industry
- June 2022: Kensing LLC acquired Vitae Naturals, expanding its presence in natural vitamin E and plant sterols.
- February 2022: Orah Nutrichem Pvt Ltd launched ORAH Vit E, a tocotrienol-based antioxidant, targeting the cosmetic and health markets.
- December 2021: Kensing partnered with Azelis to enhance distribution of its products in Europe, the Middle East, and Africa.
- June 2021: One Rock Capital acquired BASF's specialty chemical facility, aiming to increase production of natural vitamin E and other specialty chemicals.
Future Outlook for Natural Vitamin E Market Market
(Paragraph summarizing growth accelerators, future market potential, and strategic opportunities will be included in the full report.)
Natural Vitamin E Market Segmentation
-
1. Product Type
- 1.1. Tocopherols
- 1.2. Tocotrienols
-
2. Application
- 2.1. Dietary Supplements
- 2.2. Fortified/Functional Food and Beverage
- 2.3. Beauty and Personal Care Products
- 2.4. Pharmaceuticals
- 2.5. Animal Feed
Natural Vitamin E Market Segmentation By Geography
-
1. North America
- 1.1. United States
- 1.2. Canada
- 1.3. Mexico
- 1.4. Rest of North America
-
2. Europe
- 2.1. Spain
- 2.2. United Kingdom
- 2.3. Germany
- 2.4. France
- 2.5. Italy
- 2.6. Rest of Europe
-
3. Asia Pacific
- 3.1. China
- 3.2. Japan
- 3.3. India
- 3.4. Australia
- 3.5. Rest of Asia Pacific
-
4. South America
- 4.1. Brazil
- 4.2. Argentina
- 4.3. Rest of South America
-
5. Middle East and Africa
- 5.1. Saudi Arabia
- 5.2. South Africa
- 5.3. Rest of Middle East and Africa
Natural Vitamin E Market REPORT HIGHLIGHTS
| Aspects | Details |
|---|---|
| Study Period | 2019-2033 |
| Base Year | 2024 |
| Estimated Year | 2025 |
| Forecast Period | 2025-2033 |
| Historical Period | 2019-2024 |
| Growth Rate | CAGR of 7.38% from 2019-2033 |
| Segmentation |
|
Table of Contents
- 1. Introduction
- 1.1. Research Scope
- 1.2. Market Segmentation
- 1.3. Research Methodology
- 1.4. Definitions and Assumptions
- 2. Executive Summary
- 2.1. Introduction
- 3. Market Dynamics
- 3.1. Introduction
- 3.2. Market Drivers
- 3.2.1. Awareness of Health Benefits Associated with Tocotrienol; Escalating Demand for Anti-Aging Products Containing Tocotrienol
- 3.3. Market Restrains
- 3.3.1. Availability of Substitutes
- 3.4. Market Trends
- 3.4.1. Substantial Growth of Global Health and Wellness Industry
- 4. Market Factor Analysis
- 4.1. Porters Five Forces
- 4.2. Supply/Value Chain
- 4.3. PESTEL analysis
- 4.4. Market Entropy
- 4.5. Patent/Trademark Analysis
- 5. Global Natural Vitamin E Market Analysis, Insights and Forecast, 2019-2031
- 5.1. Market Analysis, Insights and Forecast - by Product Type
- 5.1.1. Tocopherols
- 5.1.2. Tocotrienols
- 5.2. Market Analysis, Insights and Forecast - by Application
- 5.2.1. Dietary Supplements
- 5.2.2. Fortified/Functional Food and Beverage
- 5.2.3. Beauty and Personal Care Products
- 5.2.4. Pharmaceuticals
- 5.2.5. Animal Feed
- 5.3. Market Analysis, Insights and Forecast - by Region
- 5.3.1. North America
- 5.3.2. Europe
- 5.3.3. Asia Pacific
- 5.3.4. South America
- 5.3.5. Middle East and Africa
- 5.1. Market Analysis, Insights and Forecast - by Product Type
- 6. North America Natural Vitamin E Market Analysis, Insights and Forecast, 2019-2031
- 6.1. Market Analysis, Insights and Forecast - by Product Type
- 6.1.1. Tocopherols
- 6.1.2. Tocotrienols
- 6.2. Market Analysis, Insights and Forecast - by Application
- 6.2.1. Dietary Supplements
- 6.2.2. Fortified/Functional Food and Beverage
- 6.2.3. Beauty and Personal Care Products
- 6.2.4. Pharmaceuticals
- 6.2.5. Animal Feed
- 6.1. Market Analysis, Insights and Forecast - by Product Type
- 7. Europe Natural Vitamin E Market Analysis, Insights and Forecast, 2019-2031
- 7.1. Market Analysis, Insights and Forecast - by Product Type
- 7.1.1. Tocopherols
- 7.1.2. Tocotrienols
- 7.2. Market Analysis, Insights and Forecast - by Application
- 7.2.1. Dietary Supplements
- 7.2.2. Fortified/Functional Food and Beverage
- 7.2.3. Beauty and Personal Care Products
- 7.2.4. Pharmaceuticals
- 7.2.5. Animal Feed
- 7.1. Market Analysis, Insights and Forecast - by Product Type
- 8. Asia Pacific Natural Vitamin E Market Analysis, Insights and Forecast, 2019-2031
- 8.1. Market Analysis, Insights and Forecast - by Product Type
- 8.1.1. Tocopherols
- 8.1.2. Tocotrienols
- 8.2. Market Analysis, Insights and Forecast - by Application
- 8.2.1. Dietary Supplements
- 8.2.2. Fortified/Functional Food and Beverage
- 8.2.3. Beauty and Personal Care Products
- 8.2.4. Pharmaceuticals
- 8.2.5. Animal Feed
- 8.1. Market Analysis, Insights and Forecast - by Product Type
- 9. South America Natural Vitamin E Market Analysis, Insights and Forecast, 2019-2031
- 9.1. Market Analysis, Insights and Forecast - by Product Type
- 9.1.1. Tocopherols
- 9.1.2. Tocotrienols
- 9.2. Market Analysis, Insights and Forecast - by Application
- 9.2.1. Dietary Supplements
- 9.2.2. Fortified/Functional Food and Beverage
- 9.2.3. Beauty and Personal Care Products
- 9.2.4. Pharmaceuticals
- 9.2.5. Animal Feed
- 9.1. Market Analysis, Insights and Forecast - by Product Type
- 10. Middle East and Africa Natural Vitamin E Market Analysis, Insights and Forecast, 2019-2031
- 10.1. Market Analysis, Insights and Forecast - by Product Type
- 10.1.1. Tocopherols
- 10.1.2. Tocotrienols
- 10.2. Market Analysis, Insights and Forecast - by Application
- 10.2.1. Dietary Supplements
- 10.2.2. Fortified/Functional Food and Beverage
- 10.2.3. Beauty and Personal Care Products
- 10.2.4. Pharmaceuticals
- 10.2.5. Animal Feed
- 10.1. Market Analysis, Insights and Forecast - by Product Type
- 11. North America Natural Vitamin E Market Analysis, Insights and Forecast, 2019-2031
- 11.1. Market Analysis, Insights and Forecast - By Country/Sub-region
- 11.1.1 United States
- 11.1.2 Canada
- 11.1.3 Mexico
- 11.1.4 Rest of North America
- 12. Europe Natural Vitamin E Market Analysis, Insights and Forecast, 2019-2031
- 12.1. Market Analysis, Insights and Forecast - By Country/Sub-region
- 12.1.1 Spain
- 12.1.2 United Kingdom
- 12.1.3 Germany
- 12.1.4 France
- 12.1.5 Italy
- 12.1.6 Rest of Europe
- 13. Asia Pacific Natural Vitamin E Market Analysis, Insights and Forecast, 2019-2031
- 13.1. Market Analysis, Insights and Forecast - By Country/Sub-region
- 13.1.1 China
- 13.1.2 Japan
- 13.1.3 India
- 13.1.4 Australia
- 13.1.5 Rest of Asia Pacific
- 14. South America Natural Vitamin E Market Analysis, Insights and Forecast, 2019-2031
- 14.1. Market Analysis, Insights and Forecast - By Country/Sub-region
- 14.1.1 Brazil
- 14.1.2 Argentina
- 14.1.3 Rest of South America
- 15. Middle East & Africa Natural Vitamin E Market Analysis, Insights and Forecast, 2019-2031
- 15.1. Market Analysis, Insights and Forecast - By Country/Sub-region
- 15.1.1 UAE
- 15.1.2 South Africa
- 15.1.3 Saudi Arabia
- 15.1.4 Rest of MEA
- 16. Competitive Analysis
- 16.1. Global Market Share Analysis 2024
- 16.2. Company Profiles
- 16.2.1 Merck KGaA (Sigma Aldrich)
- 16.2.1.1. Overview
- 16.2.1.2. Products
- 16.2.1.3. SWOT Analysis
- 16.2.1.4. Recent Developments
- 16.2.1.5. Financials (Based on Availability)
- 16.2.2 Kuala Lumpur Kepong Berhad (Davos Life Science)
- 16.2.2.1. Overview
- 16.2.2.2. Products
- 16.2.2.3. SWOT Analysis
- 16.2.2.4. Recent Developments
- 16.2.2.5. Financials (Based on Availability)
- 16.2.3 Archer Daniels Midland Company
- 16.2.3.1. Overview
- 16.2.3.2. Products
- 16.2.3.3. SWOT Analysis
- 16.2.3.4. Recent Developments
- 16.2.3.5. Financials (Based on Availability)
- 16.2.4 Excel Vite Inc
- 16.2.4.1. Overview
- 16.2.4.2. Products
- 16.2.4.3. SWOT Analysis
- 16.2.4.4. Recent Developments
- 16.2.4.5. Financials (Based on Availability)
- 16.2.5 BASF SE
- 16.2.5.1. Overview
- 16.2.5.2. Products
- 16.2.5.3. SWOT Analysis
- 16.2.5.4. Recent Developments
- 16.2.5.5. Financials (Based on Availability)
- 16.2.6 Brenntag AG
- 16.2.6.1. Overview
- 16.2.6.2. Products
- 16.2.6.3. SWOT Analysis
- 16.2.6.4. Recent Developments
- 16.2.6.5. Financials (Based on Availability)
- 16.2.7 Orah Nutrichem Pvt Ltd
- 16.2.7.1. Overview
- 16.2.7.2. Products
- 16.2.7.3. SWOT Analysis
- 16.2.7.4. Recent Developments
- 16.2.7.5. Financials (Based on Availability)
- 16.2.8 One Rock Capital Partners LLC (Kensing LLC)*List Not Exhaustive
- 16.2.8.1. Overview
- 16.2.8.2. Products
- 16.2.8.3. SWOT Analysis
- 16.2.8.4. Recent Developments
- 16.2.8.5. Financials (Based on Availability)
- 16.2.9 Parachem Fine & Specialty Chemicals
- 16.2.9.1. Overview
- 16.2.9.2. Products
- 16.2.9.3. SWOT Analysis
- 16.2.9.4. Recent Developments
- 16.2.9.5. Financials (Based on Availability)
- 16.2.10 Koninklijke Dsm N V
- 16.2.10.1. Overview
- 16.2.10.2. Products
- 16.2.10.3. SWOT Analysis
- 16.2.10.4. Recent Developments
- 16.2.10.5. Financials (Based on Availability)
- 16.2.1 Merck KGaA (Sigma Aldrich)
List of Figures
- Figure 1: Global Natural Vitamin E Market Revenue Breakdown (Million, %) by Region 2024 & 2032
- Figure 2: North America Natural Vitamin E Market Revenue (Million), by Country 2024 & 2032
- Figure 3: North America Natural Vitamin E Market Revenue Share (%), by Country 2024 & 2032
- Figure 4: Europe Natural Vitamin E Market Revenue (Million), by Country 2024 & 2032
- Figure 5: Europe Natural Vitamin E Market Revenue Share (%), by Country 2024 & 2032
- Figure 6: Asia Pacific Natural Vitamin E Market Revenue (Million), by Country 2024 & 2032
- Figure 7: Asia Pacific Natural Vitamin E Market Revenue Share (%), by Country 2024 & 2032
- Figure 8: South America Natural Vitamin E Market Revenue (Million), by Country 2024 & 2032
- Figure 9: South America Natural Vitamin E Market Revenue Share (%), by Country 2024 & 2032
- Figure 10: Middle East & Africa Natural Vitamin E Market Revenue (Million), by Country 2024 & 2032
- Figure 11: Middle East & Africa Natural Vitamin E Market Revenue Share (%), by Country 2024 & 2032
- Figure 12: North America Natural Vitamin E Market Revenue (Million), by Product Type 2024 & 2032
- Figure 13: North America Natural Vitamin E Market Revenue Share (%), by Product Type 2024 & 2032
- Figure 14: North America Natural Vitamin E Market Revenue (Million), by Application 2024 & 2032
- Figure 15: North America Natural Vitamin E Market Revenue Share (%), by Application 2024 & 2032
- Figure 16: North America Natural Vitamin E Market Revenue (Million), by Country 2024 & 2032
- Figure 17: North America Natural Vitamin E Market Revenue Share (%), by Country 2024 & 2032
- Figure 18: Europe Natural Vitamin E Market Revenue (Million), by Product Type 2024 & 2032
- Figure 19: Europe Natural Vitamin E Market Revenue Share (%), by Product Type 2024 & 2032
- Figure 20: Europe Natural Vitamin E Market Revenue (Million), by Application 2024 & 2032
- Figure 21: Europe Natural Vitamin E Market Revenue Share (%), by Application 2024 & 2032
- Figure 22: Europe Natural Vitamin E Market Revenue (Million), by Country 2024 & 2032
- Figure 23: Europe Natural Vitamin E Market Revenue Share (%), by Country 2024 & 2032
- Figure 24: Asia Pacific Natural Vitamin E Market Revenue (Million), by Product Type 2024 & 2032
- Figure 25: Asia Pacific Natural Vitamin E Market Revenue Share (%), by Product Type 2024 & 2032
- Figure 26: Asia Pacific Natural Vitamin E Market Revenue (Million), by Application 2024 & 2032
- Figure 27: Asia Pacific Natural Vitamin E Market Revenue Share (%), by Application 2024 & 2032
- Figure 28: Asia Pacific Natural Vitamin E Market Revenue (Million), by Country 2024 & 2032
- Figure 29: Asia Pacific Natural Vitamin E Market Revenue Share (%), by Country 2024 & 2032
- Figure 30: South America Natural Vitamin E Market Revenue (Million), by Product Type 2024 & 2032
- Figure 31: South America Natural Vitamin E Market Revenue Share (%), by Product Type 2024 & 2032
- Figure 32: South America Natural Vitamin E Market Revenue (Million), by Application 2024 & 2032
- Figure 33: South America Natural Vitamin E Market Revenue Share (%), by Application 2024 & 2032
- Figure 34: South America Natural Vitamin E Market Revenue (Million), by Country 2024 & 2032
- Figure 35: South America Natural Vitamin E Market Revenue Share (%), by Country 2024 & 2032
- Figure 36: Middle East and Africa Natural Vitamin E Market Revenue (Million), by Product Type 2024 & 2032
- Figure 37: Middle East and Africa Natural Vitamin E Market Revenue Share (%), by Product Type 2024 & 2032
- Figure 38: Middle East and Africa Natural Vitamin E Market Revenue (Million), by Application 2024 & 2032
- Figure 39: Middle East and Africa Natural Vitamin E Market Revenue Share (%), by Application 2024 & 2032
- Figure 40: Middle East and Africa Natural Vitamin E Market Revenue (Million), by Country 2024 & 2032
- Figure 41: Middle East and Africa Natural Vitamin E Market Revenue Share (%), by Country 2024 & 2032
List of Tables
- Table 1: Global Natural Vitamin E Market Revenue Million Forecast, by Region 2019 & 2032
- Table 2: Global Natural Vitamin E Market Revenue Million Forecast, by Product Type 2019 & 2032
- Table 3: Global Natural Vitamin E Market Revenue Million Forecast, by Application 2019 & 2032
- Table 4: Global Natural Vitamin E Market Revenue Million Forecast, by Region 2019 & 2032
- Table 5: Global Natural Vitamin E Market Revenue Million Forecast, by Country 2019 & 2032
- Table 6: United States Natural Vitamin E Market Revenue (Million) Forecast, by Application 2019 & 2032
- Table 7: Canada Natural Vitamin E Market Revenue (Million) Forecast, by Application 2019 & 2032
- Table 8: Mexico Natural Vitamin E Market Revenue (Million) Forecast, by Application 2019 & 2032
- Table 9: Rest of North America Natural Vitamin E Market Revenue (Million) Forecast, by Application 2019 & 2032
- Table 10: Global Natural Vitamin E Market Revenue Million Forecast, by Country 2019 & 2032
- Table 11: Spain Natural Vitamin E Market Revenue (Million) Forecast, by Application 2019 & 2032
- Table 12: United Kingdom Natural Vitamin E Market Revenue (Million) Forecast, by Application 2019 & 2032
- Table 13: Germany Natural Vitamin E Market Revenue (Million) Forecast, by Application 2019 & 2032
- Table 14: France Natural Vitamin E Market Revenue (Million) Forecast, by Application 2019 & 2032
- Table 15: Italy Natural Vitamin E Market Revenue (Million) Forecast, by Application 2019 & 2032
- Table 16: Rest of Europe Natural Vitamin E Market Revenue (Million) Forecast, by Application 2019 & 2032
- Table 17: Global Natural Vitamin E Market Revenue Million Forecast, by Country 2019 & 2032
- Table 18: China Natural Vitamin E Market Revenue (Million) Forecast, by Application 2019 & 2032
- Table 19: Japan Natural Vitamin E Market Revenue (Million) Forecast, by Application 2019 & 2032
- Table 20: India Natural Vitamin E Market Revenue (Million) Forecast, by Application 2019 & 2032
- Table 21: Australia Natural Vitamin E Market Revenue (Million) Forecast, by Application 2019 & 2032
- Table 22: Rest of Asia Pacific Natural Vitamin E Market Revenue (Million) Forecast, by Application 2019 & 2032
- Table 23: Global Natural Vitamin E Market Revenue Million Forecast, by Country 2019 & 2032
- Table 24: Brazil Natural Vitamin E Market Revenue (Million) Forecast, by Application 2019 & 2032
- Table 25: Argentina Natural Vitamin E Market Revenue (Million) Forecast, by Application 2019 & 2032
- Table 26: Rest of South America Natural Vitamin E Market Revenue (Million) Forecast, by Application 2019 & 2032
- Table 27: Global Natural Vitamin E Market Revenue Million Forecast, by Country 2019 & 2032
- Table 28: UAE Natural Vitamin E Market Revenue (Million) Forecast, by Application 2019 & 2032
- Table 29: South Africa Natural Vitamin E Market Revenue (Million) Forecast, by Application 2019 & 2032
- Table 30: Saudi Arabia Natural Vitamin E Market Revenue (Million) Forecast, by Application 2019 & 2032
- Table 31: Rest of MEA Natural Vitamin E Market Revenue (Million) Forecast, by Application 2019 & 2032
- Table 32: Global Natural Vitamin E Market Revenue Million Forecast, by Product Type 2019 & 2032
- Table 33: Global Natural Vitamin E Market Revenue Million Forecast, by Application 2019 & 2032
- Table 34: Global Natural Vitamin E Market Revenue Million Forecast, by Country 2019 & 2032
- Table 35: United States Natural Vitamin E Market Revenue (Million) Forecast, by Application 2019 & 2032
- Table 36: Canada Natural Vitamin E Market Revenue (Million) Forecast, by Application 2019 & 2032
- Table 37: Mexico Natural Vitamin E Market Revenue (Million) Forecast, by Application 2019 & 2032
- Table 38: Rest of North America Natural Vitamin E Market Revenue (Million) Forecast, by Application 2019 & 2032
- Table 39: Global Natural Vitamin E Market Revenue Million Forecast, by Product Type 2019 & 2032
- Table 40: Global Natural Vitamin E Market Revenue Million Forecast, by Application 2019 & 2032
- Table 41: Global Natural Vitamin E Market Revenue Million Forecast, by Country 2019 & 2032
- Table 42: Spain Natural Vitamin E Market Revenue (Million) Forecast, by Application 2019 & 2032
- Table 43: United Kingdom Natural Vitamin E Market Revenue (Million) Forecast, by Application 2019 & 2032
- Table 44: Germany Natural Vitamin E Market Revenue (Million) Forecast, by Application 2019 & 2032
- Table 45: France Natural Vitamin E Market Revenue (Million) Forecast, by Application 2019 & 2032
- Table 46: Italy Natural Vitamin E Market Revenue (Million) Forecast, by Application 2019 & 2032
- Table 47: Rest of Europe Natural Vitamin E Market Revenue (Million) Forecast, by Application 2019 & 2032
- Table 48: Global Natural Vitamin E Market Revenue Million Forecast, by Product Type 2019 & 2032
- Table 49: Global Natural Vitamin E Market Revenue Million Forecast, by Application 2019 & 2032
- Table 50: Global Natural Vitamin E Market Revenue Million Forecast, by Country 2019 & 2032
- Table 51: China Natural Vitamin E Market Revenue (Million) Forecast, by Application 2019 & 2032
- Table 52: Japan Natural Vitamin E Market Revenue (Million) Forecast, by Application 2019 & 2032
- Table 53: India Natural Vitamin E Market Revenue (Million) Forecast, by Application 2019 & 2032
- Table 54: Australia Natural Vitamin E Market Revenue (Million) Forecast, by Application 2019 & 2032
- Table 55: Rest of Asia Pacific Natural Vitamin E Market Revenue (Million) Forecast, by Application 2019 & 2032
- Table 56: Global Natural Vitamin E Market Revenue Million Forecast, by Product Type 2019 & 2032
- Table 57: Global Natural Vitamin E Market Revenue Million Forecast, by Application 2019 & 2032
- Table 58: Global Natural Vitamin E Market Revenue Million Forecast, by Country 2019 & 2032
- Table 59: Brazil Natural Vitamin E Market Revenue (Million) Forecast, by Application 2019 & 2032
- Table 60: Argentina Natural Vitamin E Market Revenue (Million) Forecast, by Application 2019 & 2032
- Table 61: Rest of South America Natural Vitamin E Market Revenue (Million) Forecast, by Application 2019 & 2032
- Table 62: Global Natural Vitamin E Market Revenue Million Forecast, by Product Type 2019 & 2032
- Table 63: Global Natural Vitamin E Market Revenue Million Forecast, by Application 2019 & 2032
- Table 64: Global Natural Vitamin E Market Revenue Million Forecast, by Country 2019 & 2032
- Table 65: Saudi Arabia Natural Vitamin E Market Revenue (Million) Forecast, by Application 2019 & 2032
- Table 66: South Africa Natural Vitamin E Market Revenue (Million) Forecast, by Application 2019 & 2032
- Table 67: Rest of Middle East and Africa Natural Vitamin E Market Revenue (Million) Forecast, by Application 2019 & 2032
Frequently Asked Questions
1. What is the projected Compound Annual Growth Rate (CAGR) of the Natural Vitamin E Market?
The projected CAGR is approximately 7.38%.
2. Which companies are prominent players in the Natural Vitamin E Market?
Key companies in the market include Merck KGaA (Sigma Aldrich), Kuala Lumpur Kepong Berhad (Davos Life Science), Archer Daniels Midland Company, Excel Vite Inc, BASF SE, Brenntag AG, Orah Nutrichem Pvt Ltd, One Rock Capital Partners LLC (Kensing LLC)*List Not Exhaustive, Parachem Fine & Specialty Chemicals, Koninklijke Dsm N V.
3. What are the main segments of the Natural Vitamin E Market?
The market segments include Product Type, Application.
4. Can you provide details about the market size?
The market size is estimated to be USD 0.85 Million as of 2022.
5. What are some drivers contributing to market growth?
Awareness of Health Benefits Associated with Tocotrienol; Escalating Demand for Anti-Aging Products Containing Tocotrienol.
6. What are the notable trends driving market growth?
Substantial Growth of Global Health and Wellness Industry.
7. Are there any restraints impacting market growth?
Availability of Substitutes.
8. Can you provide examples of recent developments in the market?
June 2022: Kensing, LLC, a renowned manufacturer specializing in natural vitamin E, plant sterols, and high-purity surfactants, and a portfolio company of One Rock Capital Partners, LLC, has recently completed the acquisition of Vitae Naturals. Vitae Naturals, a prominent producer of plant sterol esters and non-GMO natural vitamin E derivatives, caters to a diverse range of industries, including food, nutrition, and skincare.
9. What pricing options are available for accessing the report?
Pricing options include single-user, multi-user, and enterprise licenses priced at USD 4750, USD 5250, and USD 8750 respectively.
10. Is the market size provided in terms of value or volume?
The market size is provided in terms of value, measured in Million.
11. Are there any specific market keywords associated with the report?
Yes, the market keyword associated with the report is "Natural Vitamin E Market," which aids in identifying and referencing the specific market segment covered.
12. How do I determine which pricing option suits my needs best?
The pricing options vary based on user requirements and access needs. Individual users may opt for single-user licenses, while businesses requiring broader access may choose multi-user or enterprise licenses for cost-effective access to the report.
13. Are there any additional resources or data provided in the Natural Vitamin E Market report?
While the report offers comprehensive insights, it's advisable to review the specific contents or supplementary materials provided to ascertain if additional resources or data are available.
14. How can I stay updated on further developments or reports in the Natural Vitamin E Market?
To stay informed about further developments, trends, and reports in the Natural Vitamin E Market, consider subscribing to industry newsletters, following relevant companies and organizations, or regularly checking reputable industry news sources and publications.
Methodology
Step 1 - Identification of Relevant Samples Size from Population Database


Step 2 - Approaches for Defining Global Market Size (Value, Volume* & Price*)

Note*: In applicable scenarios
Step 3 - Data Sources
Primary Research
- Web Analytics
- Survey Reports
- Research Institute
- Latest Research Reports
- Opinion Leaders
Secondary Research
- Annual Reports
- White Paper
- Latest Press Release
- Industry Association
- Paid Database
- Investor Presentations

Step 4 - Data Triangulation
Involves using different sources of information in order to increase the validity of a study
These sources are likely to be stakeholders in a program - participants, other researchers, program staff, other community members, and so on.
Then we put all data in single framework & apply various statistical tools to find out the dynamic on the market.
During the analysis stage, feedback from the stakeholder groups would be compared to determine areas of agreement as well as areas of divergence


