
Key Insights
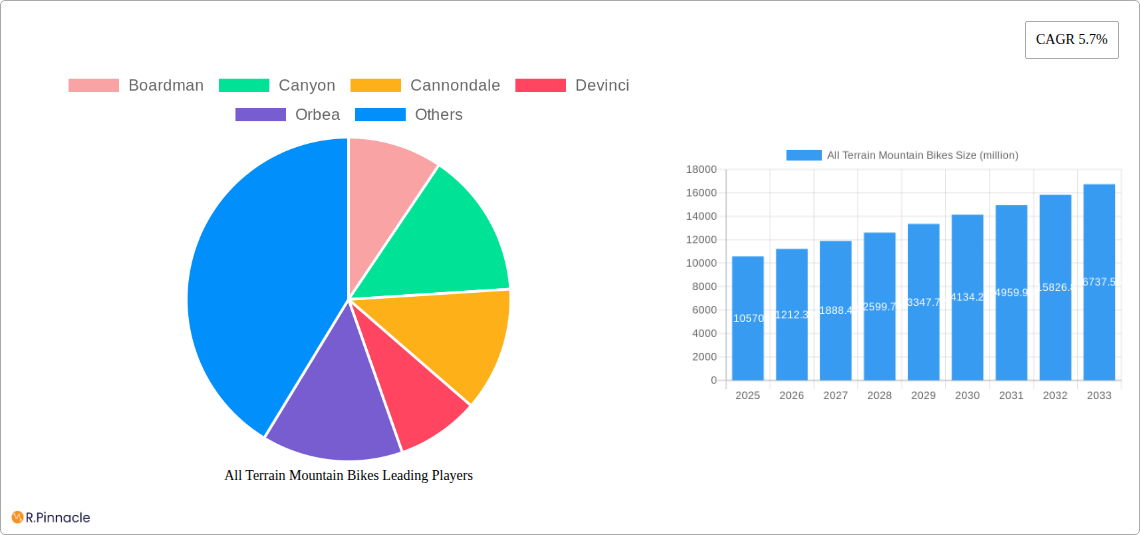
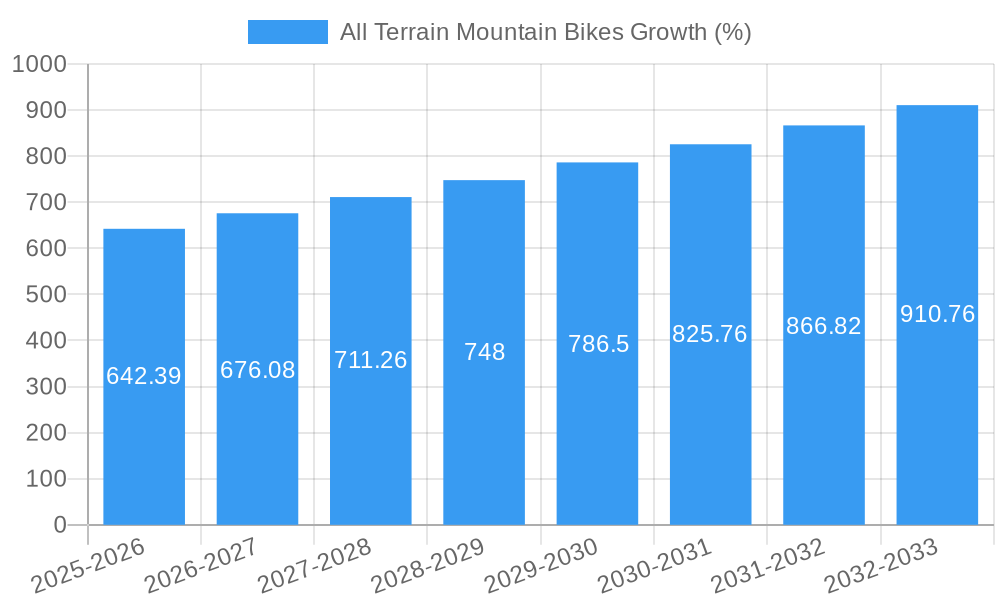
The all-terrain mountain bike (ATMB) market, valued at approximately $10,570 million in 2025, is projected to experience robust growth, driven by a Compound Annual Growth Rate (CAGR) of 5.7% from 2025 to 2033. This expansion is fueled by several key factors. The rising popularity of outdoor recreational activities, particularly among millennials and Gen Z, is significantly boosting demand. Furthermore, advancements in ATMB technology, such as improved suspension systems, lighter frame materials (like carbon fiber), and integrated electronic components, are enhancing performance and attracting a wider range of consumers. The increasing adoption of e-bikes within the ATMB segment also contributes to market growth, offering a solution for riders seeking assistance on challenging terrains. Growth is further supported by the expanding global middle class, with increased disposable income enabling more individuals to invest in high-quality recreational equipment. The market segmentation, encompassing online and offline sales channels and diverse transmission types (21-speed and 24-speed), caters to varied consumer preferences and purchasing behaviors. Competitive landscape analysis reveals a multitude of established brands, including Boardman, Canyon, Cannondale, and Specialized, alongside emerging players continuously innovating to capture market share.
Geographic distribution reveals a diversified market, with North America and Europe currently representing major revenue contributors. However, the Asia-Pacific region presents significant growth potential due to its burgeoning middle class and increasing participation in cycling sports. While the market faces potential restraints from fluctuating raw material prices and economic downturns, the overall positive trend is expected to continue, driven by the aforementioned factors. The continued development of technologically advanced and sustainable ATMBs will be key to sustaining this positive trajectory, further fueling market expansion in the coming years. Strategic partnerships, product diversification, and targeted marketing campaigns by manufacturers are expected to play a significant role in shaping the ATMB market's future.
All Terrain Mountain Bikes Market Report: 2019-2033
This comprehensive report provides a detailed analysis of the global all-terrain mountain bike market, offering invaluable insights for industry professionals, investors, and strategic decision-makers. Leveraging a robust research methodology and encompassing data from 2019 to 2033 (Base Year: 2025, Forecast Period: 2025-2033), this report illuminates market trends, competitive landscapes, and future growth potential. The market is valued at millions and is experiencing significant growth, driven by factors including technological advancements, rising consumer disposable income, and increasing participation in outdoor recreational activities.
All Terrain Mountain Bikes Market Structure & Innovation Trends
The global all-terrain mountain bike market exhibits a moderately fragmented structure with numerous established players and emerging entrants vying for market share. Key players like Boardman, Canyon, Cannondale, Devinci, Orbea, Vitus, Bianchi, 3T, Giant, Juliana, Lauf, On-One, Specialized, Focus, Kinesis Tripster, Merida, Bulls, KTM, Cervelo, Ribble, Polygon, Factor, Pinarello, Wilier, Trek, and NORCO contribute significantly to the market's overall value, estimated at $XX million in 2025. Market share is dynamic, with leading companies such as Specialized and Giant holding substantial portions. The market is characterized by continuous innovation, driven by advancements in materials (e.g., carbon fiber, lightweight aluminum alloys), component technology (e.g., suspension systems, drivetrains), and integrated electronics. Regulatory frameworks concerning safety and environmental standards influence product design and manufacturing processes. Substitute products, such as e-bikes and other recreational vehicles, present competitive pressure. The market has witnessed several significant M&A activities in the past five years, with deal values totaling approximately $XX million. These activities reflect consolidation efforts and strategic expansion within the industry.
- Market Concentration: Moderately fragmented.
- Innovation Drivers: Material advancements, component technology, integrated electronics.
- M&A Activity: $XX million in deal value over the past five years.
- Key Players' Market Share: Specialized and Giant holding substantial shares (exact figures unavailable for this report).
All Terrain Mountain Bikes Market Dynamics & Trends
The all-terrain mountain bike market is experiencing robust growth, projected to achieve a Compound Annual Growth Rate (CAGR) of XX% during the forecast period (2025-2033). This growth is fueled by several key factors: increasing consumer spending on recreational activities, a rising preference for eco-friendly transportation options (especially in urban areas), and the integration of smart technologies enhancing the biking experience. Technological disruptions, such as advancements in electric assist systems and integrated GPS navigation, are driving innovation and expanding market opportunities. Consumer preferences are shifting towards lighter, more durable, and technologically advanced bikes with improved suspension and braking systems. Competitive dynamics are intense, with companies focusing on product differentiation, brand building, and strategic partnerships to gain a competitive edge. Market penetration is increasing in emerging economies due to rising disposable incomes and increased awareness of outdoor activities.
Dominant Regions & Segments in All Terrain Mountain Bikes
The North American region currently holds the largest market share in the all-terrain mountain bike market, driven by high consumer spending power and a strong culture of outdoor recreation. However, the Asia-Pacific region is projected to experience the fastest growth during the forecast period due to rapidly increasing disposable incomes and the growing popularity of cycling as a recreational activity.
- Dominant Region: North America (2025)
- Fastest-Growing Region: Asia-Pacific (2025-2033)
Application Segments:
- Online Sales: Growing rapidly due to increasing e-commerce adoption and convenient online purchasing.
- Offline Sales: Remains a significant segment, benefiting from in-person product demonstrations and personalized customer service.
Type Segments:
24 Speed Transmission: Holds a larger market share due to greater versatility and adaptability to varied terrains.
21 Speed Transmission: Offers a balance of performance and affordability, catering to a wider range of consumers.
Key Drivers (for dominant regions & segments): High consumer spending, strong outdoor recreation culture, e-commerce growth, technological advancements, affordability.
All Terrain Mountain Bikes Product Innovations
Recent innovations in all-terrain mountain bikes focus on improved suspension systems, lighter frame materials (e.g., carbon fiber), integrated electronic components (e.g., GPS, power meters), and enhanced drivetrain technologies. These advancements enhance performance, durability, and the overall riding experience, catering to the demands of increasingly discerning consumers. The market is seeing a rise in full-suspension bikes offering superior shock absorption, and the integration of smart technologies is transforming the biking experience, adding features such as fitness tracking and navigation.
Report Scope & Segmentation Analysis
This report segments the all-terrain mountain bike market by application (online sales and offline sales) and type (24-speed and 21-speed transmissions). Each segment's growth projections, market size (in millions), and competitive dynamics are thoroughly analyzed. The online sales segment is projected to witness significant growth due to the rising popularity of e-commerce, while the offline sales segment is expected to remain substantial due to the experiential nature of purchasing bicycles. The 24-speed transmission segment dominates due to its versatility, while the 21-speed segment caters to a more budget-conscious customer base. Competitive dynamics within each segment vary significantly, reflecting the diverse nature of the market players and their strategies.
Key Drivers of All Terrain Mountain Bikes Growth
Several factors drive the growth of the all-terrain mountain bike market. Firstly, the rising disposable incomes globally, particularly in emerging economies, are fueling demand for recreational activities such as cycling. Secondly, increasing environmental awareness promotes cycling as a sustainable transportation option. Thirdly, technological advancements, such as improved suspension systems and lightweight materials, are enhancing the overall biking experience. Finally, government initiatives promoting cycling infrastructure and recreational activities further contribute to the market's expansion.
Challenges in the All Terrain Mountain Bikes Sector
The all-terrain mountain bike sector faces several challenges. Fluctuations in raw material prices and supply chain disruptions impact manufacturing costs and profitability. Intense competition necessitates constant innovation and strategic marketing efforts to maintain market share. Furthermore, stringent safety regulations and environmental standards impose additional costs on manufacturers. These combined challenges impact overall market growth and profitability. The impact of these challenges is estimated to result in a XX% reduction in market growth in 2026.
Emerging Opportunities in All Terrain Mountain Bikes
Emerging opportunities lie in the growing popularity of e-bikes, the expansion into new markets in developing economies, and the integration of advanced technologies like augmented reality (AR) and virtual reality (VR) to enhance the biking experience. The increasing demand for customized bikes and personalized services also presents lucrative avenues for growth. These opportunities are projected to contribute to a XX% increase in market growth between 2027 and 2030.
Leading Players in the All Terrain Mountain Bikes Market
- Boardman
- Canyon
- Cannondale
- Devinci
- Orbea
- Vitus
- Bianchi
- 3T
- Giant
- Juliana
- Lauf
- On-One
- Specialized
- Focus
- Kinesis Tripster
- Merida
- Bulls
- KTM
- Cervelo
- Ribble
- Polygon
- Factor
- Pinarello
- Wilier
- Trek
- NORCO
Key Developments in All Terrain Mountain Bikes Industry
- 2022-Q4: Specialized launched its new flagship all-terrain mountain bike featuring advanced suspension technology.
- 2023-Q1: Giant and Cannondale announced a strategic partnership for joint research and development.
- 2023-Q3: Several manufacturers announced price increases due to rising raw material costs.
- 2024-Q2: New EU regulations impacting e-bike battery standards were introduced.
Future Outlook for All Terrain Mountain Bikes Market
The future of the all-terrain mountain bike market appears bright, with strong growth potential driven by continued technological advancements, expanding consumer base, and favorable government policies. Strategic partnerships, diversification of product offerings, and focusing on sustainability will be critical for success. The market is projected to reach $XX million by 2033, representing a significant expansion from its current valuation.
All Terrain Mountain Bikes Segmentation
-
1. Application
- 1.1. Online Sales
- 1.2. Offline Sales
-
2. Types
- 2.1. 24 Speed Transmission
- 2.2. 21 Speed Transmission
All Terrain Mountain Bikes Segmentation By Geography
-
1. North America
- 1.1. United States
- 1.2. Canada
- 1.3. Mexico
-
2. South America
- 2.1. Brazil
- 2.2. Argentina
- 2.3. Rest of South America
-
3. Europe
- 3.1. United Kingdom
- 3.2. Germany
- 3.3. France
- 3.4. Italy
- 3.5. Spain
- 3.6. Russia
- 3.7. Benelux
- 3.8. Nordics
- 3.9. Rest of Europe
-
4. Middle East & Africa
- 4.1. Turkey
- 4.2. Israel
- 4.3. GCC
- 4.4. North Africa
- 4.5. South Africa
- 4.6. Rest of Middle East & Africa
-
5. Asia Pacific
- 5.1. China
- 5.2. India
- 5.3. Japan
- 5.4. South Korea
- 5.5. ASEAN
- 5.6. Oceania
- 5.7. Rest of Asia Pacific

All Terrain Mountain Bikes REPORT HIGHLIGHTS
| Aspects | Details |
|---|---|
| Study Period | 2019-2033 |
| Base Year | 2024 |
| Estimated Year | 2025 |
| Forecast Period | 2025-2033 |
| Historical Period | 2019-2024 |
| Growth Rate | CAGR of 5.7% from 2019-2033 |
| Segmentation |
|
Table of Contents
- 1. Introduction
- 1.1. Research Scope
- 1.2. Market Segmentation
- 1.3. Research Methodology
- 1.4. Definitions and Assumptions
- 2. Executive Summary
- 2.1. Introduction
- 3. Market Dynamics
- 3.1. Introduction
- 3.2. Market Drivers
- 3.3. Market Restrains
- 3.4. Market Trends
- 4. Market Factor Analysis
- 4.1. Porters Five Forces
- 4.2. Supply/Value Chain
- 4.3. PESTEL analysis
- 4.4. Market Entropy
- 4.5. Patent/Trademark Analysis
- 5. Global All Terrain Mountain Bikes Analysis, Insights and Forecast, 2019-2031
- 5.1. Market Analysis, Insights and Forecast - by Application
- 5.1.1. Online Sales
- 5.1.2. Offline Sales
- 5.2. Market Analysis, Insights and Forecast - by Types
- 5.2.1. 24 Speed Transmission
- 5.2.2. 21 Speed Transmission
- 5.3. Market Analysis, Insights and Forecast - by Region
- 5.3.1. North America
- 5.3.2. South America
- 5.3.3. Europe
- 5.3.4. Middle East & Africa
- 5.3.5. Asia Pacific
- 5.1. Market Analysis, Insights and Forecast - by Application
- 6. North America All Terrain Mountain Bikes Analysis, Insights and Forecast, 2019-2031
- 6.1. Market Analysis, Insights and Forecast - by Application
- 6.1.1. Online Sales
- 6.1.2. Offline Sales
- 6.2. Market Analysis, Insights and Forecast - by Types
- 6.2.1. 24 Speed Transmission
- 6.2.2. 21 Speed Transmission
- 6.1. Market Analysis, Insights and Forecast - by Application
- 7. South America All Terrain Mountain Bikes Analysis, Insights and Forecast, 2019-2031
- 7.1. Market Analysis, Insights and Forecast - by Application
- 7.1.1. Online Sales
- 7.1.2. Offline Sales
- 7.2. Market Analysis, Insights and Forecast - by Types
- 7.2.1. 24 Speed Transmission
- 7.2.2. 21 Speed Transmission
- 7.1. Market Analysis, Insights and Forecast - by Application
- 8. Europe All Terrain Mountain Bikes Analysis, Insights and Forecast, 2019-2031
- 8.1. Market Analysis, Insights and Forecast - by Application
- 8.1.1. Online Sales
- 8.1.2. Offline Sales
- 8.2. Market Analysis, Insights and Forecast - by Types
- 8.2.1. 24 Speed Transmission
- 8.2.2. 21 Speed Transmission
- 8.1. Market Analysis, Insights and Forecast - by Application
- 9. Middle East & Africa All Terrain Mountain Bikes Analysis, Insights and Forecast, 2019-2031
- 9.1. Market Analysis, Insights and Forecast - by Application
- 9.1.1. Online Sales
- 9.1.2. Offline Sales
- 9.2. Market Analysis, Insights and Forecast - by Types
- 9.2.1. 24 Speed Transmission
- 9.2.2. 21 Speed Transmission
- 9.1. Market Analysis, Insights and Forecast - by Application
- 10. Asia Pacific All Terrain Mountain Bikes Analysis, Insights and Forecast, 2019-2031
- 10.1. Market Analysis, Insights and Forecast - by Application
- 10.1.1. Online Sales
- 10.1.2. Offline Sales
- 10.2. Market Analysis, Insights and Forecast - by Types
- 10.2.1. 24 Speed Transmission
- 10.2.2. 21 Speed Transmission
- 10.1. Market Analysis, Insights and Forecast - by Application
- 11. Competitive Analysis
- 11.1. Global Market Share Analysis 2024
- 11.2. Company Profiles
- 11.2.1 Boardman
- 11.2.1.1. Overview
- 11.2.1.2. Products
- 11.2.1.3. SWOT Analysis
- 11.2.1.4. Recent Developments
- 11.2.1.5. Financials (Based on Availability)
- 11.2.2 Canyon
- 11.2.2.1. Overview
- 11.2.2.2. Products
- 11.2.2.3. SWOT Analysis
- 11.2.2.4. Recent Developments
- 11.2.2.5. Financials (Based on Availability)
- 11.2.3 Cannondale
- 11.2.3.1. Overview
- 11.2.3.2. Products
- 11.2.3.3. SWOT Analysis
- 11.2.3.4. Recent Developments
- 11.2.3.5. Financials (Based on Availability)
- 11.2.4 Devinci
- 11.2.4.1. Overview
- 11.2.4.2. Products
- 11.2.4.3. SWOT Analysis
- 11.2.4.4. Recent Developments
- 11.2.4.5. Financials (Based on Availability)
- 11.2.5 Orbea
- 11.2.5.1. Overview
- 11.2.5.2. Products
- 11.2.5.3. SWOT Analysis
- 11.2.5.4. Recent Developments
- 11.2.5.5. Financials (Based on Availability)
- 11.2.6 Vitus
- 11.2.6.1. Overview
- 11.2.6.2. Products
- 11.2.6.3. SWOT Analysis
- 11.2.6.4. Recent Developments
- 11.2.6.5. Financials (Based on Availability)
- 11.2.7 Bianchi
- 11.2.7.1. Overview
- 11.2.7.2. Products
- 11.2.7.3. SWOT Analysis
- 11.2.7.4. Recent Developments
- 11.2.7.5. Financials (Based on Availability)
- 11.2.8 3T
- 11.2.8.1. Overview
- 11.2.8.2. Products
- 11.2.8.3. SWOT Analysis
- 11.2.8.4. Recent Developments
- 11.2.8.5. Financials (Based on Availability)
- 11.2.9 Giant
- 11.2.9.1. Overview
- 11.2.9.2. Products
- 11.2.9.3. SWOT Analysis
- 11.2.9.4. Recent Developments
- 11.2.9.5. Financials (Based on Availability)
- 11.2.10 Juliana
- 11.2.10.1. Overview
- 11.2.10.2. Products
- 11.2.10.3. SWOT Analysis
- 11.2.10.4. Recent Developments
- 11.2.10.5. Financials (Based on Availability)
- 11.2.11 Lauf
- 11.2.11.1. Overview
- 11.2.11.2. Products
- 11.2.11.3. SWOT Analysis
- 11.2.11.4. Recent Developments
- 11.2.11.5. Financials (Based on Availability)
- 11.2.12 On-One
- 11.2.12.1. Overview
- 11.2.12.2. Products
- 11.2.12.3. SWOT Analysis
- 11.2.12.4. Recent Developments
- 11.2.12.5. Financials (Based on Availability)
- 11.2.13 Specialized
- 11.2.13.1. Overview
- 11.2.13.2. Products
- 11.2.13.3. SWOT Analysis
- 11.2.13.4. Recent Developments
- 11.2.13.5. Financials (Based on Availability)
- 11.2.14 Focus
- 11.2.14.1. Overview
- 11.2.14.2. Products
- 11.2.14.3. SWOT Analysis
- 11.2.14.4. Recent Developments
- 11.2.14.5. Financials (Based on Availability)
- 11.2.15 Kinesis Tripster
- 11.2.15.1. Overview
- 11.2.15.2. Products
- 11.2.15.3. SWOT Analysis
- 11.2.15.4. Recent Developments
- 11.2.15.5. Financials (Based on Availability)
- 11.2.16 Merida
- 11.2.16.1. Overview
- 11.2.16.2. Products
- 11.2.16.3. SWOT Analysis
- 11.2.16.4. Recent Developments
- 11.2.16.5. Financials (Based on Availability)
- 11.2.17 Bulls
- 11.2.17.1. Overview
- 11.2.17.2. Products
- 11.2.17.3. SWOT Analysis
- 11.2.17.4. Recent Developments
- 11.2.17.5. Financials (Based on Availability)
- 11.2.18 KTM
- 11.2.18.1. Overview
- 11.2.18.2. Products
- 11.2.18.3. SWOT Analysis
- 11.2.18.4. Recent Developments
- 11.2.18.5. Financials (Based on Availability)
- 11.2.19 Cervelo
- 11.2.19.1. Overview
- 11.2.19.2. Products
- 11.2.19.3. SWOT Analysis
- 11.2.19.4. Recent Developments
- 11.2.19.5. Financials (Based on Availability)
- 11.2.20 Ribble
- 11.2.20.1. Overview
- 11.2.20.2. Products
- 11.2.20.3. SWOT Analysis
- 11.2.20.4. Recent Developments
- 11.2.20.5. Financials (Based on Availability)
- 11.2.21 Polygon
- 11.2.21.1. Overview
- 11.2.21.2. Products
- 11.2.21.3. SWOT Analysis
- 11.2.21.4. Recent Developments
- 11.2.21.5. Financials (Based on Availability)
- 11.2.22 Factor
- 11.2.22.1. Overview
- 11.2.22.2. Products
- 11.2.22.3. SWOT Analysis
- 11.2.22.4. Recent Developments
- 11.2.22.5. Financials (Based on Availability)
- 11.2.23 Pinarello
- 11.2.23.1. Overview
- 11.2.23.2. Products
- 11.2.23.3. SWOT Analysis
- 11.2.23.4. Recent Developments
- 11.2.23.5. Financials (Based on Availability)
- 11.2.24 Wilier
- 11.2.24.1. Overview
- 11.2.24.2. Products
- 11.2.24.3. SWOT Analysis
- 11.2.24.4. Recent Developments
- 11.2.24.5. Financials (Based on Availability)
- 11.2.25 Trek
- 11.2.25.1. Overview
- 11.2.25.2. Products
- 11.2.25.3. SWOT Analysis
- 11.2.25.4. Recent Developments
- 11.2.25.5. Financials (Based on Availability)
- 11.2.26 NORCO
- 11.2.26.1. Overview
- 11.2.26.2. Products
- 11.2.26.3. SWOT Analysis
- 11.2.26.4. Recent Developments
- 11.2.26.5. Financials (Based on Availability)
- 11.2.1 Boardman
List of Figures
- Figure 1: Global All Terrain Mountain Bikes Revenue Breakdown (million, %) by Region 2024 & 2032
- Figure 2: North America All Terrain Mountain Bikes Revenue (million), by Application 2024 & 2032
- Figure 3: North America All Terrain Mountain Bikes Revenue Share (%), by Application 2024 & 2032
- Figure 4: North America All Terrain Mountain Bikes Revenue (million), by Types 2024 & 2032
- Figure 5: North America All Terrain Mountain Bikes Revenue Share (%), by Types 2024 & 2032
- Figure 6: North America All Terrain Mountain Bikes Revenue (million), by Country 2024 & 2032
- Figure 7: North America All Terrain Mountain Bikes Revenue Share (%), by Country 2024 & 2032
- Figure 8: South America All Terrain Mountain Bikes Revenue (million), by Application 2024 & 2032
- Figure 9: South America All Terrain Mountain Bikes Revenue Share (%), by Application 2024 & 2032
- Figure 10: South America All Terrain Mountain Bikes Revenue (million), by Types 2024 & 2032
- Figure 11: South America All Terrain Mountain Bikes Revenue Share (%), by Types 2024 & 2032
- Figure 12: South America All Terrain Mountain Bikes Revenue (million), by Country 2024 & 2032
- Figure 13: South America All Terrain Mountain Bikes Revenue Share (%), by Country 2024 & 2032
- Figure 14: Europe All Terrain Mountain Bikes Revenue (million), by Application 2024 & 2032
- Figure 15: Europe All Terrain Mountain Bikes Revenue Share (%), by Application 2024 & 2032
- Figure 16: Europe All Terrain Mountain Bikes Revenue (million), by Types 2024 & 2032
- Figure 17: Europe All Terrain Mountain Bikes Revenue Share (%), by Types 2024 & 2032
- Figure 18: Europe All Terrain Mountain Bikes Revenue (million), by Country 2024 & 2032
- Figure 19: Europe All Terrain Mountain Bikes Revenue Share (%), by Country 2024 & 2032
- Figure 20: Middle East & Africa All Terrain Mountain Bikes Revenue (million), by Application 2024 & 2032
- Figure 21: Middle East & Africa All Terrain Mountain Bikes Revenue Share (%), by Application 2024 & 2032
- Figure 22: Middle East & Africa All Terrain Mountain Bikes Revenue (million), by Types 2024 & 2032
- Figure 23: Middle East & Africa All Terrain Mountain Bikes Revenue Share (%), by Types 2024 & 2032
- Figure 24: Middle East & Africa All Terrain Mountain Bikes Revenue (million), by Country 2024 & 2032
- Figure 25: Middle East & Africa All Terrain Mountain Bikes Revenue Share (%), by Country 2024 & 2032
- Figure 26: Asia Pacific All Terrain Mountain Bikes Revenue (million), by Application 2024 & 2032
- Figure 27: Asia Pacific All Terrain Mountain Bikes Revenue Share (%), by Application 2024 & 2032
- Figure 28: Asia Pacific All Terrain Mountain Bikes Revenue (million), by Types 2024 & 2032
- Figure 29: Asia Pacific All Terrain Mountain Bikes Revenue Share (%), by Types 2024 & 2032
- Figure 30: Asia Pacific All Terrain Mountain Bikes Revenue (million), by Country 2024 & 2032
- Figure 31: Asia Pacific All Terrain Mountain Bikes Revenue Share (%), by Country 2024 & 2032
List of Tables
- Table 1: Global All Terrain Mountain Bikes Revenue million Forecast, by Region 2019 & 2032
- Table 2: Global All Terrain Mountain Bikes Revenue million Forecast, by Application 2019 & 2032
- Table 3: Global All Terrain Mountain Bikes Revenue million Forecast, by Types 2019 & 2032
- Table 4: Global All Terrain Mountain Bikes Revenue million Forecast, by Region 2019 & 2032
- Table 5: Global All Terrain Mountain Bikes Revenue million Forecast, by Application 2019 & 2032
- Table 6: Global All Terrain Mountain Bikes Revenue million Forecast, by Types 2019 & 2032
- Table 7: Global All Terrain Mountain Bikes Revenue million Forecast, by Country 2019 & 2032
- Table 8: United States All Terrain Mountain Bikes Revenue (million) Forecast, by Application 2019 & 2032
- Table 9: Canada All Terrain Mountain Bikes Revenue (million) Forecast, by Application 2019 & 2032
- Table 10: Mexico All Terrain Mountain Bikes Revenue (million) Forecast, by Application 2019 & 2032
- Table 11: Global All Terrain Mountain Bikes Revenue million Forecast, by Application 2019 & 2032
- Table 12: Global All Terrain Mountain Bikes Revenue million Forecast, by Types 2019 & 2032
- Table 13: Global All Terrain Mountain Bikes Revenue million Forecast, by Country 2019 & 2032
- Table 14: Brazil All Terrain Mountain Bikes Revenue (million) Forecast, by Application 2019 & 2032
- Table 15: Argentina All Terrain Mountain Bikes Revenue (million) Forecast, by Application 2019 & 2032
- Table 16: Rest of South America All Terrain Mountain Bikes Revenue (million) Forecast, by Application 2019 & 2032
- Table 17: Global All Terrain Mountain Bikes Revenue million Forecast, by Application 2019 & 2032
- Table 18: Global All Terrain Mountain Bikes Revenue million Forecast, by Types 2019 & 2032
- Table 19: Global All Terrain Mountain Bikes Revenue million Forecast, by Country 2019 & 2032
- Table 20: United Kingdom All Terrain Mountain Bikes Revenue (million) Forecast, by Application 2019 & 2032
- Table 21: Germany All Terrain Mountain Bikes Revenue (million) Forecast, by Application 2019 & 2032
- Table 22: France All Terrain Mountain Bikes Revenue (million) Forecast, by Application 2019 & 2032
- Table 23: Italy All Terrain Mountain Bikes Revenue (million) Forecast, by Application 2019 & 2032
- Table 24: Spain All Terrain Mountain Bikes Revenue (million) Forecast, by Application 2019 & 2032
- Table 25: Russia All Terrain Mountain Bikes Revenue (million) Forecast, by Application 2019 & 2032
- Table 26: Benelux All Terrain Mountain Bikes Revenue (million) Forecast, by Application 2019 & 2032
- Table 27: Nordics All Terrain Mountain Bikes Revenue (million) Forecast, by Application 2019 & 2032
- Table 28: Rest of Europe All Terrain Mountain Bikes Revenue (million) Forecast, by Application 2019 & 2032
- Table 29: Global All Terrain Mountain Bikes Revenue million Forecast, by Application 2019 & 2032
- Table 30: Global All Terrain Mountain Bikes Revenue million Forecast, by Types 2019 & 2032
- Table 31: Global All Terrain Mountain Bikes Revenue million Forecast, by Country 2019 & 2032
- Table 32: Turkey All Terrain Mountain Bikes Revenue (million) Forecast, by Application 2019 & 2032
- Table 33: Israel All Terrain Mountain Bikes Revenue (million) Forecast, by Application 2019 & 2032
- Table 34: GCC All Terrain Mountain Bikes Revenue (million) Forecast, by Application 2019 & 2032
- Table 35: North Africa All Terrain Mountain Bikes Revenue (million) Forecast, by Application 2019 & 2032
- Table 36: South Africa All Terrain Mountain Bikes Revenue (million) Forecast, by Application 2019 & 2032
- Table 37: Rest of Middle East & Africa All Terrain Mountain Bikes Revenue (million) Forecast, by Application 2019 & 2032
- Table 38: Global All Terrain Mountain Bikes Revenue million Forecast, by Application 2019 & 2032
- Table 39: Global All Terrain Mountain Bikes Revenue million Forecast, by Types 2019 & 2032
- Table 40: Global All Terrain Mountain Bikes Revenue million Forecast, by Country 2019 & 2032
- Table 41: China All Terrain Mountain Bikes Revenue (million) Forecast, by Application 2019 & 2032
- Table 42: India All Terrain Mountain Bikes Revenue (million) Forecast, by Application 2019 & 2032
- Table 43: Japan All Terrain Mountain Bikes Revenue (million) Forecast, by Application 2019 & 2032
- Table 44: South Korea All Terrain Mountain Bikes Revenue (million) Forecast, by Application 2019 & 2032
- Table 45: ASEAN All Terrain Mountain Bikes Revenue (million) Forecast, by Application 2019 & 2032
- Table 46: Oceania All Terrain Mountain Bikes Revenue (million) Forecast, by Application 2019 & 2032
- Table 47: Rest of Asia Pacific All Terrain Mountain Bikes Revenue (million) Forecast, by Application 2019 & 2032
Frequently Asked Questions
1. What is the projected Compound Annual Growth Rate (CAGR) of the All Terrain Mountain Bikes?
The projected CAGR is approximately 5.7%.
2. Which companies are prominent players in the All Terrain Mountain Bikes?
Key companies in the market include Boardman, Canyon, Cannondale, Devinci, Orbea, Vitus, Bianchi, 3T, Giant, Juliana, Lauf, On-One, Specialized, Focus, Kinesis Tripster, Merida, Bulls, KTM, Cervelo, Ribble, Polygon, Factor, Pinarello, Wilier, Trek, NORCO.
3. What are the main segments of the All Terrain Mountain Bikes?
The market segments include Application, Types.
4. Can you provide details about the market size?
The market size is estimated to be USD 10570 million as of 2022.
5. What are some drivers contributing to market growth?
N/A
6. What are the notable trends driving market growth?
N/A
7. Are there any restraints impacting market growth?
N/A
8. Can you provide examples of recent developments in the market?
N/A
9. What pricing options are available for accessing the report?
Pricing options include single-user, multi-user, and enterprise licenses priced at USD 4900.00, USD 7350.00, and USD 9800.00 respectively.
10. Is the market size provided in terms of value or volume?
The market size is provided in terms of value, measured in million.
11. Are there any specific market keywords associated with the report?
Yes, the market keyword associated with the report is "All Terrain Mountain Bikes," which aids in identifying and referencing the specific market segment covered.
12. How do I determine which pricing option suits my needs best?
The pricing options vary based on user requirements and access needs. Individual users may opt for single-user licenses, while businesses requiring broader access may choose multi-user or enterprise licenses for cost-effective access to the report.
13. Are there any additional resources or data provided in the All Terrain Mountain Bikes report?
While the report offers comprehensive insights, it's advisable to review the specific contents or supplementary materials provided to ascertain if additional resources or data are available.
14. How can I stay updated on further developments or reports in the All Terrain Mountain Bikes?
To stay informed about further developments, trends, and reports in the All Terrain Mountain Bikes, consider subscribing to industry newsletters, following relevant companies and organizations, or regularly checking reputable industry news sources and publications.
Methodology
Step 1 - Identification of Relevant Samples Size from Population Database


Step 2 - Approaches for Defining Global Market Size (Value, Volume* & Price*)

Note*: In applicable scenarios
Step 3 - Data Sources
Primary Research
- Web Analytics
- Survey Reports
- Research Institute
- Latest Research Reports
- Opinion Leaders
Secondary Research
- Annual Reports
- White Paper
- Latest Press Release
- Industry Association
- Paid Database
- Investor Presentations

Step 4 - Data Triangulation
Involves using different sources of information in order to increase the validity of a study
These sources are likely to be stakeholders in a program - participants, other researchers, program staff, other community members, and so on.
Then we put all data in single framework & apply various statistical tools to find out the dynamic on the market.
During the analysis stage, feedback from the stakeholder groups would be compared to determine areas of agreement as well as areas of divergence


