
Key Insights
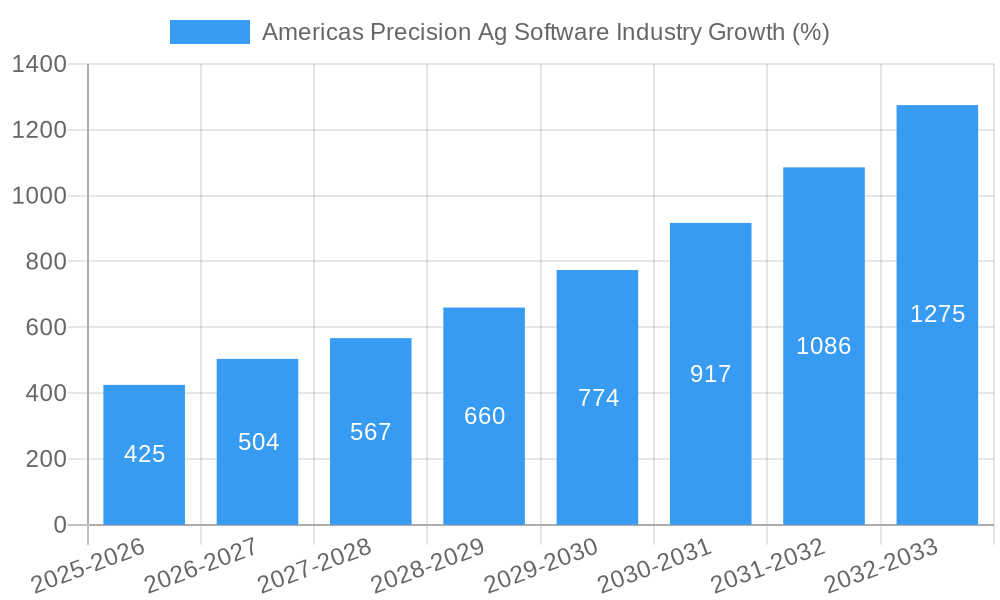
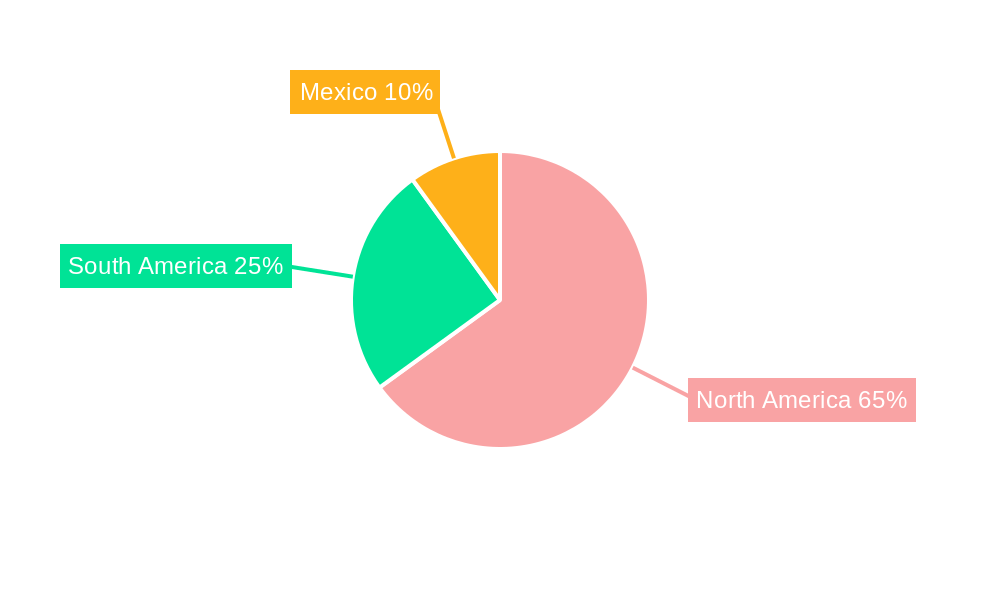
The Americas precision agriculture software market is experiencing robust growth, projected to reach a substantial size driven by increasing adoption of technology for improved farm efficiency and yield optimization. The market's Compound Annual Growth Rate (CAGR) of 17% from 2019 to 2024 indicates strong investor confidence and a significant shift towards data-driven farming practices. Key drivers include the rising demand for real-time data analysis to enhance decision-making, the increasing penetration of high-speed internet access in rural areas enabling seamless data transmission, and government initiatives promoting digital agriculture. The market is segmented by type (cloud-based and local/web-based solutions) and geography, with North America (particularly the United States and Canada) holding the largest market share due to high technology adoption rates and established agricultural infrastructure. South America, particularly Brazil and Argentina, is showing promising growth potential, driven by expanding arable land and government support for agricultural modernization. Leading players like Deere & Company, IBM, and Trimble are investing heavily in research and development to enhance their precision agriculture software offerings, driving innovation and competition within the market.
The market's growth is further fueled by emerging trends such as the integration of artificial intelligence (AI) and machine learning (ML) for predictive analytics, the use of IoT sensors for data collection, and the development of sophisticated software solutions that integrate various farm operations. However, factors such as high initial investment costs for software and hardware, a lack of digital literacy among some farmers, and concerns about data security and privacy could pose challenges to market growth. Despite these restraints, the long-term outlook remains positive, with continuous technological advancements and growing awareness of the benefits of precision agriculture driving sustained market expansion throughout the forecast period of 2025-2033. The market is expected to continue its robust growth trajectory, presenting significant opportunities for existing and new players alike.
This comprehensive report provides an in-depth analysis of the Americas precision agriculture software market, offering invaluable insights for industry professionals, investors, and strategic planners. With a focus on market structure, dynamics, leading players, and future trends, this report covers the period from 2019 to 2033, with a base year of 2025 and a forecast period spanning 2025-2033. The market is segmented by software type (Cloud, Local/Web-based) and geography (United States, Canada, Mexico, Argentina, and Rest of Americas). The total market size is projected to reach xx Million by 2033.

Americas Precision Ag Software Industry Market Structure & Innovation Trends
This section analyzes the competitive landscape, innovation drivers, and regulatory influences shaping the Americas precision agriculture software market. Market concentration is moderate, with several key players vying for market share. Deere & Company, IBM Corporation, and AGCO Corporation hold significant positions, while other companies like AG Leader Technology Inc., Taranis Inc., and Trimble Inc. contribute substantially. The total market size in 2025 is estimated at $xx Million.
- Market Share: Deere & Company holds an estimated xx% market share in 2025, followed by IBM Corporation at xx%, and AGCO Corporation at xx%. The remaining share is dispersed among numerous smaller players.
- Innovation Drivers: The increasing adoption of IoT devices, advancements in AI and machine learning, and the growing need for data-driven decision-making are major catalysts for innovation.
- Regulatory Framework: Government regulations promoting sustainable agriculture and precision farming techniques are creating favorable market conditions.
- M&A Activity: The sector has witnessed significant M&A activity in recent years, with deal values exceeding $xx Million in the period 2019-2024. These mergers and acquisitions aim to consolidate market share and enhance technological capabilities. For example, the acquisition of [Company A] by [Company B] in [Year] significantly altered the market landscape. Specific deal values are not publicly available for all transactions and will be included in the full report.
- Product Substitutes: While direct substitutes are limited, traditional farming methods and simpler, less sophisticated software solutions represent indirect competition.
- End-User Demographics: The primary end-users are large-scale commercial farms, followed by medium-sized farms and increasingly, smaller farms adopting precision agriculture practices.
Americas Precision Ag Software Industry Market Dynamics & Trends
The Americas precision agriculture software market is experiencing robust growth, driven by several factors. The Compound Annual Growth Rate (CAGR) is projected at xx% during the forecast period (2025-2033). Market penetration is currently at xx% and is expected to increase significantly due to the rising adoption of technology among farmers.
Technological disruptions, such as the integration of AI and machine learning capabilities into precision agriculture software, are revolutionizing farm management practices, improving efficiency, yield, and resource utilization. Consumer preferences are shifting towards data-driven decision-making, cloud-based solutions offering scalability and accessibility, and software that integrates seamlessly with existing farm equipment. Competitive dynamics are characterized by ongoing innovation, strategic partnerships, and the continuous integration of new technologies. The market is becoming increasingly sophisticated, emphasizing data analytics, predictive modeling, and automation. This leads to the development of specialized software solutions that cater to specific crop types, farming practices, and regional conditions. The rising cost of labor and inputs is another factor pushing farmers to adopt cost-effective precision agriculture technology.
Dominant Regions & Segments in Americas Precision Ag Software Industry
The United States dominates the Americas precision agriculture software market, owing to its highly developed agricultural sector, advanced technological infrastructure, and extensive adoption of precision farming technologies. The market size in the US is estimated at xx Million in 2025. The cloud-based segment enjoys the highest market share due to its scalability, accessibility, and ease of integration with other farm management tools.
- Key Drivers for US Dominance:
- Strong technological infrastructure
- High adoption of precision agriculture technologies
- Government support and incentives for technological innovation in agriculture
- High concentration of large-scale farms
- Other Regions: Canada, Mexico, and Argentina show substantial growth potential, driven by rising government investments in agricultural modernization, increasing farm sizes, and favorable climate conditions for certain crops. However, the Rest of Americas segment lags behind due to factors such as lower technological adoption rates and fragmented agricultural landscapes.
Americas Precision Ag Software Industry Product Innovations
Recent product innovations focus on integrating AI and machine learning to provide more accurate predictions of crop yield, optimize resource allocation, and enhance disease and pest management. These advancements allow for data-driven insights into soil conditions, weather patterns, and plant health, leading to more efficient and sustainable farming practices. The market is also seeing the development of user-friendly interfaces designed to streamline data analysis and improve decision-making for farmers. This focus on user-friendliness is a critical component in encouraging wider adoption.
Report Scope & Segmentation Analysis
This report segments the Americas precision agriculture software market by software type and geography.
By Type:
- Cloud-based: This segment is experiencing rapid growth, driven by its scalability, accessibility, and cost-effectiveness. The market size for cloud-based solutions is projected to reach xx Million by 2033.
- Local/Web-based: This segment offers solutions that can operate offline or with limited internet connectivity, making it suitable for farmers with limited access to reliable internet services. The market size for this segment is projected to reach xx Million by 2033.
By Country:
- United States: The largest market, projected to reach xx Million by 2033.
- Canada: Steady growth is anticipated, reaching xx Million by 2033.
- Mexico: Significant growth potential, projected to reach xx Million by 2033.
- Argentina: Moderate growth expected, reaching xx Million by 2033.
- Rest of Americas: A smaller market, with projected growth to xx Million by 2033.
Key Drivers of Americas Precision Ag Software Industry Growth
Several factors contribute to the market's growth. These include:
- Technological advancements: AI, machine learning, and IoT are revolutionizing farm management.
- Rising demand for increased efficiency and yield: Farmers seek ways to optimize resource use and maximize profits.
- Government initiatives and subsidies: Many governments support the adoption of precision agriculture technologies.
- Growing awareness of sustainable agriculture: Farmers are adopting technologies to reduce environmental impact.
Challenges in the Americas Precision Ag Software Industry Sector
Despite its growth potential, the market faces challenges:
- High initial investment costs: The upfront costs for software and hardware can be prohibitive for some farmers.
- Lack of digital literacy among some farmers: Training and support are needed for effective software adoption.
- Data security and privacy concerns: Protecting sensitive farm data is crucial.
- Internet connectivity issues: Reliable internet access is essential for cloud-based solutions, but it's not universally available.
Emerging Opportunities in Americas Precision Ag Software Industry
The market presents several exciting opportunities:
- Expansion into smaller farms: Developing affordable and user-friendly solutions for smaller farms.
- Integration with other agricultural technologies: Creating seamless integration with machinery and equipment.
- Development of specialized solutions: Tailoring software to specific crops, regions, and farming practices.
- Focus on data analytics and predictive modeling: Providing farmers with more actionable insights.
Leading Players in the Americas Precision Ag Software Industry Market
- Deere & Company
- IBM Corporation
- AGCO Corporation
- AG Leader Technology Inc
- Taranis Inc
- AGJunction Inc
- Harris Geospatial Solutions Inc
- Trimble Inc
- AgDNA Technologies Inc
- Granular Inc
- Bayer CropScience AG
Key Developments in Americas Precision Ag Software Industry Industry
- Jan 2023: Deere & Company launched a new precision agriculture software platform with enhanced AI capabilities.
- May 2022: A major merger between two precision agriculture software companies resulted in a combined market share of xx%.
- (Further developments will be detailed in the full report.)
Future Outlook for Americas Precision Ag Software Industry Market
The Americas precision agriculture software market is poised for continued strong growth, driven by ongoing technological advancements, increased demand for efficiency and sustainability, and supportive government policies. The market will see increased integration with other technologies like robotics and drones, creating a more comprehensive and automated farm management system. The focus on data analytics and predictive modeling will lead to more precise and efficient farming practices. Strategic partnerships and acquisitions will further shape the market landscape, leading to greater innovation and consolidation among key players.
Americas Precision Ag Software Industry Segmentation
-
1. Type
- 1.1. Cloud
- 1.2. Local/Web-based
Americas Precision Ag Software Industry Segmentation By Geography
-
1. Americas
- 1.1. United States
- 1.2. Canada
- 1.3. Mexico
- 1.4. Brazil
- 1.5. Argentina
- 1.6. Chile
- 1.7. Colombia
- 1.8. Peru
Americas Precision Ag Software Industry REPORT HIGHLIGHTS
| Aspects | Details |
|---|---|
| Study Period | 2019-2033 |
| Base Year | 2024 |
| Estimated Year | 2025 |
| Forecast Period | 2025-2033 |
| Historical Period | 2019-2024 |
| Growth Rate | CAGR of 17.00% from 2019-2033 |
| Segmentation |
|
Table of Contents
- 1. Introduction
- 1.1. Research Scope
- 1.2. Market Segmentation
- 1.3. Research Methodology
- 1.4. Definitions and Assumptions
- 2. Executive Summary
- 2.1. Introduction
- 3. Market Dynamics
- 3.1. Introduction
- 3.2. Market Drivers
- 3.2.1 ; Adoption of Precision Technology in the Sustainable and Efficient Agriculture Sector in Americas; Shortage of Farm labor
- 3.2.2 Along with Increasing Farm Size Across North America
- 3.3. Market Restrains
- 3.3.1. ; High Capital Cost and Complexity Regarding System Upgrades
- 3.4. Market Trends
- 3.4.1. Cloud-based Precision Farming Software is Expected to Grow Significantly
- 4. Market Factor Analysis
- 4.1. Porters Five Forces
- 4.2. Supply/Value Chain
- 4.3. PESTEL analysis
- 4.4. Market Entropy
- 4.5. Patent/Trademark Analysis
- 5. Americas Precision Ag Software Industry Analysis, Insights and Forecast, 2019-2031
- 5.1. Market Analysis, Insights and Forecast - by Type
- 5.1.1. Cloud
- 5.1.2. Local/Web-based
- 5.2. Market Analysis, Insights and Forecast - by Region
- 5.2.1. Americas
- 5.1. Market Analysis, Insights and Forecast - by Type
- 6. Latin America Americas Precision Ag Software Industry Analysis, Insights and Forecast, 2019-2031
- 6.1. Market Analysis, Insights and Forecast - By Country/Sub-region
- 6.1.1 Mexico
- 6.1.2 Brazil
- 7. North America Americas Precision Ag Software Industry Analysis, Insights and Forecast, 2019-2031
- 7.1. Market Analysis, Insights and Forecast - By Country/Sub-region
- 7.1.1 United States
- 7.1.2 Canada
- 7.1.3 Mexico
- 8. South America Americas Precision Ag Software Industry Analysis, Insights and Forecast, 2019-2031
- 8.1. Market Analysis, Insights and Forecast - By Country/Sub-region
- 8.1.1 Brazil
- 8.1.2 Argentina
- 8.1.3 Rest of South America
- 9. Competitive Analysis
- 9.1. Market Share Analysis 2024
- 9.2. Company Profiles
- 9.2.1 Deere & Company
- 9.2.1.1. Overview
- 9.2.1.2. Products
- 9.2.1.3. SWOT Analysis
- 9.2.1.4. Recent Developments
- 9.2.1.5. Financials (Based on Availability)
- 9.2.2 IBM Corporation
- 9.2.2.1. Overview
- 9.2.2.2. Products
- 9.2.2.3. SWOT Analysis
- 9.2.2.4. Recent Developments
- 9.2.2.5. Financials (Based on Availability)
- 9.2.3 AGCO Corporation
- 9.2.3.1. Overview
- 9.2.3.2. Products
- 9.2.3.3. SWOT Analysis
- 9.2.3.4. Recent Developments
- 9.2.3.5. Financials (Based on Availability)
- 9.2.4 AG Leader Technology Inc
- 9.2.4.1. Overview
- 9.2.4.2. Products
- 9.2.4.3. SWOT Analysis
- 9.2.4.4. Recent Developments
- 9.2.4.5. Financials (Based on Availability)
- 9.2.5 Taranis Inc
- 9.2.5.1. Overview
- 9.2.5.2. Products
- 9.2.5.3. SWOT Analysis
- 9.2.5.4. Recent Developments
- 9.2.5.5. Financials (Based on Availability)
- 9.2.6 AGJunction Inc
- 9.2.6.1. Overview
- 9.2.6.2. Products
- 9.2.6.3. SWOT Analysis
- 9.2.6.4. Recent Developments
- 9.2.6.5. Financials (Based on Availability)
- 9.2.7 Harris Geospatial Solutions Inc *List Not Exhaustive
- 9.2.7.1. Overview
- 9.2.7.2. Products
- 9.2.7.3. SWOT Analysis
- 9.2.7.4. Recent Developments
- 9.2.7.5. Financials (Based on Availability)
- 9.2.8 Trimble Inc
- 9.2.8.1. Overview
- 9.2.8.2. Products
- 9.2.8.3. SWOT Analysis
- 9.2.8.4. Recent Developments
- 9.2.8.5. Financials (Based on Availability)
- 9.2.9 AgDNA Technologies Inc
- 9.2.9.1. Overview
- 9.2.9.2. Products
- 9.2.9.3. SWOT Analysis
- 9.2.9.4. Recent Developments
- 9.2.9.5. Financials (Based on Availability)
- 9.2.10 Granular Inc
- 9.2.10.1. Overview
- 9.2.10.2. Products
- 9.2.10.3. SWOT Analysis
- 9.2.10.4. Recent Developments
- 9.2.10.5. Financials (Based on Availability)
- 9.2.11 Bayer CropScience AG
- 9.2.11.1. Overview
- 9.2.11.2. Products
- 9.2.11.3. SWOT Analysis
- 9.2.11.4. Recent Developments
- 9.2.11.5. Financials (Based on Availability)
- 9.2.1 Deere & Company
List of Figures
- Figure 1: Americas Precision Ag Software Industry Revenue Breakdown (Million, %) by Product 2024 & 2032
- Figure 2: Americas Precision Ag Software Industry Share (%) by Company 2024
List of Tables
- Table 1: Americas Precision Ag Software Industry Revenue Million Forecast, by Region 2019 & 2032
- Table 2: Americas Precision Ag Software Industry Revenue Million Forecast, by Type 2019 & 2032
- Table 3: Americas Precision Ag Software Industry Revenue Million Forecast, by Region 2019 & 2032
- Table 4: Americas Precision Ag Software Industry Revenue Million Forecast, by Country 2019 & 2032
- Table 5: Mexico Americas Precision Ag Software Industry Revenue (Million) Forecast, by Application 2019 & 2032
- Table 6: Brazil Americas Precision Ag Software Industry Revenue (Million) Forecast, by Application 2019 & 2032
- Table 7: Americas Precision Ag Software Industry Revenue Million Forecast, by Country 2019 & 2032
- Table 8: United States Americas Precision Ag Software Industry Revenue (Million) Forecast, by Application 2019 & 2032
- Table 9: Canada Americas Precision Ag Software Industry Revenue (Million) Forecast, by Application 2019 & 2032
- Table 10: Mexico Americas Precision Ag Software Industry Revenue (Million) Forecast, by Application 2019 & 2032
- Table 11: Americas Precision Ag Software Industry Revenue Million Forecast, by Country 2019 & 2032
- Table 12: Brazil Americas Precision Ag Software Industry Revenue (Million) Forecast, by Application 2019 & 2032
- Table 13: Argentina Americas Precision Ag Software Industry Revenue (Million) Forecast, by Application 2019 & 2032
- Table 14: Rest of South America Americas Precision Ag Software Industry Revenue (Million) Forecast, by Application 2019 & 2032
- Table 15: Americas Precision Ag Software Industry Revenue Million Forecast, by Type 2019 & 2032
- Table 16: Americas Precision Ag Software Industry Revenue Million Forecast, by Country 2019 & 2032
- Table 17: United States Americas Precision Ag Software Industry Revenue (Million) Forecast, by Application 2019 & 2032
- Table 18: Canada Americas Precision Ag Software Industry Revenue (Million) Forecast, by Application 2019 & 2032
- Table 19: Mexico Americas Precision Ag Software Industry Revenue (Million) Forecast, by Application 2019 & 2032
- Table 20: Brazil Americas Precision Ag Software Industry Revenue (Million) Forecast, by Application 2019 & 2032
- Table 21: Argentina Americas Precision Ag Software Industry Revenue (Million) Forecast, by Application 2019 & 2032
- Table 22: Chile Americas Precision Ag Software Industry Revenue (Million) Forecast, by Application 2019 & 2032
- Table 23: Colombia Americas Precision Ag Software Industry Revenue (Million) Forecast, by Application 2019 & 2032
- Table 24: Peru Americas Precision Ag Software Industry Revenue (Million) Forecast, by Application 2019 & 2032
Frequently Asked Questions
1. What is the projected Compound Annual Growth Rate (CAGR) of the Americas Precision Ag Software Industry?
The projected CAGR is approximately 17.00%.
2. Which companies are prominent players in the Americas Precision Ag Software Industry?
Key companies in the market include Deere & Company, IBM Corporation, AGCO Corporation, AG Leader Technology Inc, Taranis Inc, AGJunction Inc, Harris Geospatial Solutions Inc *List Not Exhaustive, Trimble Inc, AgDNA Technologies Inc, Granular Inc, Bayer CropScience AG.
3. What are the main segments of the Americas Precision Ag Software Industry?
The market segments include Type.
4. Can you provide details about the market size?
The market size is estimated to be USD XX Million as of 2022.
5. What are some drivers contributing to market growth?
; Adoption of Precision Technology in the Sustainable and Efficient Agriculture Sector in Americas; Shortage of Farm labor. Along with Increasing Farm Size Across North America.
6. What are the notable trends driving market growth?
Cloud-based Precision Farming Software is Expected to Grow Significantly.
7. Are there any restraints impacting market growth?
; High Capital Cost and Complexity Regarding System Upgrades.
8. Can you provide examples of recent developments in the market?
N/A
9. What pricing options are available for accessing the report?
Pricing options include single-user, multi-user, and enterprise licenses priced at USD 4750, USD 4950, and USD 6800 respectively.
10. Is the market size provided in terms of value or volume?
The market size is provided in terms of value, measured in Million.
11. Are there any specific market keywords associated with the report?
Yes, the market keyword associated with the report is "Americas Precision Ag Software Industry," which aids in identifying and referencing the specific market segment covered.
12. How do I determine which pricing option suits my needs best?
The pricing options vary based on user requirements and access needs. Individual users may opt for single-user licenses, while businesses requiring broader access may choose multi-user or enterprise licenses for cost-effective access to the report.
13. Are there any additional resources or data provided in the Americas Precision Ag Software Industry report?
While the report offers comprehensive insights, it's advisable to review the specific contents or supplementary materials provided to ascertain if additional resources or data are available.
14. How can I stay updated on further developments or reports in the Americas Precision Ag Software Industry?
To stay informed about further developments, trends, and reports in the Americas Precision Ag Software Industry, consider subscribing to industry newsletters, following relevant companies and organizations, or regularly checking reputable industry news sources and publications.
Methodology
Step 1 - Identification of Relevant Samples Size from Population Database


Step 2 - Approaches for Defining Global Market Size (Value, Volume* & Price*)

Note*: In applicable scenarios
Step 3 - Data Sources
Primary Research
- Web Analytics
- Survey Reports
- Research Institute
- Latest Research Reports
- Opinion Leaders
Secondary Research
- Annual Reports
- White Paper
- Latest Press Release
- Industry Association
- Paid Database
- Investor Presentations

Step 4 - Data Triangulation
Involves using different sources of information in order to increase the validity of a study
These sources are likely to be stakeholders in a program - participants, other researchers, program staff, other community members, and so on.
Then we put all data in single framework & apply various statistical tools to find out the dynamic on the market.
During the analysis stage, feedback from the stakeholder groups would be compared to determine areas of agreement as well as areas of divergence


