

Key Insights
The global road safety market is projected to reach $7.14 billion by 2025, with a compound annual growth rate (CAGR) of 11.3% from 2025 to 2033. This significant expansion is driven by increasing government investments in road infrastructure and stricter traffic regulations. The widespread adoption of Advanced Driver-Assistance Systems (ADAS) and Intelligent Transportation Systems (ITS) further bolsters market growth. Technological innovations, including AI and machine learning in traffic management and the rise of connected vehicles, are enhancing road safety efficacy. Growing public awareness and demand for safer commutes present substantial market opportunities.
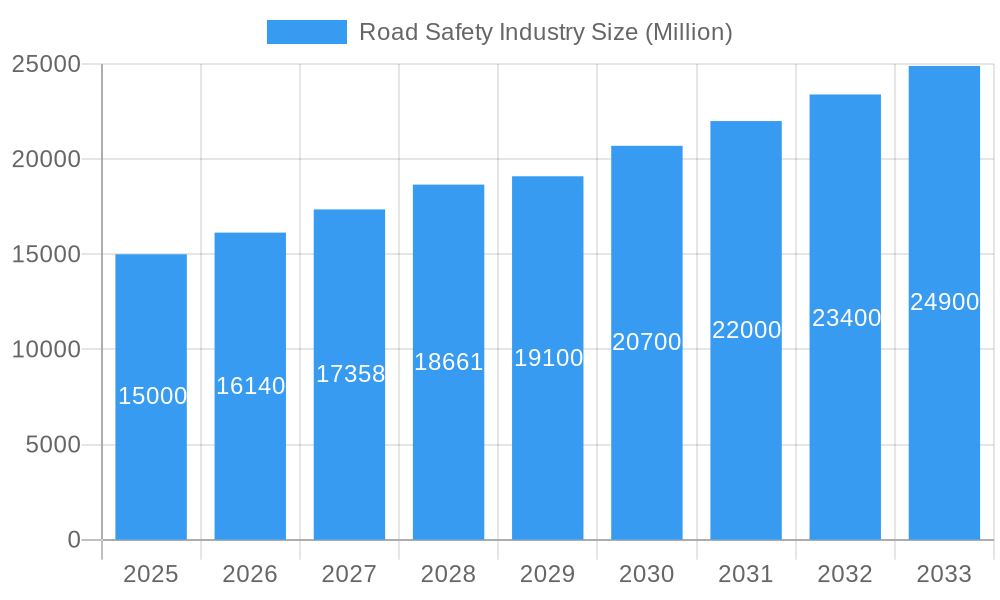
Road Safety Industry Market Size (In Billion)
The market is segmented by solution: Red Light Enforcement, Speed Enforcement, Bus Lane Enforcement, Section Enforcement, and Incident Detection & Response. Services include Consulting, Support & Maintenance, and Integration & Deployment. North America and Europe currently dominate market share due to high technology adoption and stringent regulations. Asia-Pacific is anticipated to be a high-growth region, driven by rapid urbanization and infrastructure development.
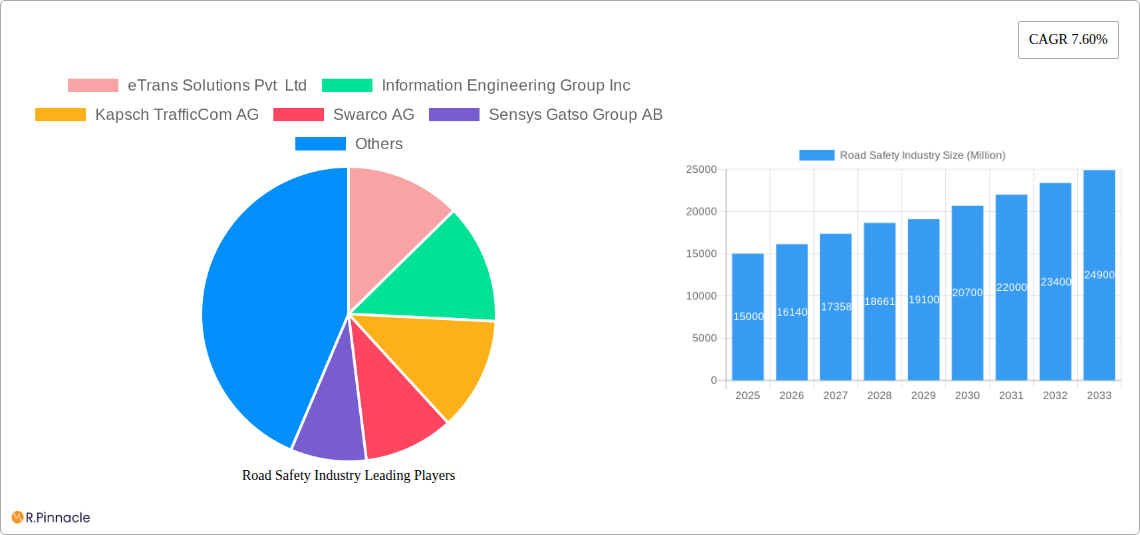
Road Safety Industry Company Market Share
Key restraints include high initial investment costs for advanced solutions, potentially limiting adoption in developing economies, and data privacy concerns related to traffic data. The complexity of integrating diverse technologies can also hinder widespread implementation. Despite these challenges, the long-term growth trajectory for road safety remains robust, prioritizing accident reduction and overall traffic safety improvement.
The road safety industry is highly competitive, with key players like eTrans Solutions, Kapsch TrafficCom, Swarco, and Sensys Gatso consistently innovating their offerings to meet evolving market demands.
Road Safety Industry Market Report: 2025-2033 Overview
This report offers a detailed analysis of the global road safety industry, providing critical insights for professionals, investors, and policymakers. It covers the period 2025-2033, featuring current market dynamics and future projections. Expect granular segmentation by solution (Red Light Enforcement, Speed Enforcement, Bus Lane Enforcement & Section Enforcement, Incident Detection & Response) and services (Consulting, Support & Maintenance, Integration & Deployment). Market size estimations are detailed. Gain a competitive edge by downloading this essential industry analysis.
Road Safety Industry Market Structure & Innovation Trends
This section analyzes the competitive landscape of the road safety industry, encompassing market concentration, innovation drivers, regulatory influences, and strategic activities like mergers and acquisitions (M&A). The global market is characterized by a moderately concentrated structure, with several major players commanding significant market share. While exact market share figures for each company require further analysis within the full report, we can predict that players like Kapsch TrafficCom AG, Swarco AG, and Sensys Gatso Group AB hold substantial portions. M&A activity has been significant, with deal values reaching into the hundreds of millions of USD over the study period (2019-2024), primarily driven by the desire to expand geographic reach and product portfolios.
- Market Concentration: Moderately concentrated, with several large players dominating.
- Innovation Drivers: Stringent safety regulations, technological advancements (AI, IoT), increasing urbanization, and demand for improved traffic management.
- Regulatory Frameworks: Vary significantly across regions, influencing market entry and product standards.
- Product Substitutes: Limited direct substitutes, but alternative solutions for traffic management are emerging.
- End-User Demographics: Primarily government agencies (local, regional, national), but also private companies managing infrastructure.
- M&A Activity: Significant activity with deal values predicted at over $XX million USD in the period 2019-2024.
Road Safety Industry Market Dynamics & Trends
The global road safety industry is experiencing robust growth, driven by several key factors. Government initiatives to improve road safety, technological advancements in detection and enforcement technologies, and rising awareness of road safety issues contribute to an expanding market. The market is expected to exhibit a Compound Annual Growth Rate (CAGR) of xx% during the forecast period (2025-2033), with market penetration increasing as adoption of advanced solutions grows across regions. Technological disruptions, such as the integration of artificial intelligence (AI) and machine learning (ML), are reshaping the industry, leading to more efficient and effective road safety solutions. Consumer preferences are shifting towards intelligent, data-driven systems offering real-time insights and improved safety outcomes. Competitive dynamics are intense, characterized by innovation, strategic partnerships, and acquisitions.
Dominant Regions & Segments in Road Safety Industry
North America and Europe currently dominate the road safety industry, driven by robust infrastructure development and stringent safety regulations. Within these regions, certain countries, such as the US and Germany, exhibit particularly strong growth. The Red Light and Speed Enforcement segments represent significant portions of the market, followed by Incident Detection and Response, and other solutions. The Consulting and Support and Maintenance service segments remain strong.
- Key Drivers in Dominant Regions:
- North America: Strong government investment in infrastructure, advanced technology adoption.
- Europe: Stringent safety regulations, high level of urbanization.
- Asia-Pacific: Increasing urbanization, growing government spending on infrastructure.
- Dominant Segments: Red Light Enforcement and Speed Enforcement are currently the largest segments due to high demand and established technology.
Road Safety Industry Product Innovations
Recent product innovations focus on integrating AI, IoT, and cloud computing into road safety systems. This trend is allowing for real-time data analytics, predictive modeling, and improved decision-making in traffic management. New products offering increased accuracy, efficiency, and integration with existing infrastructure are gaining traction, providing competitive advantages to manufacturers. These smart solutions meet the growing demand for proactive safety measures and optimize traffic flow.
Report Scope & Segmentation Analysis
This report segments the road safety industry by solution (Red Light Enforcement, Speed Enforcement, Bus Lane Enforcement & Section Enforcement, Incident Detection & Response) and by service (Consulting, Support & Maintenance, Integration & Deployment). Each segment's growth projections, market sizes, and competitive dynamics are thoroughly analyzed.
- By Solution: Each solution segment exhibits varying growth rates, driven by technological advancements and government regulations.
- By Service: The consulting and support and maintenance segments show steady growth, reflecting increasing demand for expertise and ongoing system support.
Key Drivers of Road Safety Industry Growth
Several factors are driving the growth of the road safety industry. These include stringent government regulations mandating safety improvements, increasing urbanization leading to higher traffic density, technological advancements resulting in more sophisticated solutions, and growing public awareness of road safety issues. Government initiatives to reduce accidents and improve traffic efficiency contribute significantly to market expansion.
Challenges in the Road Safety Industry Sector
The road safety industry faces various challenges, including high upfront costs for implementation of advanced technologies, the complexity of integrating new systems with existing infrastructure, maintaining and updating aging systems, and managing cybersecurity risks. Supply chain disruptions and geopolitical instability affect material availability and project timelines. Intense competition also impacts profitability.
Emerging Opportunities in Road Safety Industry
Opportunities exist in developing and deploying AI-powered solutions, integrating smart city initiatives into traffic management systems, focusing on data analytics for preventative measures, expanding into emerging markets, and addressing specific safety concerns (pedestrian safety, cyclist safety). The development of eco-friendly and sustainable solutions in the road safety sector will also create opportunities.
Leading Players in the Road Safety Industry Market
- eTrans Solutions Pvt Ltd
- Information Engineering Group Inc
- Kapsch TrafficCom AG
- Swarco AG
- Sensys Gatso Group AB
- Motorola
- Jenoptik AG
- VITRONIC
- Redflex Holdings Limited
- Conduent Business Services LLC
- FRED Engineering
- Clearview Intelligence Limited
- FLIR Systems Inc
- Connected Wise LLC
Key Developments in Road Safety Industry
- March 2022: The world's smartest traffic management system debuts in Melbourne, leveraging AI and real-time data to improve traffic flow and safety.
- March 2022: Sensys Gatso Group secures a USD 575,000 contract with the Belgian Walloon government for traffic enforcement products and services.
Future Outlook for Road Safety Industry Market
The road safety industry is poised for sustained growth, driven by ongoing technological advancements, increased government investment, and a growing emphasis on improving road safety globally. Strategic partnerships, innovations in AI and data analytics, and expansion into new markets will be key success factors in the coming years. The market is projected to witness significant expansion, particularly in developing economies, with opportunities for both established players and new entrants.
Road Safety Industry Segmentation
-
1. Solution
- 1.1. Red Light Enforcement
- 1.2. Speed Enforcement
- 1.3. Bus Lane Enforcement and Section Enforcement
- 1.4. Incident Detection and Response
-
2. Services
- 2.1. Consulting
- 2.2. Support and Maintenance
- 2.3. Integration and Deployment
Road Safety Industry Segmentation By Geography
-
1. North America
- 1.1. United States
- 1.2. Canada
-
2. Europe
- 2.1. United Kingdom
- 2.2. France
- 2.3. Germany
- 2.4. Rest of Europe
-
3. Asia Pacific
- 3.1. China
- 3.2. India
- 3.3. Japan
- 3.4. Rest of Asia Pacific
- 4. Latin America
- 5. Middle East and Africa
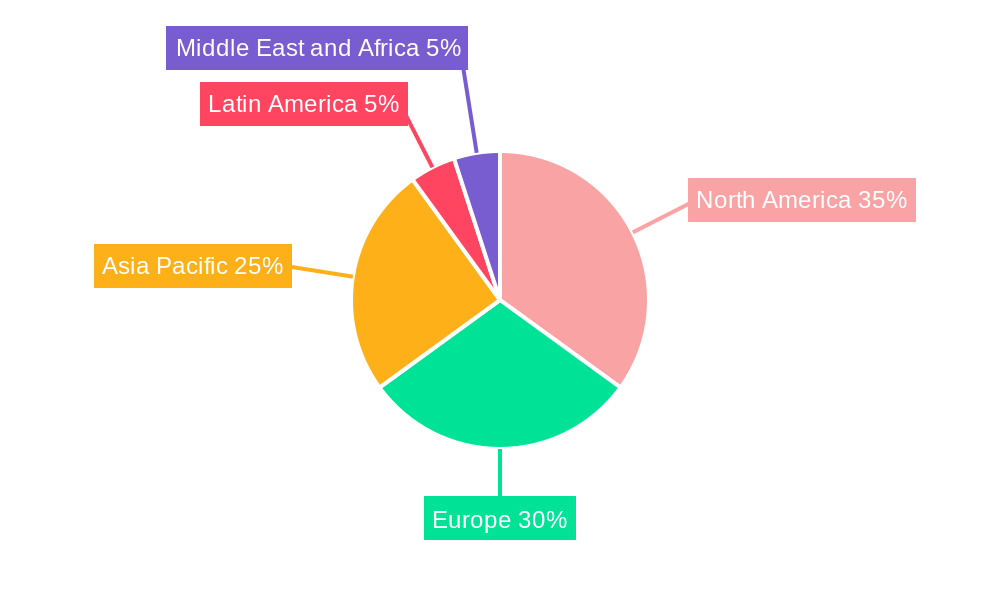
Road Safety Industry Regional Market Share
Geographic Coverage of Road Safety Industry
Road Safety Industry REPORT HIGHLIGHTS
| Aspects | Details |
|---|---|
| Study Period | 2020-2034 |
| Base Year | 2025 |
| Estimated Year | 2026 |
| Forecast Period | 2026-2034 |
| Historical Period | 2020-2025 |
| Growth Rate | CAGR of 11.3% from 2020-2034 |
| Segmentation |
|
Table of Contents
- 1. Introduction
- 1.1. Research Scope
- 1.2. Market Segmentation
- 1.3. Research Objective
- 1.4. Definitions and Assumptions
- 2. Executive Summary
- 2.1. Market Snapshot
- 3. Market Dynamics
- 3.1. Market Drivers
- 3.2. Market Restrains
- 3.3. Market Trends
- 3.4. Market Opportunities
- 4. Market Factor Analysis
- 4.1. Porters Five Forces
- 4.1.1. Bargaining Power of Suppliers
- 4.1.2. Bargaining Power of Buyers
- 4.1.3. Threat of New Entrants
- 4.1.4. Threat of Substitutes
- 4.1.5. Competitive Rivalry
- 4.2. PESTEL analysis
- 4.3. BCG Analysis
- 4.3.1. Stars (High Growth, High Market Share)
- 4.3.2. Cash Cows (Low Growth, High Market Share)
- 4.3.3. Question Mark (High Growth, Low Market Share)
- 4.3.4. Dogs (Low Growth, Low Market Share)
- 4.4. Ansoff Matrix Analysis
- 4.5. Supply Chain Analysis
- 4.6. Regulatory Landscape
- 4.7. Current Market Potential and Opportunity Assessment (TAM–SAM–SOM Framework)
- 4.8. PRI Analyst Note
- 4.1. Porters Five Forces
- 5. Market Analysis, Insights and Forecast 2021-2033
- 5.1. Market Analysis, Insights and Forecast - by Solution
- 5.1.1. Red Light Enforcement
- 5.1.2. Speed Enforcement
- 5.1.3. Bus Lane Enforcement and Section Enforcement
- 5.1.4. Incident Detection and Response
- 5.2. Market Analysis, Insights and Forecast - by Services
- 5.2.1. Consulting
- 5.2.2. Support and Maintenance
- 5.2.3. Integration and Deployment
- 5.3. Market Analysis, Insights and Forecast - by Region
- 5.3.1. North America
- 5.3.2. Europe
- 5.3.3. Asia Pacific
- 5.3.4. Latin America
- 5.3.5. Middle East and Africa
- 5.1. Market Analysis, Insights and Forecast - by Solution
- 6. Global Road Safety Industry Analysis, Insights and Forecast, 2021-2033
- 6.1. Market Analysis, Insights and Forecast - by Solution
- 6.1.1. Red Light Enforcement
- 6.1.2. Speed Enforcement
- 6.1.3. Bus Lane Enforcement and Section Enforcement
- 6.1.4. Incident Detection and Response
- 6.2. Market Analysis, Insights and Forecast - by Services
- 6.2.1. Consulting
- 6.2.2. Support and Maintenance
- 6.2.3. Integration and Deployment
- 6.1. Market Analysis, Insights and Forecast - by Solution
- 7. North America Road Safety Industry Analysis, Insights and Forecast, 2020-2032
- 7.1. Market Analysis, Insights and Forecast - by Solution
- 7.1.1. Red Light Enforcement
- 7.1.2. Speed Enforcement
- 7.1.3. Bus Lane Enforcement and Section Enforcement
- 7.1.4. Incident Detection and Response
- 7.2. Market Analysis, Insights and Forecast - by Services
- 7.2.1. Consulting
- 7.2.2. Support and Maintenance
- 7.2.3. Integration and Deployment
- 7.1. Market Analysis, Insights and Forecast - by Solution
- 8. Europe Road Safety Industry Analysis, Insights and Forecast, 2020-2032
- 8.1. Market Analysis, Insights and Forecast - by Solution
- 8.1.1. Red Light Enforcement
- 8.1.2. Speed Enforcement
- 8.1.3. Bus Lane Enforcement and Section Enforcement
- 8.1.4. Incident Detection and Response
- 8.2. Market Analysis, Insights and Forecast - by Services
- 8.2.1. Consulting
- 8.2.2. Support and Maintenance
- 8.2.3. Integration and Deployment
- 8.1. Market Analysis, Insights and Forecast - by Solution
- 9. Asia Pacific Road Safety Industry Analysis, Insights and Forecast, 2020-2032
- 9.1. Market Analysis, Insights and Forecast - by Solution
- 9.1.1. Red Light Enforcement
- 9.1.2. Speed Enforcement
- 9.1.3. Bus Lane Enforcement and Section Enforcement
- 9.1.4. Incident Detection and Response
- 9.2. Market Analysis, Insights and Forecast - by Services
- 9.2.1. Consulting
- 9.2.2. Support and Maintenance
- 9.2.3. Integration and Deployment
- 9.1. Market Analysis, Insights and Forecast - by Solution
- 10. Latin America Road Safety Industry Analysis, Insights and Forecast, 2020-2032
- 10.1. Market Analysis, Insights and Forecast - by Solution
- 10.1.1. Red Light Enforcement
- 10.1.2. Speed Enforcement
- 10.1.3. Bus Lane Enforcement and Section Enforcement
- 10.1.4. Incident Detection and Response
- 10.2. Market Analysis, Insights and Forecast - by Services
- 10.2.1. Consulting
- 10.2.2. Support and Maintenance
- 10.2.3. Integration and Deployment
- 10.1. Market Analysis, Insights and Forecast - by Solution
- 11. Middle East and Africa Road Safety Industry Analysis, Insights and Forecast, 2020-2032
- 11.1. Market Analysis, Insights and Forecast - by Solution
- 11.1.1. Red Light Enforcement
- 11.1.2. Speed Enforcement
- 11.1.3. Bus Lane Enforcement and Section Enforcement
- 11.1.4. Incident Detection and Response
- 11.2. Market Analysis, Insights and Forecast - by Services
- 11.2.1. Consulting
- 11.2.2. Support and Maintenance
- 11.2.3. Integration and Deployment
- 11.1. Market Analysis, Insights and Forecast - by Solution
- 12. Competitive Analysis
- 12.1. Company Profiles
- 12.1.1 eTrans Solutions Pvt Ltd
- 12.1.1.1. Company Overview
- 12.1.1.2. Products
- 12.1.1.3. Company Financials
- 12.1.1.4. SWOT Analysis
- 12.1.2 Information Engineering Group Inc
- 12.1.2.1. Company Overview
- 12.1.2.2. Products
- 12.1.2.3. Company Financials
- 12.1.2.4. SWOT Analysis
- 12.1.3 Kapsch TrafficCom AG
- 12.1.3.1. Company Overview
- 12.1.3.2. Products
- 12.1.3.3. Company Financials
- 12.1.3.4. SWOT Analysis
- 12.1.4 Swarco AG
- 12.1.4.1. Company Overview
- 12.1.4.2. Products
- 12.1.4.3. Company Financials
- 12.1.4.4. SWOT Analysis
- 12.1.5 Sensys Gatso Group AB
- 12.1.5.1. Company Overview
- 12.1.5.2. Products
- 12.1.5.3. Company Financials
- 12.1.5.4. SWOT Analysis
- 12.1.6 Motorola
- 12.1.6.1. Company Overview
- 12.1.6.2. Products
- 12.1.6.3. Company Financials
- 12.1.6.4. SWOT Analysis
- 12.1.7 Jenoptik AG
- 12.1.7.1. Company Overview
- 12.1.7.2. Products
- 12.1.7.3. Company Financials
- 12.1.7.4. SWOT Analysis
- 12.1.8 VITRONIC
- 12.1.8.1. Company Overview
- 12.1.8.2. Products
- 12.1.8.3. Company Financials
- 12.1.8.4. SWOT Analysis
- 12.1.9 Redflex Holdings Limited
- 12.1.9.1. Company Overview
- 12.1.9.2. Products
- 12.1.9.3. Company Financials
- 12.1.9.4. SWOT Analysis
- 12.1.10 Conduent Business Services LLC
- 12.1.10.1. Company Overview
- 12.1.10.2. Products
- 12.1.10.3. Company Financials
- 12.1.10.4. SWOT Analysis
- 12.1.11 FRED Engineering
- 12.1.11.1. Company Overview
- 12.1.11.2. Products
- 12.1.11.3. Company Financials
- 12.1.11.4. SWOT Analysis
- 12.1.12 Clearview Intelligence Limited*List Not Exhaustive
- 12.1.12.1. Company Overview
- 12.1.12.2. Products
- 12.1.12.3. Company Financials
- 12.1.12.4. SWOT Analysis
- 12.1.13 FLIR Systems Inc
- 12.1.13.1. Company Overview
- 12.1.13.2. Products
- 12.1.13.3. Company Financials
- 12.1.13.4. SWOT Analysis
- 12.1.14 Connected Wise LLC
- 12.1.14.1. Company Overview
- 12.1.14.2. Products
- 12.1.14.3. Company Financials
- 12.1.14.4. SWOT Analysis
- 12.1.1 eTrans Solutions Pvt Ltd
- 12.2. Market Entropy
- 12.2.1 Company's Key Areas Served
- 12.2.2 Recent Developments
- 12.3. Company Market Share Analysis 2025
- 12.3.1 Top 5 Companies Market Share Analysis
- 12.3.2 Top 3 Companies Market Share Analysis
- 12.4. List of Potential Customers
- 13. Research Methodology
List of Figures
- Figure 1: Global Road Safety Industry Revenue Breakdown (billion, %) by Region 2025 & 2033
- Figure 2: North America Road Safety Industry Revenue (billion), by Solution 2025 & 2033
- Figure 3: North America Road Safety Industry Revenue Share (%), by Solution 2025 & 2033
- Figure 4: North America Road Safety Industry Revenue (billion), by Services 2025 & 2033
- Figure 5: North America Road Safety Industry Revenue Share (%), by Services 2025 & 2033
- Figure 6: North America Road Safety Industry Revenue (billion), by Country 2025 & 2033
- Figure 7: North America Road Safety Industry Revenue Share (%), by Country 2025 & 2033
- Figure 8: Europe Road Safety Industry Revenue (billion), by Solution 2025 & 2033
- Figure 9: Europe Road Safety Industry Revenue Share (%), by Solution 2025 & 2033
- Figure 10: Europe Road Safety Industry Revenue (billion), by Services 2025 & 2033
- Figure 11: Europe Road Safety Industry Revenue Share (%), by Services 2025 & 2033
- Figure 12: Europe Road Safety Industry Revenue (billion), by Country 2025 & 2033
- Figure 13: Europe Road Safety Industry Revenue Share (%), by Country 2025 & 2033
- Figure 14: Asia Pacific Road Safety Industry Revenue (billion), by Solution 2025 & 2033
- Figure 15: Asia Pacific Road Safety Industry Revenue Share (%), by Solution 2025 & 2033
- Figure 16: Asia Pacific Road Safety Industry Revenue (billion), by Services 2025 & 2033
- Figure 17: Asia Pacific Road Safety Industry Revenue Share (%), by Services 2025 & 2033
- Figure 18: Asia Pacific Road Safety Industry Revenue (billion), by Country 2025 & 2033
- Figure 19: Asia Pacific Road Safety Industry Revenue Share (%), by Country 2025 & 2033
- Figure 20: Latin America Road Safety Industry Revenue (billion), by Solution 2025 & 2033
- Figure 21: Latin America Road Safety Industry Revenue Share (%), by Solution 2025 & 2033
- Figure 22: Latin America Road Safety Industry Revenue (billion), by Services 2025 & 2033
- Figure 23: Latin America Road Safety Industry Revenue Share (%), by Services 2025 & 2033
- Figure 24: Latin America Road Safety Industry Revenue (billion), by Country 2025 & 2033
- Figure 25: Latin America Road Safety Industry Revenue Share (%), by Country 2025 & 2033
- Figure 26: Middle East and Africa Road Safety Industry Revenue (billion), by Solution 2025 & 2033
- Figure 27: Middle East and Africa Road Safety Industry Revenue Share (%), by Solution 2025 & 2033
- Figure 28: Middle East and Africa Road Safety Industry Revenue (billion), by Services 2025 & 2033
- Figure 29: Middle East and Africa Road Safety Industry Revenue Share (%), by Services 2025 & 2033
- Figure 30: Middle East and Africa Road Safety Industry Revenue (billion), by Country 2025 & 2033
- Figure 31: Middle East and Africa Road Safety Industry Revenue Share (%), by Country 2025 & 2033
List of Tables
- Table 1: Global Road Safety Industry Revenue billion Forecast, by Solution 2020 & 2033
- Table 2: Global Road Safety Industry Revenue billion Forecast, by Services 2020 & 2033
- Table 3: Global Road Safety Industry Revenue billion Forecast, by Region 2020 & 2033
- Table 4: Global Road Safety Industry Revenue billion Forecast, by Solution 2020 & 2033
- Table 5: Global Road Safety Industry Revenue billion Forecast, by Services 2020 & 2033
- Table 6: Global Road Safety Industry Revenue billion Forecast, by Country 2020 & 2033
- Table 7: United States Road Safety Industry Revenue (billion) Forecast, by Application 2020 & 2033
- Table 8: Canada Road Safety Industry Revenue (billion) Forecast, by Application 2020 & 2033
- Table 9: Global Road Safety Industry Revenue billion Forecast, by Solution 2020 & 2033
- Table 10: Global Road Safety Industry Revenue billion Forecast, by Services 2020 & 2033
- Table 11: Global Road Safety Industry Revenue billion Forecast, by Country 2020 & 2033
- Table 12: United Kingdom Road Safety Industry Revenue (billion) Forecast, by Application 2020 & 2033
- Table 13: France Road Safety Industry Revenue (billion) Forecast, by Application 2020 & 2033
- Table 14: Germany Road Safety Industry Revenue (billion) Forecast, by Application 2020 & 2033
- Table 15: Rest of Europe Road Safety Industry Revenue (billion) Forecast, by Application 2020 & 2033
- Table 16: Global Road Safety Industry Revenue billion Forecast, by Solution 2020 & 2033
- Table 17: Global Road Safety Industry Revenue billion Forecast, by Services 2020 & 2033
- Table 18: Global Road Safety Industry Revenue billion Forecast, by Country 2020 & 2033
- Table 19: China Road Safety Industry Revenue (billion) Forecast, by Application 2020 & 2033
- Table 20: India Road Safety Industry Revenue (billion) Forecast, by Application 2020 & 2033
- Table 21: Japan Road Safety Industry Revenue (billion) Forecast, by Application 2020 & 2033
- Table 22: Rest of Asia Pacific Road Safety Industry Revenue (billion) Forecast, by Application 2020 & 2033
- Table 23: Global Road Safety Industry Revenue billion Forecast, by Solution 2020 & 2033
- Table 24: Global Road Safety Industry Revenue billion Forecast, by Services 2020 & 2033
- Table 25: Global Road Safety Industry Revenue billion Forecast, by Country 2020 & 2033
- Table 26: Global Road Safety Industry Revenue billion Forecast, by Solution 2020 & 2033
- Table 27: Global Road Safety Industry Revenue billion Forecast, by Services 2020 & 2033
- Table 28: Global Road Safety Industry Revenue billion Forecast, by Country 2020 & 2033
Frequently Asked Questions
1. What is the projected Compound Annual Growth Rate (CAGR) of the Road Safety Industry?
The projected CAGR is approximately 11.3%.
2. Which companies are prominent players in the Road Safety Industry?
Key companies in the market include eTrans Solutions Pvt Ltd, Information Engineering Group Inc, Kapsch TrafficCom AG, Swarco AG, Sensys Gatso Group AB, Motorola, Jenoptik AG, VITRONIC, Redflex Holdings Limited, Conduent Business Services LLC, FRED Engineering, Clearview Intelligence Limited*List Not Exhaustive, FLIR Systems Inc, Connected Wise LLC.
3. What are the main segments of the Road Safety Industry?
The market segments include Solution, Services.
4. Can you provide details about the market size?
The market size is estimated to be USD 7.14 billion as of 2022.
5. What are some drivers contributing to market growth?
Increasing Number of Road Accidents and Fatalities; Increasing Need for Public Security and Improvement; Government Initiatives to Enhance Road Safety.
6. What are the notable trends driving market growth?
The surge in the Number of Road Accidents and Fatalities Gain Momentum in the Market..
7. Are there any restraints impacting market growth?
High Capital Investment due to Implementation of New Technologies; Risk and Congestion Associated with Trade Routes.
8. Can you provide examples of recent developments in the market?
March 2022 - The world's smartest traffic management system debuts in Melbourne, equipped with cutting-edge technology to minimize traffic congestion and increase road safety. The Intelligent Corridor, which will run for 2.5 kilometers along Nicholson Street between Alexandra and Victoria Parades, will use sensors, cloud-based AI, machine learning algorithms, predictive models, and real-time data capture to improve traffic management, ease congestion, improve road safety for cars, pedestrians, and cyclists, and to lower emissions from congested traffic.
9. What pricing options are available for accessing the report?
Pricing options include single-user, multi-user, and enterprise licenses priced at USD 4750, USD 5250, and USD 8750 respectively.
10. Is the market size provided in terms of value or volume?
The market size is provided in terms of value, measured in billion.
11. Are there any specific market keywords associated with the report?
Yes, the market keyword associated with the report is "Road Safety Industry," which aids in identifying and referencing the specific market segment covered.
12. How do I determine which pricing option suits my needs best?
The pricing options vary based on user requirements and access needs. Individual users may opt for single-user licenses, while businesses requiring broader access may choose multi-user or enterprise licenses for cost-effective access to the report.
13. Are there any additional resources or data provided in the Road Safety Industry report?
While the report offers comprehensive insights, it's advisable to review the specific contents or supplementary materials provided to ascertain if additional resources or data are available.
14. How can I stay updated on further developments or reports in the Road Safety Industry?
To stay informed about further developments, trends, and reports in the Road Safety Industry, consider subscribing to industry newsletters, following relevant companies and organizations, or regularly checking reputable industry news sources and publications.
Methodology
Step 1 - Identification of Relevant Samples Size from Population Database


Step 2 - Approaches for Defining Global Market Size (Value, Volume* & Price*)

Note*: In applicable scenarios
Step 3 - Data Sources
Primary Research
- Web Analytics
- Survey Reports
- Research Institute
- Latest Research Reports
- Opinion Leaders
Secondary Research
- Annual Reports
- White Paper
- Latest Press Release
- Industry Association
- Paid Database
- Investor Presentations

Step 4 - Data Triangulation
Involves using different sources of information in order to increase the validity of a study
These sources are likely to be stakeholders in a program - participants, other researchers, program staff, other community members, and so on.
Then we put all data in single framework & apply various statistical tools to find out the dynamic on the market.
During the analysis stage, feedback from the stakeholder groups would be compared to determine areas of agreement as well as areas of divergence