
Key Insights
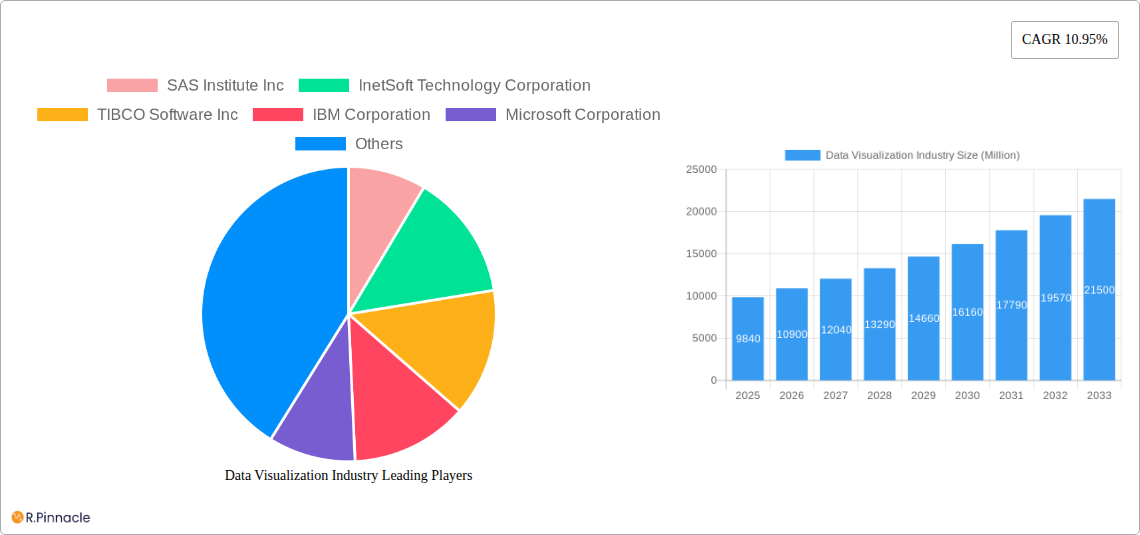
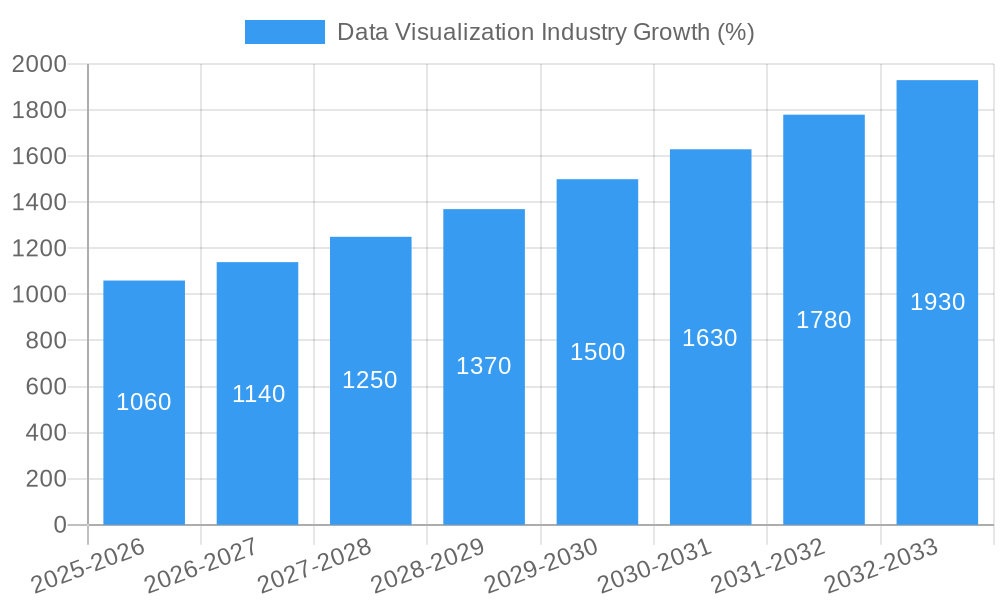
The global data visualization market, currently valued at $9.84 billion in 2025, is projected to experience robust growth, driven by the increasing need for businesses to derive actionable insights from their vast data stores. A compound annual growth rate (CAGR) of 10.95% from 2025 to 2033 indicates a significant expansion, reaching an estimated $26.7 billion by 2033. Key drivers include the rising adoption of cloud-based solutions offering scalability and cost-effectiveness, the growing demand for real-time data analytics across various industries (BFSI, IT, retail, etc.), and the increasing sophistication of data visualization tools catering to both technical and non-technical users. The market is segmented by organizational department (executive management, marketing, operations, finance, sales, etc.), deployment mode (on-premise, cloud/on-demand), and end-user industry. The cloud/on-demand segment is expected to dominate due to its flexibility and accessibility. While the BFSI and IT sectors currently lead in adoption, substantial growth is anticipated from retail/e-commerce and manufacturing sectors seeking improved operational efficiency and data-driven decision-making. Competitive forces are strong, with established players like SAS, IBM, Microsoft, and Tableau alongside emerging specialized vendors constantly innovating to meet evolving market needs. Restraints include the complexity of implementing data visualization solutions, the need for skilled personnel to manage and interpret visualizations, and data security concerns.
The continued growth trajectory hinges on several factors. Further advancements in artificial intelligence (AI) and machine learning (ML) are expected to enhance the automation and interpretation of visualizations. The rising adoption of big data analytics and the Internet of Things (IoT) will generate even larger datasets, further fueling the demand for effective visualization tools. Moreover, the increasing emphasis on data literacy and the availability of user-friendly tools will contribute to wider adoption across different organizational levels and industries. The market’s evolution will likely be characterized by a shift towards more interactive, immersive, and mobile-friendly visualization solutions tailored to specific business needs. The competitive landscape will remain dynamic, with ongoing mergers and acquisitions, as well as the emergence of innovative niche players specializing in particular sectors or data types.
This comprehensive report provides a detailed analysis of the Data Visualization industry, projecting a robust growth trajectory from 2025 to 2033. We delve into market structure, innovation trends, dominant segments, and key players, offering actionable insights for industry professionals and investors. The report covers a historical period of 2019-2024, utilizes 2025 as the base and estimated year, and forecasts market trends until 2033. The total market size is predicted to reach xx Million by 2033.
Data Visualization Industry Market Structure & Innovation Trends
The Data Visualization market, valued at xx Million in 2025, exhibits a moderately concentrated structure with several major players holding significant market share. SAS Institute Inc, IBM Corporation, and Microsoft Corporation are among the leading vendors, collectively accounting for an estimated xx% market share in 2025. However, the market is characterized by ongoing innovation, driven by factors such as the increasing volume and complexity of data, the demand for real-time analytics, and the proliferation of cloud-based solutions.
Key Innovation Drivers:
- Advancements in Artificial Intelligence (AI) and Machine Learning (ML) for automated data visualization and predictive analytics.
- Development of interactive and immersive visualization technologies, such as augmented reality (AR) and virtual reality (VR).
- Growing adoption of cloud-based data visualization platforms, offering scalability and accessibility.
Regulatory frameworks, while not overly restrictive, influence data privacy and security aspects, promoting compliance standards like GDPR and CCPA. Product substitutes, such as traditional reporting tools, are gradually losing ground due to the superior insights offered by data visualization solutions. The market has witnessed several significant M&A activities in recent years, with deal values exceeding xx Million. For example, Salesforce's acquisition of Tableau Software significantly impacted the market landscape. End-user demographics are shifting towards a broader adoption across various industries and organizational departments, fueling further growth.
Data Visualization Industry Market Dynamics & Trends
The Data Visualization market is experiencing robust growth, with a projected Compound Annual Growth Rate (CAGR) of xx% during the forecast period (2025-2033). This growth is driven by several key factors: the increasing availability of big data, the rising demand for data-driven decision-making, and the growing adoption of cloud computing. Technological disruptions, particularly the advancements in AI and ML, are transforming the industry, enabling automated insights and predictive capabilities. Consumer preferences are shifting towards user-friendly, interactive, and mobile-accessible visualization tools. Competitive dynamics remain intense, with major players investing heavily in R&D and strategic acquisitions to maintain their market positions. Market penetration is steadily increasing across various industries, further boosting market growth. The market is expected to reach xx Million by 2033, showing significant potential for expansion.
Dominant Regions & Segments in Data Visualization Industry
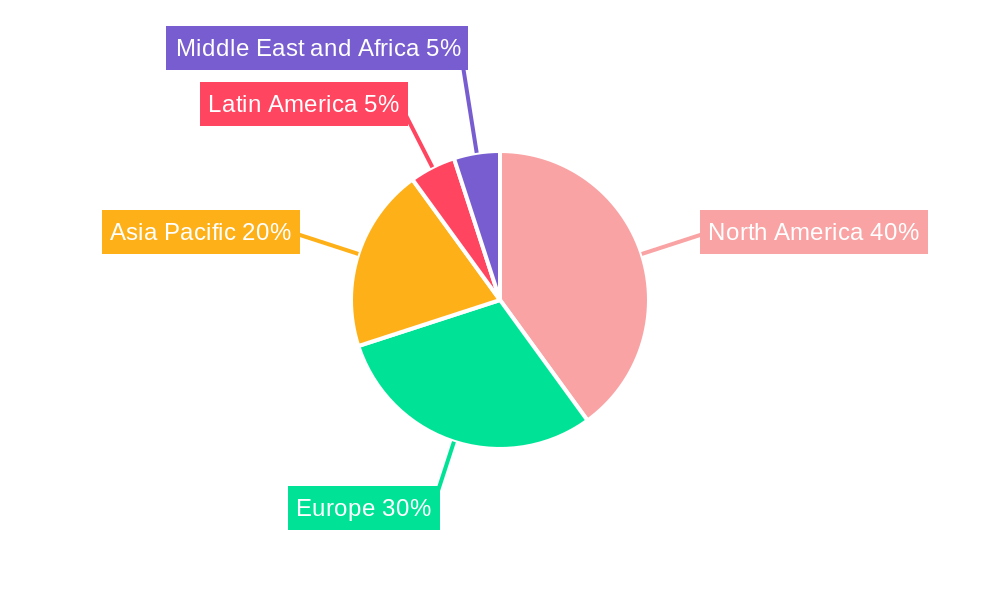
North America currently holds the dominant position in the Data Visualization market, driven by strong technological advancements, high adoption rates, and a well-established IT infrastructure. However, Asia Pacific is expected to witness significant growth in the coming years due to rapid digitalization and increasing investments in data analytics across various sectors.
Key Drivers of Regional Dominance:
- North America: Strong technological innovation, high adoption rates, and well-established IT infrastructure.
- Asia Pacific: Rapid digitalization, increasing investments in data analytics, and a large and growing population.
Dominant Segments:
- Organizational Department: Executive Management and Marketing departments are key adopters due to their dependence on quick insights for strategic planning and campaign performance analysis.
- Deployment Mode: Cloud/On-demand solutions are gaining traction over On-premise deployments due to scalability, cost-effectiveness, and accessibility.
- End User: BFSI (Banking, Financial Services, and Insurance) and IT & Telecommunication sectors lead due to their high reliance on data-driven decision-making and customer analytics.
Data Visualization Industry Product Innovations
Recent product innovations showcase a strong emphasis on AI-driven automation, enhanced interactivity, and cloud-based deployment. SymphonyAI Industrial's KPI 360 exemplifies AI integration for real-time data monitoring and prediction in manufacturing. INT's IVAAP platform underscores the advancement of subsurface data visualization for energy applications. These developments highlight the increasing market fit for solutions that provide comprehensive data insights in user-friendly formats, streamlining decision-making processes.
Report Scope & Segmentation Analysis
This report segments the Data Visualization market by Organizational Department (Executive Management, Marketing, Operations, Finance, Sales, Other), Deployment Mode (On-premise, Cloud/On-demand), and End User (BFSI, IT & Telecommunication, Retail/E-commerce, Education, Manufacturing, Government, Other). Each segment's growth projection, market size, and competitive dynamics are analyzed individually, providing a granular understanding of the market landscape. Detailed analysis of specific segments like Cloud-based deployment shows robust growth potential driven by scalability and accessibility, while the BFSI end-user segment demonstrates high adoption rates due to its increasing focus on data-driven decision-making.
Key Drivers of Data Visualization Industry Growth
Several factors are driving the growth of the Data Visualization industry:
- The exponential growth of data volume and complexity necessitates efficient visualization tools for insightful analysis.
- Businesses are increasingly leveraging data-driven decision-making to improve operational efficiency and gain a competitive edge.
- Advancements in AI and ML are enabling automated data insights and predictive analytics.
- The rising adoption of cloud computing offers scalability and accessibility to data visualization solutions.
Challenges in the Data Visualization Industry Sector
The industry faces challenges such as:
- Data security and privacy concerns related to the handling of sensitive data.
- Integration complexities with existing enterprise systems can hinder seamless data visualization.
- The need for skilled professionals capable of effectively utilizing data visualization tools.
- Competition from established players and emerging startups.
Emerging Opportunities in Data Visualization Industry
Emerging opportunities include:
- Expansion into new and untapped markets, such as healthcare and the public sector.
- Development of specialized data visualization solutions for niche industries.
- Integration of immersive visualization technologies, such as AR and VR.
- Leveraging AI and ML to enhance automated insights generation.
Leading Players in the Data Visualization Industry Market
- SAS Institute Inc
- InetSoft Technology Corporation
- TIBCO Software Inc
- IBM Corporation
- Microsoft Corporation
- Pentaho Corporation
- Dundas Data Visualization Inc
- Information Builders
- Oracle Corporation
- Salesforce com Inc (Tableau Software Inc )
- SAP SE
- MicroStrategy Inc *List Not Exhaustive
Key Developments in Data Visualization Industry
- September 2022: Launch of KPI 360 by SymphonyAI Industrial, an AI-driven solution for real-time data monitoring in manufacturing. This significantly improves operational efficiency and decision-making in the manufacturing sector.
- January 2022: Release of the updated IVAAP platform by INT, enhancing subsurface data visualization capabilities for the energy industry. This improves exploration, visualization, and computation of energy data.
Future Outlook for Data Visualization Industry Market
The Data Visualization market is poised for sustained growth, driven by continuous technological advancements, increasing data volumes, and the growing demand for data-driven decision-making across various sectors. Strategic opportunities exist for companies that can effectively integrate AI and ML capabilities, develop user-friendly and interactive solutions, and cater to the specific needs of niche industries. The market's future is bright, with significant potential for expansion and innovation in the years to come.
Data Visualization Industry Segmentation
-
1. Organizational Department
- 1.1. Executive Management
- 1.2. Marketing
- 1.3. Operations
- 1.4. Finance
- 1.5. Sales
- 1.6. Other Organizational Departments
-
2. Deployment Mode
- 2.1. On-premise
- 2.2. Cloud/On-demand
-
3. End User
- 3.1. BFSI
- 3.2. IT and Telecommunication
- 3.3. Retail/E-commerce
- 3.4. Education
- 3.5. Manufacturing
- 3.6. Government
- 3.7. Other End Users
Data Visualization Industry Segmentation By Geography
- 1. North America
- 2. Europe
- 3. Asia Pacific
- 4. Latin America
- 5. Middle East and Africa
Data Visualization Industry REPORT HIGHLIGHTS
| Aspects | Details |
|---|---|
| Study Period | 2019-2033 |
| Base Year | 2024 |
| Estimated Year | 2025 |
| Forecast Period | 2025-2033 |
| Historical Period | 2019-2024 |
| Growth Rate | CAGR of 10.95% from 2019-2033 |
| Segmentation |
|
Table of Contents
- 1. Introduction
- 1.1. Research Scope
- 1.2. Market Segmentation
- 1.3. Research Methodology
- 1.4. Definitions and Assumptions
- 2. Executive Summary
- 2.1. Introduction
- 3. Market Dynamics
- 3.1. Introduction
- 3.2. Market Drivers
- 3.2.1. Cloud Deployment of Data Visualization Solutions; Increasing Need for Quick Decision Making
- 3.3. Market Restrains
- 3.3.1. Lack of Tech Savvy and Skilled Workforce/Inability
- 3.4. Market Trends
- 3.4.1. Retail Segment to Witness Significant Growth
- 4. Market Factor Analysis
- 4.1. Porters Five Forces
- 4.2. Supply/Value Chain
- 4.3. PESTEL analysis
- 4.4. Market Entropy
- 4.5. Patent/Trademark Analysis
- 5. Global Data Visualization Industry Analysis, Insights and Forecast, 2019-2031
- 5.1. Market Analysis, Insights and Forecast - by Organizational Department
- 5.1.1. Executive Management
- 5.1.2. Marketing
- 5.1.3. Operations
- 5.1.4. Finance
- 5.1.5. Sales
- 5.1.6. Other Organizational Departments
- 5.2. Market Analysis, Insights and Forecast - by Deployment Mode
- 5.2.1. On-premise
- 5.2.2. Cloud/On-demand
- 5.3. Market Analysis, Insights and Forecast - by End User
- 5.3.1. BFSI
- 5.3.2. IT and Telecommunication
- 5.3.3. Retail/E-commerce
- 5.3.4. Education
- 5.3.5. Manufacturing
- 5.3.6. Government
- 5.3.7. Other End Users
- 5.4. Market Analysis, Insights and Forecast - by Region
- 5.4.1. North America
- 5.4.2. Europe
- 5.4.3. Asia Pacific
- 5.4.4. Latin America
- 5.4.5. Middle East and Africa
- 5.1. Market Analysis, Insights and Forecast - by Organizational Department
- 6. North America Data Visualization Industry Analysis, Insights and Forecast, 2019-2031
- 6.1. Market Analysis, Insights and Forecast - by Organizational Department
- 6.1.1. Executive Management
- 6.1.2. Marketing
- 6.1.3. Operations
- 6.1.4. Finance
- 6.1.5. Sales
- 6.1.6. Other Organizational Departments
- 6.2. Market Analysis, Insights and Forecast - by Deployment Mode
- 6.2.1. On-premise
- 6.2.2. Cloud/On-demand
- 6.3. Market Analysis, Insights and Forecast - by End User
- 6.3.1. BFSI
- 6.3.2. IT and Telecommunication
- 6.3.3. Retail/E-commerce
- 6.3.4. Education
- 6.3.5. Manufacturing
- 6.3.6. Government
- 6.3.7. Other End Users
- 6.1. Market Analysis, Insights and Forecast - by Organizational Department
- 7. Europe Data Visualization Industry Analysis, Insights and Forecast, 2019-2031
- 7.1. Market Analysis, Insights and Forecast - by Organizational Department
- 7.1.1. Executive Management
- 7.1.2. Marketing
- 7.1.3. Operations
- 7.1.4. Finance
- 7.1.5. Sales
- 7.1.6. Other Organizational Departments
- 7.2. Market Analysis, Insights and Forecast - by Deployment Mode
- 7.2.1. On-premise
- 7.2.2. Cloud/On-demand
- 7.3. Market Analysis, Insights and Forecast - by End User
- 7.3.1. BFSI
- 7.3.2. IT and Telecommunication
- 7.3.3. Retail/E-commerce
- 7.3.4. Education
- 7.3.5. Manufacturing
- 7.3.6. Government
- 7.3.7. Other End Users
- 7.1. Market Analysis, Insights and Forecast - by Organizational Department
- 8. Asia Pacific Data Visualization Industry Analysis, Insights and Forecast, 2019-2031
- 8.1. Market Analysis, Insights and Forecast - by Organizational Department
- 8.1.1. Executive Management
- 8.1.2. Marketing
- 8.1.3. Operations
- 8.1.4. Finance
- 8.1.5. Sales
- 8.1.6. Other Organizational Departments
- 8.2. Market Analysis, Insights and Forecast - by Deployment Mode
- 8.2.1. On-premise
- 8.2.2. Cloud/On-demand
- 8.3. Market Analysis, Insights and Forecast - by End User
- 8.3.1. BFSI
- 8.3.2. IT and Telecommunication
- 8.3.3. Retail/E-commerce
- 8.3.4. Education
- 8.3.5. Manufacturing
- 8.3.6. Government
- 8.3.7. Other End Users
- 8.1. Market Analysis, Insights and Forecast - by Organizational Department
- 9. Latin America Data Visualization Industry Analysis, Insights and Forecast, 2019-2031
- 9.1. Market Analysis, Insights and Forecast - by Organizational Department
- 9.1.1. Executive Management
- 9.1.2. Marketing
- 9.1.3. Operations
- 9.1.4. Finance
- 9.1.5. Sales
- 9.1.6. Other Organizational Departments
- 9.2. Market Analysis, Insights and Forecast - by Deployment Mode
- 9.2.1. On-premise
- 9.2.2. Cloud/On-demand
- 9.3. Market Analysis, Insights and Forecast - by End User
- 9.3.1. BFSI
- 9.3.2. IT and Telecommunication
- 9.3.3. Retail/E-commerce
- 9.3.4. Education
- 9.3.5. Manufacturing
- 9.3.6. Government
- 9.3.7. Other End Users
- 9.1. Market Analysis, Insights and Forecast - by Organizational Department
- 10. Middle East and Africa Data Visualization Industry Analysis, Insights and Forecast, 2019-2031
- 10.1. Market Analysis, Insights and Forecast - by Organizational Department
- 10.1.1. Executive Management
- 10.1.2. Marketing
- 10.1.3. Operations
- 10.1.4. Finance
- 10.1.5. Sales
- 10.1.6. Other Organizational Departments
- 10.2. Market Analysis, Insights and Forecast - by Deployment Mode
- 10.2.1. On-premise
- 10.2.2. Cloud/On-demand
- 10.3. Market Analysis, Insights and Forecast - by End User
- 10.3.1. BFSI
- 10.3.2. IT and Telecommunication
- 10.3.3. Retail/E-commerce
- 10.3.4. Education
- 10.3.5. Manufacturing
- 10.3.6. Government
- 10.3.7. Other End Users
- 10.1. Market Analysis, Insights and Forecast - by Organizational Department
- 11. North America Data Visualization Industry Analysis, Insights and Forecast, 2019-2031
- 11.1. Market Analysis, Insights and Forecast - By Country/Sub-region
- 11.1.1.
- 12. Europe Data Visualization Industry Analysis, Insights and Forecast, 2019-2031
- 12.1. Market Analysis, Insights and Forecast - By Country/Sub-region
- 12.1.1.
- 13. Asia Pacific Data Visualization Industry Analysis, Insights and Forecast, 2019-2031
- 13.1. Market Analysis, Insights and Forecast - By Country/Sub-region
- 13.1.1.
- 14. Latin America Data Visualization Industry Analysis, Insights and Forecast, 2019-2031
- 14.1. Market Analysis, Insights and Forecast - By Country/Sub-region
- 14.1.1.
- 15. Middle East and Africa Data Visualization Industry Analysis, Insights and Forecast, 2019-2031
- 15.1. Market Analysis, Insights and Forecast - By Country/Sub-region
- 15.1.1.
- 16. Competitive Analysis
- 16.1. Global Market Share Analysis 2024
- 16.2. Company Profiles
- 16.2.1 SAS Institute Inc
- 16.2.1.1. Overview
- 16.2.1.2. Products
- 16.2.1.3. SWOT Analysis
- 16.2.1.4. Recent Developments
- 16.2.1.5. Financials (Based on Availability)
- 16.2.2 InetSoft Technology Corporation
- 16.2.2.1. Overview
- 16.2.2.2. Products
- 16.2.2.3. SWOT Analysis
- 16.2.2.4. Recent Developments
- 16.2.2.5. Financials (Based on Availability)
- 16.2.3 TIBCO Software Inc
- 16.2.3.1. Overview
- 16.2.3.2. Products
- 16.2.3.3. SWOT Analysis
- 16.2.3.4. Recent Developments
- 16.2.3.5. Financials (Based on Availability)
- 16.2.4 IBM Corporation
- 16.2.4.1. Overview
- 16.2.4.2. Products
- 16.2.4.3. SWOT Analysis
- 16.2.4.4. Recent Developments
- 16.2.4.5. Financials (Based on Availability)
- 16.2.5 Microsoft Corporation
- 16.2.5.1. Overview
- 16.2.5.2. Products
- 16.2.5.3. SWOT Analysis
- 16.2.5.4. Recent Developments
- 16.2.5.5. Financials (Based on Availability)
- 16.2.6 Pentaho Corporation
- 16.2.6.1. Overview
- 16.2.6.2. Products
- 16.2.6.3. SWOT Analysis
- 16.2.6.4. Recent Developments
- 16.2.6.5. Financials (Based on Availability)
- 16.2.7 Dundas Data Visualization Inc
- 16.2.7.1. Overview
- 16.2.7.2. Products
- 16.2.7.3. SWOT Analysis
- 16.2.7.4. Recent Developments
- 16.2.7.5. Financials (Based on Availability)
- 16.2.8 Information Builders
- 16.2.8.1. Overview
- 16.2.8.2. Products
- 16.2.8.3. SWOT Analysis
- 16.2.8.4. Recent Developments
- 16.2.8.5. Financials (Based on Availability)
- 16.2.9 Oracle Corporation
- 16.2.9.1. Overview
- 16.2.9.2. Products
- 16.2.9.3. SWOT Analysis
- 16.2.9.4. Recent Developments
- 16.2.9.5. Financials (Based on Availability)
- 16.2.10 Salesforce com Inc (Tableau Software Inc )
- 16.2.10.1. Overview
- 16.2.10.2. Products
- 16.2.10.3. SWOT Analysis
- 16.2.10.4. Recent Developments
- 16.2.10.5. Financials (Based on Availability)
- 16.2.11 SAP SE
- 16.2.11.1. Overview
- 16.2.11.2. Products
- 16.2.11.3. SWOT Analysis
- 16.2.11.4. Recent Developments
- 16.2.11.5. Financials (Based on Availability)
- 16.2.12 MicroStrategy Inc *List Not Exhaustive
- 16.2.12.1. Overview
- 16.2.12.2. Products
- 16.2.12.3. SWOT Analysis
- 16.2.12.4. Recent Developments
- 16.2.12.5. Financials (Based on Availability)
- 16.2.1 SAS Institute Inc
List of Figures
- Figure 1: Global Data Visualization Industry Revenue Breakdown (Million, %) by Region 2024 & 2032
- Figure 2: North America Data Visualization Industry Revenue (Million), by Country 2024 & 2032
- Figure 3: North America Data Visualization Industry Revenue Share (%), by Country 2024 & 2032
- Figure 4: Europe Data Visualization Industry Revenue (Million), by Country 2024 & 2032
- Figure 5: Europe Data Visualization Industry Revenue Share (%), by Country 2024 & 2032
- Figure 6: Asia Pacific Data Visualization Industry Revenue (Million), by Country 2024 & 2032
- Figure 7: Asia Pacific Data Visualization Industry Revenue Share (%), by Country 2024 & 2032
- Figure 8: Latin America Data Visualization Industry Revenue (Million), by Country 2024 & 2032
- Figure 9: Latin America Data Visualization Industry Revenue Share (%), by Country 2024 & 2032
- Figure 10: Middle East and Africa Data Visualization Industry Revenue (Million), by Country 2024 & 2032
- Figure 11: Middle East and Africa Data Visualization Industry Revenue Share (%), by Country 2024 & 2032
- Figure 12: North America Data Visualization Industry Revenue (Million), by Organizational Department 2024 & 2032
- Figure 13: North America Data Visualization Industry Revenue Share (%), by Organizational Department 2024 & 2032
- Figure 14: North America Data Visualization Industry Revenue (Million), by Deployment Mode 2024 & 2032
- Figure 15: North America Data Visualization Industry Revenue Share (%), by Deployment Mode 2024 & 2032
- Figure 16: North America Data Visualization Industry Revenue (Million), by End User 2024 & 2032
- Figure 17: North America Data Visualization Industry Revenue Share (%), by End User 2024 & 2032
- Figure 18: North America Data Visualization Industry Revenue (Million), by Country 2024 & 2032
- Figure 19: North America Data Visualization Industry Revenue Share (%), by Country 2024 & 2032
- Figure 20: Europe Data Visualization Industry Revenue (Million), by Organizational Department 2024 & 2032
- Figure 21: Europe Data Visualization Industry Revenue Share (%), by Organizational Department 2024 & 2032
- Figure 22: Europe Data Visualization Industry Revenue (Million), by Deployment Mode 2024 & 2032
- Figure 23: Europe Data Visualization Industry Revenue Share (%), by Deployment Mode 2024 & 2032
- Figure 24: Europe Data Visualization Industry Revenue (Million), by End User 2024 & 2032
- Figure 25: Europe Data Visualization Industry Revenue Share (%), by End User 2024 & 2032
- Figure 26: Europe Data Visualization Industry Revenue (Million), by Country 2024 & 2032
- Figure 27: Europe Data Visualization Industry Revenue Share (%), by Country 2024 & 2032
- Figure 28: Asia Pacific Data Visualization Industry Revenue (Million), by Organizational Department 2024 & 2032
- Figure 29: Asia Pacific Data Visualization Industry Revenue Share (%), by Organizational Department 2024 & 2032
- Figure 30: Asia Pacific Data Visualization Industry Revenue (Million), by Deployment Mode 2024 & 2032
- Figure 31: Asia Pacific Data Visualization Industry Revenue Share (%), by Deployment Mode 2024 & 2032
- Figure 32: Asia Pacific Data Visualization Industry Revenue (Million), by End User 2024 & 2032
- Figure 33: Asia Pacific Data Visualization Industry Revenue Share (%), by End User 2024 & 2032
- Figure 34: Asia Pacific Data Visualization Industry Revenue (Million), by Country 2024 & 2032
- Figure 35: Asia Pacific Data Visualization Industry Revenue Share (%), by Country 2024 & 2032
- Figure 36: Latin America Data Visualization Industry Revenue (Million), by Organizational Department 2024 & 2032
- Figure 37: Latin America Data Visualization Industry Revenue Share (%), by Organizational Department 2024 & 2032
- Figure 38: Latin America Data Visualization Industry Revenue (Million), by Deployment Mode 2024 & 2032
- Figure 39: Latin America Data Visualization Industry Revenue Share (%), by Deployment Mode 2024 & 2032
- Figure 40: Latin America Data Visualization Industry Revenue (Million), by End User 2024 & 2032
- Figure 41: Latin America Data Visualization Industry Revenue Share (%), by End User 2024 & 2032
- Figure 42: Latin America Data Visualization Industry Revenue (Million), by Country 2024 & 2032
- Figure 43: Latin America Data Visualization Industry Revenue Share (%), by Country 2024 & 2032
- Figure 44: Middle East and Africa Data Visualization Industry Revenue (Million), by Organizational Department 2024 & 2032
- Figure 45: Middle East and Africa Data Visualization Industry Revenue Share (%), by Organizational Department 2024 & 2032
- Figure 46: Middle East and Africa Data Visualization Industry Revenue (Million), by Deployment Mode 2024 & 2032
- Figure 47: Middle East and Africa Data Visualization Industry Revenue Share (%), by Deployment Mode 2024 & 2032
- Figure 48: Middle East and Africa Data Visualization Industry Revenue (Million), by End User 2024 & 2032
- Figure 49: Middle East and Africa Data Visualization Industry Revenue Share (%), by End User 2024 & 2032
- Figure 50: Middle East and Africa Data Visualization Industry Revenue (Million), by Country 2024 & 2032
- Figure 51: Middle East and Africa Data Visualization Industry Revenue Share (%), by Country 2024 & 2032
List of Tables
- Table 1: Global Data Visualization Industry Revenue Million Forecast, by Region 2019 & 2032
- Table 2: Global Data Visualization Industry Revenue Million Forecast, by Organizational Department 2019 & 2032
- Table 3: Global Data Visualization Industry Revenue Million Forecast, by Deployment Mode 2019 & 2032
- Table 4: Global Data Visualization Industry Revenue Million Forecast, by End User 2019 & 2032
- Table 5: Global Data Visualization Industry Revenue Million Forecast, by Region 2019 & 2032
- Table 6: Global Data Visualization Industry Revenue Million Forecast, by Country 2019 & 2032
- Table 7: Data Visualization Industry Revenue (Million) Forecast, by Application 2019 & 2032
- Table 8: Global Data Visualization Industry Revenue Million Forecast, by Country 2019 & 2032
- Table 9: Data Visualization Industry Revenue (Million) Forecast, by Application 2019 & 2032
- Table 10: Global Data Visualization Industry Revenue Million Forecast, by Country 2019 & 2032
- Table 11: Data Visualization Industry Revenue (Million) Forecast, by Application 2019 & 2032
- Table 12: Global Data Visualization Industry Revenue Million Forecast, by Country 2019 & 2032
- Table 13: Data Visualization Industry Revenue (Million) Forecast, by Application 2019 & 2032
- Table 14: Global Data Visualization Industry Revenue Million Forecast, by Country 2019 & 2032
- Table 15: Data Visualization Industry Revenue (Million) Forecast, by Application 2019 & 2032
- Table 16: Global Data Visualization Industry Revenue Million Forecast, by Organizational Department 2019 & 2032
- Table 17: Global Data Visualization Industry Revenue Million Forecast, by Deployment Mode 2019 & 2032
- Table 18: Global Data Visualization Industry Revenue Million Forecast, by End User 2019 & 2032
- Table 19: Global Data Visualization Industry Revenue Million Forecast, by Country 2019 & 2032
- Table 20: Global Data Visualization Industry Revenue Million Forecast, by Organizational Department 2019 & 2032
- Table 21: Global Data Visualization Industry Revenue Million Forecast, by Deployment Mode 2019 & 2032
- Table 22: Global Data Visualization Industry Revenue Million Forecast, by End User 2019 & 2032
- Table 23: Global Data Visualization Industry Revenue Million Forecast, by Country 2019 & 2032
- Table 24: Global Data Visualization Industry Revenue Million Forecast, by Organizational Department 2019 & 2032
- Table 25: Global Data Visualization Industry Revenue Million Forecast, by Deployment Mode 2019 & 2032
- Table 26: Global Data Visualization Industry Revenue Million Forecast, by End User 2019 & 2032
- Table 27: Global Data Visualization Industry Revenue Million Forecast, by Country 2019 & 2032
- Table 28: Global Data Visualization Industry Revenue Million Forecast, by Organizational Department 2019 & 2032
- Table 29: Global Data Visualization Industry Revenue Million Forecast, by Deployment Mode 2019 & 2032
- Table 30: Global Data Visualization Industry Revenue Million Forecast, by End User 2019 & 2032
- Table 31: Global Data Visualization Industry Revenue Million Forecast, by Country 2019 & 2032
- Table 32: Global Data Visualization Industry Revenue Million Forecast, by Organizational Department 2019 & 2032
- Table 33: Global Data Visualization Industry Revenue Million Forecast, by Deployment Mode 2019 & 2032
- Table 34: Global Data Visualization Industry Revenue Million Forecast, by End User 2019 & 2032
- Table 35: Global Data Visualization Industry Revenue Million Forecast, by Country 2019 & 2032
Frequently Asked Questions
1. What is the projected Compound Annual Growth Rate (CAGR) of the Data Visualization Industry?
The projected CAGR is approximately 10.95%.
2. Which companies are prominent players in the Data Visualization Industry?
Key companies in the market include SAS Institute Inc, InetSoft Technology Corporation, TIBCO Software Inc, IBM Corporation, Microsoft Corporation, Pentaho Corporation, Dundas Data Visualization Inc, Information Builders, Oracle Corporation, Salesforce com Inc (Tableau Software Inc ), SAP SE, MicroStrategy Inc *List Not Exhaustive.
3. What are the main segments of the Data Visualization Industry?
The market segments include Organizational Department, Deployment Mode, End User.
4. Can you provide details about the market size?
The market size is estimated to be USD 9.84 Million as of 2022.
5. What are some drivers contributing to market growth?
Cloud Deployment of Data Visualization Solutions; Increasing Need for Quick Decision Making.
6. What are the notable trends driving market growth?
Retail Segment to Witness Significant Growth.
7. Are there any restraints impacting market growth?
Lack of Tech Savvy and Skilled Workforce/Inability.
8. Can you provide examples of recent developments in the market?
September 2022: KPI 360, an AI-driven solution that uses real-time data monitoring and prediction to assist manufacturing organizations in seeing various operational data sources through a single, comprehensive industrial intelligence dashboard that sets up in hours, was recently unveiled by SymphonyAI Industrial.
9. What pricing options are available for accessing the report?
Pricing options include single-user, multi-user, and enterprise licenses priced at USD 4750, USD 5250, and USD 8750 respectively.
10. Is the market size provided in terms of value or volume?
The market size is provided in terms of value, measured in Million.
11. Are there any specific market keywords associated with the report?
Yes, the market keyword associated with the report is "Data Visualization Industry," which aids in identifying and referencing the specific market segment covered.
12. How do I determine which pricing option suits my needs best?
The pricing options vary based on user requirements and access needs. Individual users may opt for single-user licenses, while businesses requiring broader access may choose multi-user or enterprise licenses for cost-effective access to the report.
13. Are there any additional resources or data provided in the Data Visualization Industry report?
While the report offers comprehensive insights, it's advisable to review the specific contents or supplementary materials provided to ascertain if additional resources or data are available.
14. How can I stay updated on further developments or reports in the Data Visualization Industry?
To stay informed about further developments, trends, and reports in the Data Visualization Industry, consider subscribing to industry newsletters, following relevant companies and organizations, or regularly checking reputable industry news sources and publications.
Methodology
Step 1 - Identification of Relevant Samples Size from Population Database


Step 2 - Approaches for Defining Global Market Size (Value, Volume* & Price*)

Note*: In applicable scenarios
Step 3 - Data Sources
Primary Research
- Web Analytics
- Survey Reports
- Research Institute
- Latest Research Reports
- Opinion Leaders
Secondary Research
- Annual Reports
- White Paper
- Latest Press Release
- Industry Association
- Paid Database
- Investor Presentations

Step 4 - Data Triangulation
Involves using different sources of information in order to increase the validity of a study
These sources are likely to be stakeholders in a program - participants, other researchers, program staff, other community members, and so on.
Then we put all data in single framework & apply various statistical tools to find out the dynamic on the market.
During the analysis stage, feedback from the stakeholder groups would be compared to determine areas of agreement as well as areas of divergence


