
Key Insights
The Asia-Pacific (APAC) Building Energy Management Systems (BEMS) market is experiencing robust growth, driven by increasing urbanization, stringent government regulations promoting energy efficiency, and the rising adoption of smart building technologies. The region's large and diverse building stock, coupled with a growing awareness of sustainability and cost savings, presents a significant opportunity for BEMS providers. Factors such as rising energy costs and the need to reduce carbon footprints are further propelling market expansion. While China and Japan represent significant market shares, the Southeast Asian nations are witnessing rapid growth due to infrastructure development and increasing investments in smart city initiatives. The market is segmented by end-user application (commercial, educational, industrial, others), geographical location (China, Japan, Southeast Asia, and Rest of APAC), type of solution (hardware, software, services), and distribution channel (direct sales, partners, resellers, system integrators, and utility providers). The hardware segment, encompassing controllers and gateways, currently holds a substantial market share, but the software and services segments are experiencing faster growth rates, driven by the increasing demand for advanced analytics and remote management capabilities. Competitive intensity is high, with established players like Honeywell, Siemens, Johnson Controls, Trane, Schneider Electric, and ABB vying for market share alongside several regional players. Challenges remain, including high initial investment costs for BEMS implementation, lack of awareness in certain segments, and the need for skilled workforce to install and maintain these systems. However, the long-term cost savings and environmental benefits are expected to outweigh these challenges, leading to sustained market growth over the forecast period.
The forecast period (2025-2033) anticipates continued expansion of the APAC BEMS market, fueled by government incentives, technological advancements, and the rising adoption of cloud-based solutions. The increasing integration of Internet of Things (IoT) devices and artificial intelligence (AI) in BEMS further enhances operational efficiency and predictive maintenance capabilities. The focus is shifting towards more sophisticated systems that offer comprehensive energy monitoring, control, and optimization features. Furthermore, the market is witnessing an upsurge in demand for energy-efficient buildings, particularly in rapidly developing economies within the APAC region. This trend is encouraging investments in BEMS solutions capable of not only reducing energy consumption but also enhancing occupant comfort and productivity. The market's future growth will be shaped by factors such as the pace of technological innovation, evolving regulatory landscapes, and the ability of BEMS providers to offer tailored solutions meeting the diverse needs of various building types and regions.
APAC Building Energy Management Systems Market Report: 2019-2033
This comprehensive report provides a detailed analysis of the Asia-Pacific (APAC) Building Energy Management Systems (BEMS) market, offering invaluable insights for industry professionals, investors, and strategic decision-makers. The report covers the period from 2019 to 2033, with a focus on the forecast period from 2025 to 2033, and utilizes 2025 as the base year. The market is segmented by end-user application, country, type of solution, and distribution channel, offering a granular understanding of growth drivers and challenges. Key players like Honeywell, Building IQ, Siemens, Johnson Controls, Trane, Schneider Electric, and ABB are analyzed, providing a competitive landscape overview. The report's findings are supported by robust data and market estimations.
APAC Building Energy Management Systems Market Structure & Innovation Trends
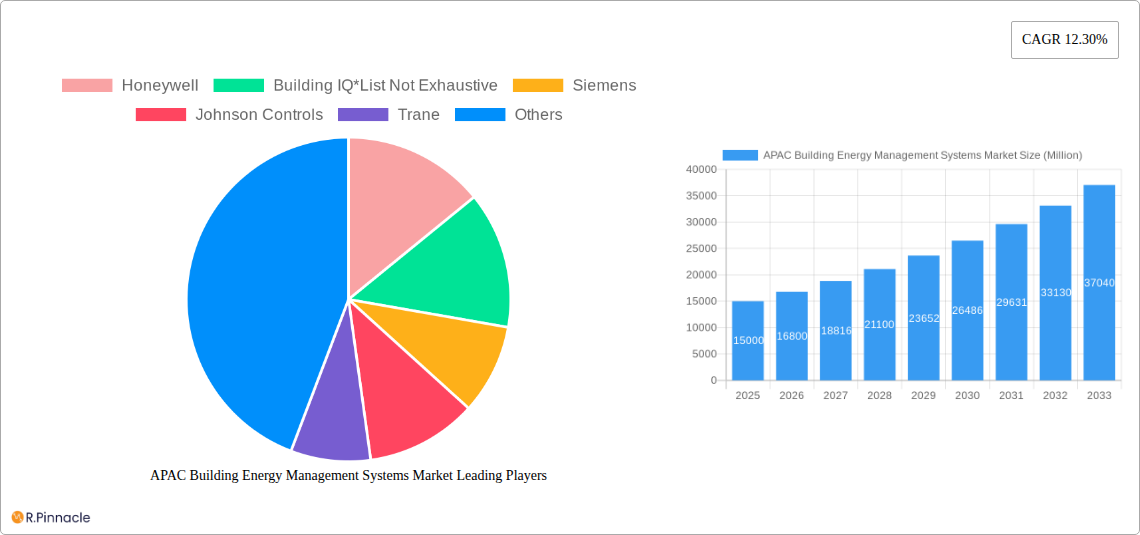
The APAC BEMS market exhibits a moderately concentrated structure, with key players holding significant market share. Honeywell, Johnson Controls, and Siemens collectively account for approximately xx% of the market in 2025. However, the market also features several regional players and specialized providers, leading to a dynamic competitive landscape. Innovation is driven by advancements in IoT, AI, and cloud computing, leading to the development of more sophisticated and integrated BEMS solutions. Stringent government regulations promoting energy efficiency, such as those focused on carbon emissions reduction, are significant drivers. The market also sees a growing adoption of energy-efficient building technologies and increasing awareness of sustainability. The competitive landscape is further shaped by mergers and acquisitions (M&A) activities. In recent years, there have been xx M&A deals with a total value of approximately $xx Million, indicating a trend towards consolidation and expansion in the market.
- Market Concentration: Moderately concentrated, with top three players holding xx% market share in 2025.
- Innovation Drivers: IoT, AI, Cloud Computing, Energy Efficiency Regulations.
- Regulatory Frameworks: Stringent regulations promoting energy efficiency are driving market growth.
- Product Substitutes: Limited direct substitutes, but increased competition from standalone solutions.
- End-User Demographics: Growing urbanization and industrialization are driving market demand.
- M&A Activities: xx deals with a total value of approximately $xx Million in recent years.

APAC Building Energy Management Systems Market Dynamics & Trends
The APAC BEMS market is poised for significant growth, driven by factors such as increasing energy costs, rising awareness of energy efficiency, and supportive government policies. The market is expected to exhibit a Compound Annual Growth Rate (CAGR) of xx% during the forecast period (2025-2033). The market penetration of BEMS solutions remains relatively low in certain regions, presenting a significant opportunity for growth. Technological disruptions, such as the rise of AI-powered predictive maintenance and the integration of renewable energy sources, are transforming the market. Consumer preference is shifting towards integrated solutions that offer better energy efficiency, cost savings, and improved building operational management. Competitive dynamics are shaped by technological innovation, pricing strategies, and partnerships. The rise of smart cities and green buildings initiatives further fuels market expansion.
Dominant Regions & Segments in APAC Building Energy Management Systems Market
China holds the dominant position in the APAC BEMS market, driven by significant government investment in infrastructure development and energy efficiency programs. Japan follows as a key market, characterized by a focus on advanced technologies and high adoption rates in commercial buildings. Southeast Asia is experiencing rapid growth, propelled by increasing urbanization and industrialization.
- By End-user Application:
- Commercial: Dominates the market due to high energy consumption and focus on cost optimization.
- Educational: Growing segment due to increasing awareness and government initiatives.
- Industrial: Significant growth potential driven by increasing energy costs and operational efficiency needs.
- By Country:
- China: Largest market driven by government support and infrastructure development.
- Japan: High adoption rates in commercial buildings due to technological advancements.
- Southeast Asia: Fastest-growing region driven by urbanization and industrialization.
- By Type of Solution:
- Hardware: Largest segment due to the need for physical infrastructure.
- Software: Rapid growth due to increasing demand for data analytics and system integration.
- Services: Increasing demand for installation, maintenance, and support services.
- By Distribution Channel:
- Direct/Partner Sales/Retail: Major distribution channel for established players.
- Value-added Resellers/System Integrators: Important channel for reaching niche markets.
- Utilities/Energy Service Providers: Expanding role in offering integrated solutions.
Key Drivers for each segment are detailed in the full report.
APAC Building Energy Management Systems Market Product Innovations
Recent product innovations focus on improving energy efficiency, enhancing system integration, and leveraging data analytics for better decision-making. The market is witnessing the integration of AI and machine learning for predictive maintenance, remote monitoring, and optimization of building operations. Cloud-based platforms are gaining popularity, offering scalability and remote accessibility. These innovations address market needs for cost savings, improved operational efficiency, and enhanced building sustainability.
Report Scope & Segmentation Analysis
This report segments the APAC BEMS market by end-user application (commercial, educational, industrial, others), country (China, Japan, Southeast Asia, Rest of Asia-Pacific), type of solution (hardware, software, services), and distribution channel (direct sales, value-added resellers, utilities). Each segment is analyzed based on its current market size, growth projections, and competitive dynamics. Growth projections vary across segments, with the software and services segments exhibiting higher growth rates compared to the hardware segment.
Key Drivers of APAC Building Energy Management Systems Market Growth
Several factors are driving the growth of the APAC BEMS market. These include increasing energy costs, stringent government regulations promoting energy efficiency, rising awareness of environmental sustainability, and advancements in building automation technologies. The increasing adoption of smart building technologies and the growing demand for improved operational efficiency further contribute to market growth.
Challenges in the APAC Building Energy Management Systems Market Sector
The APAC BEMS market faces challenges such as high initial investment costs, interoperability issues between different systems, and the lack of skilled workforce for installation and maintenance. Regulatory complexities and variations in standards across different countries pose additional challenges. The market also faces competitive pressures from both established players and new entrants.
Emerging Opportunities in APAC Building Energy Management Systems Market
Emerging opportunities exist in areas such as smart city initiatives, the integration of renewable energy sources, and the adoption of advanced analytics for optimizing building operations. Growth potential also lies in expanding into underserved markets and developing tailored solutions for specific building types. The increasing adoption of cloud-based platforms and the development of energy-as-a-service (EaaS) models also present promising opportunities.
Leading Players in the APAC Building Energy Management Systems Market Market
- Honeywell
- Building IQ
- Siemens
- Johnson Controls
- Trane
- Schneider Electric
- ABB
Key Developments in APAC Building Energy Management Systems Market Industry
- August 2022: Johnson Controls partnered with Microsoft Beijing Campus, achieving 27.9% energy savings and 98% equipment uptime.
- March 2022: WRI India partnered with Energy Management Centre Kerala to launch "Oorjayan," a state-wide program for building energy efficiency.
Future Outlook for APAP Building Energy Management Systems Market Market
The APAC BEMS market is projected to experience sustained growth in the coming years, driven by increasing urbanization, supportive government policies, and technological advancements. Strategic opportunities exist for companies to focus on innovation, partnerships, and expansion into underserved markets to capitalize on the market’s growth potential. The focus on sustainability and smart city initiatives will further shape the future of the APAC BEMS market.
APAC Building Energy Management Systems Market Segmentation
-
1. Type of Solution
- 1.1. Hardware (controllers and gateways)
- 1.2. Software
- 1.3. Services
-
2. Distribution Channel
- 2.1. Direct/Partner Sales/Retail
- 2.2. Value-added Resellers/System Integrators
- 2.3. Utilities/Energy Service Providers
-
3. End-user Application
- 3.1. Commercial
- 3.2. Educational
- 3.3. Industrial
- 3.4. Others
APAC Building Energy Management Systems Market Segmentation By Geography
-
1. North America
- 1.1. United States
- 1.2. Canada
- 1.3. Mexico
-
2. South America
- 2.1. Brazil
- 2.2. Argentina
- 2.3. Rest of South America
-
3. Europe
- 3.1. United Kingdom
- 3.2. Germany
- 3.3. France
- 3.4. Italy
- 3.5. Spain
- 3.6. Russia
- 3.7. Benelux
- 3.8. Nordics
- 3.9. Rest of Europe
-
4. Middle East & Africa
- 4.1. Turkey
- 4.2. Israel
- 4.3. GCC
- 4.4. North Africa
- 4.5. South Africa
- 4.6. Rest of Middle East & Africa
-
5. Asia Pacific
- 5.1. China
- 5.2. India
- 5.3. Japan
- 5.4. South Korea
- 5.5. ASEAN
- 5.6. Oceania
- 5.7. Rest of Asia Pacific

APAC Building Energy Management Systems Market REPORT HIGHLIGHTS
| Aspects | Details |
|---|---|
| Study Period | 2019-2033 |
| Base Year | 2024 |
| Estimated Year | 2025 |
| Forecast Period | 2025-2033 |
| Historical Period | 2019-2024 |
| Growth Rate | CAGR of 12.30% from 2019-2033 |
| Segmentation |
|
Table of Contents
- 1. Introduction
- 1.1. Research Scope
- 1.2. Market Segmentation
- 1.3. Research Methodology
- 1.4. Definitions and Assumptions
- 2. Executive Summary
- 2.1. Introduction
- 3. Market Dynamics
- 3.1. Introduction
- 3.2. Market Drivers
- 3.2.1. Rapid Growing Numbe of End-users; Low Manufacturing Costs
- 3.3. Market Restrains
- 3.3.1. Technical Difficulties
- 3.4. Market Trends
- 3.4.1. The Increase in Demand from the Residential Segment is Expected to Drive the Market
- 4. Market Factor Analysis
- 4.1. Porters Five Forces
- 4.2. Supply/Value Chain
- 4.3. PESTEL analysis
- 4.4. Market Entropy
- 4.5. Patent/Trademark Analysis
- 5. Global APAC Building Energy Management Systems Market Analysis, Insights and Forecast, 2019-2031
- 5.1. Market Analysis, Insights and Forecast - by Type of Solution
- 5.1.1. Hardware (controllers and gateways)
- 5.1.2. Software
- 5.1.3. Services
- 5.2. Market Analysis, Insights and Forecast - by Distribution Channel
- 5.2.1. Direct/Partner Sales/Retail
- 5.2.2. Value-added Resellers/System Integrators
- 5.2.3. Utilities/Energy Service Providers
- 5.3. Market Analysis, Insights and Forecast - by End-user Application
- 5.3.1. Commercial
- 5.3.2. Educational
- 5.3.3. Industrial
- 5.3.4. Others
- 5.4. Market Analysis, Insights and Forecast - by Region
- 5.4.1. North America
- 5.4.2. South America
- 5.4.3. Europe
- 5.4.4. Middle East & Africa
- 5.4.5. Asia Pacific
- 5.1. Market Analysis, Insights and Forecast - by Type of Solution
- 6. North America APAC Building Energy Management Systems Market Analysis, Insights and Forecast, 2019-2031
- 6.1. Market Analysis, Insights and Forecast - by Type of Solution
- 6.1.1. Hardware (controllers and gateways)
- 6.1.2. Software
- 6.1.3. Services
- 6.2. Market Analysis, Insights and Forecast - by Distribution Channel
- 6.2.1. Direct/Partner Sales/Retail
- 6.2.2. Value-added Resellers/System Integrators
- 6.2.3. Utilities/Energy Service Providers
- 6.3. Market Analysis, Insights and Forecast - by End-user Application
- 6.3.1. Commercial
- 6.3.2. Educational
- 6.3.3. Industrial
- 6.3.4. Others
- 6.1. Market Analysis, Insights and Forecast - by Type of Solution
- 7. South America APAC Building Energy Management Systems Market Analysis, Insights and Forecast, 2019-2031
- 7.1. Market Analysis, Insights and Forecast - by Type of Solution
- 7.1.1. Hardware (controllers and gateways)
- 7.1.2. Software
- 7.1.3. Services
- 7.2. Market Analysis, Insights and Forecast - by Distribution Channel
- 7.2.1. Direct/Partner Sales/Retail
- 7.2.2. Value-added Resellers/System Integrators
- 7.2.3. Utilities/Energy Service Providers
- 7.3. Market Analysis, Insights and Forecast - by End-user Application
- 7.3.1. Commercial
- 7.3.2. Educational
- 7.3.3. Industrial
- 7.3.4. Others
- 7.1. Market Analysis, Insights and Forecast - by Type of Solution
- 8. Europe APAC Building Energy Management Systems Market Analysis, Insights and Forecast, 2019-2031
- 8.1. Market Analysis, Insights and Forecast - by Type of Solution
- 8.1.1. Hardware (controllers and gateways)
- 8.1.2. Software
- 8.1.3. Services
- 8.2. Market Analysis, Insights and Forecast - by Distribution Channel
- 8.2.1. Direct/Partner Sales/Retail
- 8.2.2. Value-added Resellers/System Integrators
- 8.2.3. Utilities/Energy Service Providers
- 8.3. Market Analysis, Insights and Forecast - by End-user Application
- 8.3.1. Commercial
- 8.3.2. Educational
- 8.3.3. Industrial
- 8.3.4. Others
- 8.1. Market Analysis, Insights and Forecast - by Type of Solution
- 9. Middle East & Africa APAC Building Energy Management Systems Market Analysis, Insights and Forecast, 2019-2031
- 9.1. Market Analysis, Insights and Forecast - by Type of Solution
- 9.1.1. Hardware (controllers and gateways)
- 9.1.2. Software
- 9.1.3. Services
- 9.2. Market Analysis, Insights and Forecast - by Distribution Channel
- 9.2.1. Direct/Partner Sales/Retail
- 9.2.2. Value-added Resellers/System Integrators
- 9.2.3. Utilities/Energy Service Providers
- 9.3. Market Analysis, Insights and Forecast - by End-user Application
- 9.3.1. Commercial
- 9.3.2. Educational
- 9.3.3. Industrial
- 9.3.4. Others
- 9.1. Market Analysis, Insights and Forecast - by Type of Solution
- 10. Asia Pacific APAC Building Energy Management Systems Market Analysis, Insights and Forecast, 2019-2031
- 10.1. Market Analysis, Insights and Forecast - by Type of Solution
- 10.1.1. Hardware (controllers and gateways)
- 10.1.2. Software
- 10.1.3. Services
- 10.2. Market Analysis, Insights and Forecast - by Distribution Channel
- 10.2.1. Direct/Partner Sales/Retail
- 10.2.2. Value-added Resellers/System Integrators
- 10.2.3. Utilities/Energy Service Providers
- 10.3. Market Analysis, Insights and Forecast - by End-user Application
- 10.3.1. Commercial
- 10.3.2. Educational
- 10.3.3. Industrial
- 10.3.4. Others
- 10.1. Market Analysis, Insights and Forecast - by Type of Solution
- 11. North America APAC Building Energy Management Systems Market Analysis, Insights and Forecast, 2019-2031
- 11.1. Market Analysis, Insights and Forecast - By Country/Sub-region
- 11.1.1 United States
- 11.1.2 Canada
- 12. Europe APAC Building Energy Management Systems Market Analysis, Insights and Forecast, 2019-2031
- 12.1. Market Analysis, Insights and Forecast - By Country/Sub-region
- 12.1.1 United Kingdom
- 12.1.2 Germany
- 12.1.3 France
- 12.1.4 Benelux
- 12.1.5 Rest of Europe
- 13. Asia Pacific APAC Building Energy Management Systems Market Analysis, Insights and Forecast, 2019-2031
- 13.1. Market Analysis, Insights and Forecast - By Country/Sub-region
- 13.1.1 China
- 13.1.2 India
- 13.1.3 Japan
- 13.1.4 Rest of Asia Pacific
- 14. Latin America APAC Building Energy Management Systems Market Analysis, Insights and Forecast, 2019-2031
- 14.1. Market Analysis, Insights and Forecast - By Country/Sub-region
- 14.1.1 Brazil
- 14.1.2 Argentina
- 14.1.3 Mexico
- 14.1.4 Rest of Latin America
- 15. Middle East APAC Building Energy Management Systems Market Analysis, Insights and Forecast, 2019-2031
- 15.1. Market Analysis, Insights and Forecast - By Country/Sub-region
- 15.1.1.
- 16. United Arab Emirates APAC Building Energy Management Systems Market Analysis, Insights and Forecast, 2019-2031
- 16.1. Market Analysis, Insights and Forecast - By Country/Sub-region
- 16.1.1 Saudi Arabia
- 16.1.2 South Africa
- 16.1.3 Rest of Middle East
- 17. Competitive Analysis
- 17.1. Global Market Share Analysis 2024
- 17.2. Company Profiles
- 17.2.1 Honeywell
- 17.2.1.1. Overview
- 17.2.1.2. Products
- 17.2.1.3. SWOT Analysis
- 17.2.1.4. Recent Developments
- 17.2.1.5. Financials (Based on Availability)
- 17.2.2 Building IQ*List Not Exhaustive
- 17.2.2.1. Overview
- 17.2.2.2. Products
- 17.2.2.3. SWOT Analysis
- 17.2.2.4. Recent Developments
- 17.2.2.5. Financials (Based on Availability)
- 17.2.3 Siemens
- 17.2.3.1. Overview
- 17.2.3.2. Products
- 17.2.3.3. SWOT Analysis
- 17.2.3.4. Recent Developments
- 17.2.3.5. Financials (Based on Availability)
- 17.2.4 Johnson Controls
- 17.2.4.1. Overview
- 17.2.4.2. Products
- 17.2.4.3. SWOT Analysis
- 17.2.4.4. Recent Developments
- 17.2.4.5. Financials (Based on Availability)
- 17.2.5 Trane
- 17.2.5.1. Overview
- 17.2.5.2. Products
- 17.2.5.3. SWOT Analysis
- 17.2.5.4. Recent Developments
- 17.2.5.5. Financials (Based on Availability)
- 17.2.6 Schneider Electric
- 17.2.6.1. Overview
- 17.2.6.2. Products
- 17.2.6.3. SWOT Analysis
- 17.2.6.4. Recent Developments
- 17.2.6.5. Financials (Based on Availability)
- 17.2.7 ABB
- 17.2.7.1. Overview
- 17.2.7.2. Products
- 17.2.7.3. SWOT Analysis
- 17.2.7.4. Recent Developments
- 17.2.7.5. Financials (Based on Availability)
- 17.2.1 Honeywell
List of Figures
- Figure 1: Global APAC Building Energy Management Systems Market Revenue Breakdown (Million, %) by Region 2024 & 2032
- Figure 2: North America APAC Building Energy Management Systems Market Revenue (Million), by Country 2024 & 2032
- Figure 3: North America APAC Building Energy Management Systems Market Revenue Share (%), by Country 2024 & 2032
- Figure 4: Europe APAC Building Energy Management Systems Market Revenue (Million), by Country 2024 & 2032
- Figure 5: Europe APAC Building Energy Management Systems Market Revenue Share (%), by Country 2024 & 2032
- Figure 6: Asia Pacific APAC Building Energy Management Systems Market Revenue (Million), by Country 2024 & 2032
- Figure 7: Asia Pacific APAC Building Energy Management Systems Market Revenue Share (%), by Country 2024 & 2032
- Figure 8: Latin America APAC Building Energy Management Systems Market Revenue (Million), by Country 2024 & 2032
- Figure 9: Latin America APAC Building Energy Management Systems Market Revenue Share (%), by Country 2024 & 2032
- Figure 10: Middle East APAC Building Energy Management Systems Market Revenue (Million), by Country 2024 & 2032
- Figure 11: Middle East APAC Building Energy Management Systems Market Revenue Share (%), by Country 2024 & 2032
- Figure 12: United Arab Emirates APAC Building Energy Management Systems Market Revenue (Million), by Country 2024 & 2032
- Figure 13: United Arab Emirates APAC Building Energy Management Systems Market Revenue Share (%), by Country 2024 & 2032
- Figure 14: North America APAC Building Energy Management Systems Market Revenue (Million), by Type of Solution 2024 & 2032
- Figure 15: North America APAC Building Energy Management Systems Market Revenue Share (%), by Type of Solution 2024 & 2032
- Figure 16: North America APAC Building Energy Management Systems Market Revenue (Million), by Distribution Channel 2024 & 2032
- Figure 17: North America APAC Building Energy Management Systems Market Revenue Share (%), by Distribution Channel 2024 & 2032
- Figure 18: North America APAC Building Energy Management Systems Market Revenue (Million), by End-user Application 2024 & 2032
- Figure 19: North America APAC Building Energy Management Systems Market Revenue Share (%), by End-user Application 2024 & 2032
- Figure 20: North America APAC Building Energy Management Systems Market Revenue (Million), by Country 2024 & 2032
- Figure 21: North America APAC Building Energy Management Systems Market Revenue Share (%), by Country 2024 & 2032
- Figure 22: South America APAC Building Energy Management Systems Market Revenue (Million), by Type of Solution 2024 & 2032
- Figure 23: South America APAC Building Energy Management Systems Market Revenue Share (%), by Type of Solution 2024 & 2032
- Figure 24: South America APAC Building Energy Management Systems Market Revenue (Million), by Distribution Channel 2024 & 2032
- Figure 25: South America APAC Building Energy Management Systems Market Revenue Share (%), by Distribution Channel 2024 & 2032
- Figure 26: South America APAC Building Energy Management Systems Market Revenue (Million), by End-user Application 2024 & 2032
- Figure 27: South America APAC Building Energy Management Systems Market Revenue Share (%), by End-user Application 2024 & 2032
- Figure 28: South America APAC Building Energy Management Systems Market Revenue (Million), by Country 2024 & 2032
- Figure 29: South America APAC Building Energy Management Systems Market Revenue Share (%), by Country 2024 & 2032
- Figure 30: Europe APAC Building Energy Management Systems Market Revenue (Million), by Type of Solution 2024 & 2032
- Figure 31: Europe APAC Building Energy Management Systems Market Revenue Share (%), by Type of Solution 2024 & 2032
- Figure 32: Europe APAC Building Energy Management Systems Market Revenue (Million), by Distribution Channel 2024 & 2032
- Figure 33: Europe APAC Building Energy Management Systems Market Revenue Share (%), by Distribution Channel 2024 & 2032
- Figure 34: Europe APAC Building Energy Management Systems Market Revenue (Million), by End-user Application 2024 & 2032
- Figure 35: Europe APAC Building Energy Management Systems Market Revenue Share (%), by End-user Application 2024 & 2032
- Figure 36: Europe APAC Building Energy Management Systems Market Revenue (Million), by Country 2024 & 2032
- Figure 37: Europe APAC Building Energy Management Systems Market Revenue Share (%), by Country 2024 & 2032
- Figure 38: Middle East & Africa APAC Building Energy Management Systems Market Revenue (Million), by Type of Solution 2024 & 2032
- Figure 39: Middle East & Africa APAC Building Energy Management Systems Market Revenue Share (%), by Type of Solution 2024 & 2032
- Figure 40: Middle East & Africa APAC Building Energy Management Systems Market Revenue (Million), by Distribution Channel 2024 & 2032
- Figure 41: Middle East & Africa APAC Building Energy Management Systems Market Revenue Share (%), by Distribution Channel 2024 & 2032
- Figure 42: Middle East & Africa APAC Building Energy Management Systems Market Revenue (Million), by End-user Application 2024 & 2032
- Figure 43: Middle East & Africa APAC Building Energy Management Systems Market Revenue Share (%), by End-user Application 2024 & 2032
- Figure 44: Middle East & Africa APAC Building Energy Management Systems Market Revenue (Million), by Country 2024 & 2032
- Figure 45: Middle East & Africa APAC Building Energy Management Systems Market Revenue Share (%), by Country 2024 & 2032
- Figure 46: Asia Pacific APAC Building Energy Management Systems Market Revenue (Million), by Type of Solution 2024 & 2032
- Figure 47: Asia Pacific APAC Building Energy Management Systems Market Revenue Share (%), by Type of Solution 2024 & 2032
- Figure 48: Asia Pacific APAC Building Energy Management Systems Market Revenue (Million), by Distribution Channel 2024 & 2032
- Figure 49: Asia Pacific APAC Building Energy Management Systems Market Revenue Share (%), by Distribution Channel 2024 & 2032
- Figure 50: Asia Pacific APAC Building Energy Management Systems Market Revenue (Million), by End-user Application 2024 & 2032
- Figure 51: Asia Pacific APAC Building Energy Management Systems Market Revenue Share (%), by End-user Application 2024 & 2032
- Figure 52: Asia Pacific APAC Building Energy Management Systems Market Revenue (Million), by Country 2024 & 2032
- Figure 53: Asia Pacific APAC Building Energy Management Systems Market Revenue Share (%), by Country 2024 & 2032
List of Tables
- Table 1: Global APAC Building Energy Management Systems Market Revenue Million Forecast, by Region 2019 & 2032
- Table 2: Global APAC Building Energy Management Systems Market Revenue Million Forecast, by Type of Solution 2019 & 2032
- Table 3: Global APAC Building Energy Management Systems Market Revenue Million Forecast, by Distribution Channel 2019 & 2032
- Table 4: Global APAC Building Energy Management Systems Market Revenue Million Forecast, by End-user Application 2019 & 2032
- Table 5: Global APAC Building Energy Management Systems Market Revenue Million Forecast, by Region 2019 & 2032
- Table 6: Global APAC Building Energy Management Systems Market Revenue Million Forecast, by Country 2019 & 2032
- Table 7: United States APAC Building Energy Management Systems Market Revenue (Million) Forecast, by Application 2019 & 2032
- Table 8: Canada APAC Building Energy Management Systems Market Revenue (Million) Forecast, by Application 2019 & 2032
- Table 9: Global APAC Building Energy Management Systems Market Revenue Million Forecast, by Country 2019 & 2032
- Table 10: United Kingdom APAC Building Energy Management Systems Market Revenue (Million) Forecast, by Application 2019 & 2032
- Table 11: Germany APAC Building Energy Management Systems Market Revenue (Million) Forecast, by Application 2019 & 2032
- Table 12: France APAC Building Energy Management Systems Market Revenue (Million) Forecast, by Application 2019 & 2032
- Table 13: Benelux APAC Building Energy Management Systems Market Revenue (Million) Forecast, by Application 2019 & 2032
- Table 14: Rest of Europe APAC Building Energy Management Systems Market Revenue (Million) Forecast, by Application 2019 & 2032
- Table 15: Global APAC Building Energy Management Systems Market Revenue Million Forecast, by Country 2019 & 2032
- Table 16: China APAC Building Energy Management Systems Market Revenue (Million) Forecast, by Application 2019 & 2032
- Table 17: India APAC Building Energy Management Systems Market Revenue (Million) Forecast, by Application 2019 & 2032
- Table 18: Japan APAC Building Energy Management Systems Market Revenue (Million) Forecast, by Application 2019 & 2032
- Table 19: Rest of Asia Pacific APAC Building Energy Management Systems Market Revenue (Million) Forecast, by Application 2019 & 2032
- Table 20: Global APAC Building Energy Management Systems Market Revenue Million Forecast, by Country 2019 & 2032
- Table 21: Brazil APAC Building Energy Management Systems Market Revenue (Million) Forecast, by Application 2019 & 2032
- Table 22: Argentina APAC Building Energy Management Systems Market Revenue (Million) Forecast, by Application 2019 & 2032
- Table 23: Mexico APAC Building Energy Management Systems Market Revenue (Million) Forecast, by Application 2019 & 2032
- Table 24: Rest of Latin America APAC Building Energy Management Systems Market Revenue (Million) Forecast, by Application 2019 & 2032
- Table 25: Global APAC Building Energy Management Systems Market Revenue Million Forecast, by Country 2019 & 2032
- Table 26: APAC Building Energy Management Systems Market Revenue (Million) Forecast, by Application 2019 & 2032
- Table 27: Global APAC Building Energy Management Systems Market Revenue Million Forecast, by Country 2019 & 2032
- Table 28: Saudi Arabia APAC Building Energy Management Systems Market Revenue (Million) Forecast, by Application 2019 & 2032
- Table 29: South Africa APAC Building Energy Management Systems Market Revenue (Million) Forecast, by Application 2019 & 2032
- Table 30: Rest of Middle East APAC Building Energy Management Systems Market Revenue (Million) Forecast, by Application 2019 & 2032
- Table 31: Global APAC Building Energy Management Systems Market Revenue Million Forecast, by Type of Solution 2019 & 2032
- Table 32: Global APAC Building Energy Management Systems Market Revenue Million Forecast, by Distribution Channel 2019 & 2032
- Table 33: Global APAC Building Energy Management Systems Market Revenue Million Forecast, by End-user Application 2019 & 2032
- Table 34: Global APAC Building Energy Management Systems Market Revenue Million Forecast, by Country 2019 & 2032
- Table 35: United States APAC Building Energy Management Systems Market Revenue (Million) Forecast, by Application 2019 & 2032
- Table 36: Canada APAC Building Energy Management Systems Market Revenue (Million) Forecast, by Application 2019 & 2032
- Table 37: Mexico APAC Building Energy Management Systems Market Revenue (Million) Forecast, by Application 2019 & 2032
- Table 38: Global APAC Building Energy Management Systems Market Revenue Million Forecast, by Type of Solution 2019 & 2032
- Table 39: Global APAC Building Energy Management Systems Market Revenue Million Forecast, by Distribution Channel 2019 & 2032
- Table 40: Global APAC Building Energy Management Systems Market Revenue Million Forecast, by End-user Application 2019 & 2032
- Table 41: Global APAC Building Energy Management Systems Market Revenue Million Forecast, by Country 2019 & 2032
- Table 42: Brazil APAC Building Energy Management Systems Market Revenue (Million) Forecast, by Application 2019 & 2032
- Table 43: Argentina APAC Building Energy Management Systems Market Revenue (Million) Forecast, by Application 2019 & 2032
- Table 44: Rest of South America APAC Building Energy Management Systems Market Revenue (Million) Forecast, by Application 2019 & 2032
- Table 45: Global APAC Building Energy Management Systems Market Revenue Million Forecast, by Type of Solution 2019 & 2032
- Table 46: Global APAC Building Energy Management Systems Market Revenue Million Forecast, by Distribution Channel 2019 & 2032
- Table 47: Global APAC Building Energy Management Systems Market Revenue Million Forecast, by End-user Application 2019 & 2032
- Table 48: Global APAC Building Energy Management Systems Market Revenue Million Forecast, by Country 2019 & 2032
- Table 49: United Kingdom APAC Building Energy Management Systems Market Revenue (Million) Forecast, by Application 2019 & 2032
- Table 50: Germany APAC Building Energy Management Systems Market Revenue (Million) Forecast, by Application 2019 & 2032
- Table 51: France APAC Building Energy Management Systems Market Revenue (Million) Forecast, by Application 2019 & 2032
- Table 52: Italy APAC Building Energy Management Systems Market Revenue (Million) Forecast, by Application 2019 & 2032
- Table 53: Spain APAC Building Energy Management Systems Market Revenue (Million) Forecast, by Application 2019 & 2032
- Table 54: Russia APAC Building Energy Management Systems Market Revenue (Million) Forecast, by Application 2019 & 2032
- Table 55: Benelux APAC Building Energy Management Systems Market Revenue (Million) Forecast, by Application 2019 & 2032
- Table 56: Nordics APAC Building Energy Management Systems Market Revenue (Million) Forecast, by Application 2019 & 2032
- Table 57: Rest of Europe APAC Building Energy Management Systems Market Revenue (Million) Forecast, by Application 2019 & 2032
- Table 58: Global APAC Building Energy Management Systems Market Revenue Million Forecast, by Type of Solution 2019 & 2032
- Table 59: Global APAC Building Energy Management Systems Market Revenue Million Forecast, by Distribution Channel 2019 & 2032
- Table 60: Global APAC Building Energy Management Systems Market Revenue Million Forecast, by End-user Application 2019 & 2032
- Table 61: Global APAC Building Energy Management Systems Market Revenue Million Forecast, by Country 2019 & 2032
- Table 62: Turkey APAC Building Energy Management Systems Market Revenue (Million) Forecast, by Application 2019 & 2032
- Table 63: Israel APAC Building Energy Management Systems Market Revenue (Million) Forecast, by Application 2019 & 2032
- Table 64: GCC APAC Building Energy Management Systems Market Revenue (Million) Forecast, by Application 2019 & 2032
- Table 65: North Africa APAC Building Energy Management Systems Market Revenue (Million) Forecast, by Application 2019 & 2032
- Table 66: South Africa APAC Building Energy Management Systems Market Revenue (Million) Forecast, by Application 2019 & 2032
- Table 67: Rest of Middle East & Africa APAC Building Energy Management Systems Market Revenue (Million) Forecast, by Application 2019 & 2032
- Table 68: Global APAC Building Energy Management Systems Market Revenue Million Forecast, by Type of Solution 2019 & 2032
- Table 69: Global APAC Building Energy Management Systems Market Revenue Million Forecast, by Distribution Channel 2019 & 2032
- Table 70: Global APAC Building Energy Management Systems Market Revenue Million Forecast, by End-user Application 2019 & 2032
- Table 71: Global APAC Building Energy Management Systems Market Revenue Million Forecast, by Country 2019 & 2032
- Table 72: China APAC Building Energy Management Systems Market Revenue (Million) Forecast, by Application 2019 & 2032
- Table 73: India APAC Building Energy Management Systems Market Revenue (Million) Forecast, by Application 2019 & 2032
- Table 74: Japan APAC Building Energy Management Systems Market Revenue (Million) Forecast, by Application 2019 & 2032
- Table 75: South Korea APAC Building Energy Management Systems Market Revenue (Million) Forecast, by Application 2019 & 2032
- Table 76: ASEAN APAC Building Energy Management Systems Market Revenue (Million) Forecast, by Application 2019 & 2032
- Table 77: Oceania APAC Building Energy Management Systems Market Revenue (Million) Forecast, by Application 2019 & 2032
- Table 78: Rest of Asia Pacific APAC Building Energy Management Systems Market Revenue (Million) Forecast, by Application 2019 & 2032
Frequently Asked Questions
1. What is the projected Compound Annual Growth Rate (CAGR) of the APAC Building Energy Management Systems Market?
The projected CAGR is approximately 12.30%.
2. Which companies are prominent players in the APAC Building Energy Management Systems Market?
Key companies in the market include Honeywell, Building IQ*List Not Exhaustive, Siemens, Johnson Controls, Trane, Schneider Electric, ABB.
3. What are the main segments of the APAC Building Energy Management Systems Market?
The market segments include Type of Solution, Distribution Channel, End-user Application.
4. Can you provide details about the market size?
The market size is estimated to be USD XX Million as of 2022.
5. What are some drivers contributing to market growth?
Rapid Growing Numbe of End-users; Low Manufacturing Costs.
6. What are the notable trends driving market growth?
The Increase in Demand from the Residential Segment is Expected to Drive the Market.
7. Are there any restraints impacting market growth?
Technical Difficulties.
8. Can you provide examples of recent developments in the market?
August 2022 - Johnson Controls, a global player providing smart, healthy, and sustainable buildings, announced that it partnered with Microsoft Beijing Campus for its ongoing retrofit and optimization of building operations, achieving 27.9% energy savings and ensuring critical equipment uptime to 98%. As a result, the campus has been granted an energy-saving endorsement and financial subsidy by the Beijing Municipal Government and the Haidian District Government.
9. What pricing options are available for accessing the report?
Pricing options include single-user, multi-user, and enterprise licenses priced at USD 4750, USD 4950, and USD 6800 respectively.
10. Is the market size provided in terms of value or volume?
The market size is provided in terms of value, measured in Million.
11. Are there any specific market keywords associated with the report?
Yes, the market keyword associated with the report is "APAC Building Energy Management Systems Market," which aids in identifying and referencing the specific market segment covered.
12. How do I determine which pricing option suits my needs best?
The pricing options vary based on user requirements and access needs. Individual users may opt for single-user licenses, while businesses requiring broader access may choose multi-user or enterprise licenses for cost-effective access to the report.
13. Are there any additional resources or data provided in the APAC Building Energy Management Systems Market report?
While the report offers comprehensive insights, it's advisable to review the specific contents or supplementary materials provided to ascertain if additional resources or data are available.
14. How can I stay updated on further developments or reports in the APAC Building Energy Management Systems Market?
To stay informed about further developments, trends, and reports in the APAC Building Energy Management Systems Market, consider subscribing to industry newsletters, following relevant companies and organizations, or regularly checking reputable industry news sources and publications.
Methodology
Step 1 - Identification of Relevant Samples Size from Population Database


Step 2 - Approaches for Defining Global Market Size (Value, Volume* & Price*)

Note*: In applicable scenarios
Step 3 - Data Sources
Primary Research
- Web Analytics
- Survey Reports
- Research Institute
- Latest Research Reports
- Opinion Leaders
Secondary Research
- Annual Reports
- White Paper
- Latest Press Release
- Industry Association
- Paid Database
- Investor Presentations

Step 4 - Data Triangulation
Involves using different sources of information in order to increase the validity of a study
These sources are likely to be stakeholders in a program - participants, other researchers, program staff, other community members, and so on.
Then we put all data in single framework & apply various statistical tools to find out the dynamic on the market.
During the analysis stage, feedback from the stakeholder groups would be compared to determine areas of agreement as well as areas of divergence


