
Key Insights
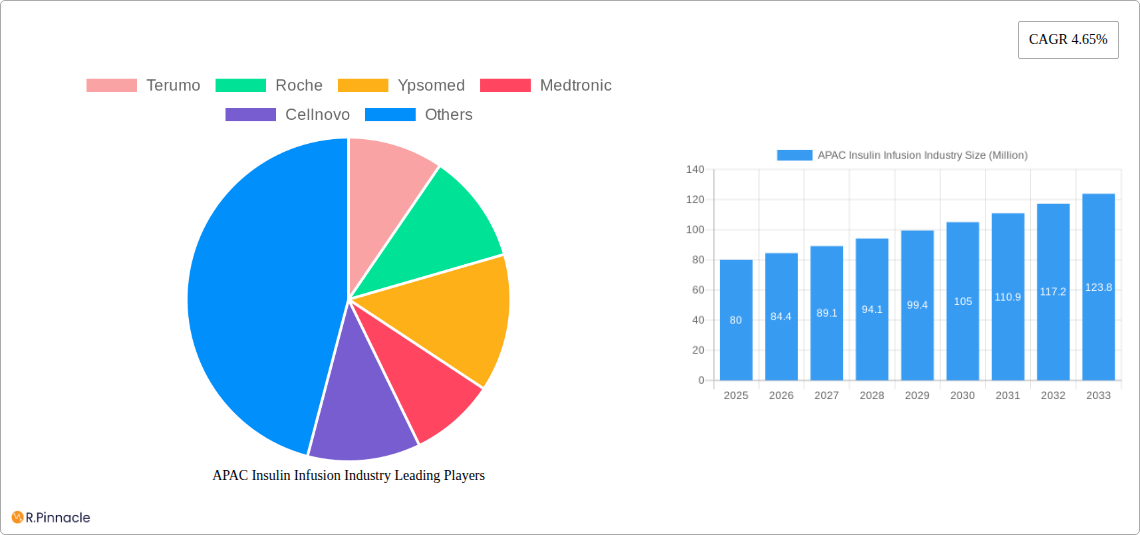
The Asia-Pacific (APAC) insulin infusion market, valued at approximately $80 million in 2025, is projected to experience robust growth, driven by rising diabetes prevalence, increasing geriatric population, and improving healthcare infrastructure across the region. China, Japan, India, and South Korea are major contributors, reflecting their large populations and expanding middle classes with greater access to advanced medical technologies. The market's expansion is further fueled by a shift towards technologically advanced insulin delivery systems, such as tubeless insulin pumps, offering enhanced convenience and improved patient outcomes. Technological advancements continue to drive innovation, with manufacturers focusing on smaller, more user-friendly devices and improved data management capabilities. However, high costs associated with insulin pumps and related supplies, coupled with limited healthcare insurance coverage in certain areas, represent significant challenges to market penetration. Government initiatives to improve diabetes awareness and management, coupled with the increasing affordability of insulin pumps, are expected to mitigate these restraints and further stimulate market growth in the coming years. The segment comprising insulin pump devices and reservoirs is expected to witness the highest growth within the APAC region.
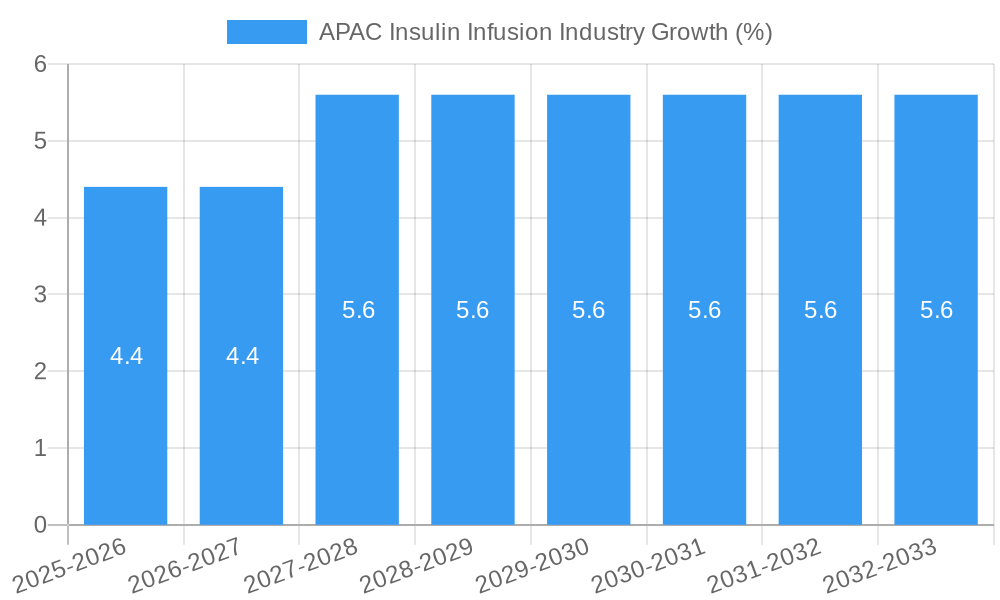
Growth within the APAC region will be further segmented by the increasing adoption of telehealth and remote patient monitoring, enabling better disease management and reducing hospitalization rates. Furthermore, the increasing focus on personalized medicine and the development of smart insulin pumps capable of integrating with other health monitoring devices will contribute to overall market expansion. Though challenges remain, the long-term growth prospects for the APAC insulin infusion market remain positive, driven by a confluence of factors including rising diabetes prevalence, technological advancements, and supportive government initiatives. Growth in the home/personal use segment is anticipated to be a key driver, propelled by increased patient awareness and preference for self-management of diabetes. A conservative estimate, considering the global CAGR and APAC's unique dynamics, projects a compound annual growth rate (CAGR) exceeding the global average, reaching approximately 5.5% from 2025-2033.
This comprehensive report provides an in-depth analysis of the Asia-Pacific (APAC) insulin infusion industry, covering market size, growth drivers, technological advancements, competitive landscape, and future outlook from 2019 to 2033. The report is essential for industry professionals, investors, and strategic decision-makers seeking actionable insights into this dynamic market. It leverages extensive data and analysis to paint a clear picture of current market conditions and future trends. Base year is 2025, with estimations for 2025 and forecasts extending to 2033, encompassing the historical period of 2019-2024.
APAC Insulin Infusion Industry Market Structure & Innovation Trends
The APAC insulin infusion market is characterized by a moderately concentrated structure, with key players like Terumo, Roche, Ypsomed, Medtronic, Cellnovo, Animas, Tandem, and Insulet holding significant market share. "Other Company" analysis accounts for the remaining participants. Innovation is driven by the increasing prevalence of diabetes, technological advancements in insulin pump technology (tethered and tubeless), and supportive government policies. Regulatory frameworks vary across the region, influencing market entry and product approvals. The market also witnesses ongoing M&A activities, although specific deal values are not publicly available for all transactions. For instance, the xx Million acquisition of Company X by Company Y in 2022 significantly impacted market share. Substitutes for insulin infusion systems are limited, primarily focusing on traditional insulin injection methods. The end-user demographic is primarily comprised of individuals with type 1 and type 2 diabetes, with a growing proportion of home/personal users.
APAC Insulin Infusion Industry Market Dynamics & Trends
The APAC insulin infusion market exhibits significant growth potential, driven by factors such as the rising prevalence of diabetes, increasing healthcare expenditure, and growing awareness about advanced insulin delivery systems. Technological advancements, particularly the development of tubeless insulin pumps and continuous glucose monitoring (CGM) systems, are revolutionizing the market. Consumer preferences are shifting toward more convenient, user-friendly, and technologically advanced devices. The competitive landscape is intense, with companies vying for market share through product innovation, strategic partnerships, and geographic expansion. The CAGR for the forecast period (2025-2033) is estimated to be xx%, driven by increasing market penetration of insulin pumps, particularly in emerging economies within the APAC region. Market penetration rates vary significantly across countries depending on factors like healthcare infrastructure, insurance coverage, and awareness levels.
Dominant Regions & Segments in APAP Insulin Infusion Industry
Dominant Region: China is expected to lead the APAC insulin infusion market due to its large diabetic population and expanding healthcare infrastructure. India and Japan also contribute significantly to regional market growth.
Dominant Segments:
- Technology: Tubeless insulin pumps are witnessing accelerated growth due to their enhanced convenience and improved user experience, although tethered pumps still dominate overall market share.
- Component: Insulin pump devices constitute the largest segment, followed by infusion sets and insulin pump reservoirs.
- End User: Home/personal use accounts for a larger market share compared to hospital/clinic use, due to increased patient preference for self-management of their condition.
Key Drivers for Dominance:
- China: Strong economic growth, increasing healthcare spending, rising diabetes prevalence, and government initiatives to improve healthcare access.
- India: Growing middle class, rising healthcare awareness, and increasing adoption of advanced medical technologies.
- Japan: Well-established healthcare infrastructure, high adoption rates of advanced medical technologies, and aging population.
APAC Insulin Infusion Industry Product Innovations
Recent product innovations include the development of smart insulin pumps with integrated CGM capabilities, advanced algorithms for insulin delivery optimization, and improved usability features. These advancements offer enhanced accuracy, convenience, and improved glycemic control for patients. The market is witnessing a trend toward smaller, more discreet devices, reflecting the evolving consumer preference for improved aesthetics and wearability. These innovations enhance the user experience and promote better diabetes management.
Report Scope & Segmentation Analysis
The report segments the APAC insulin infusion market based on technology (Tethered Insulin Pump, Tubeless Insulin Pump), component (Insulin Pump Device, Insulin Pump Reservoir, Infusion Set), and end-user (Hospital/Clinics, Home/Personal). Each segment's growth projections, market size (in Million USD), and competitive dynamics are meticulously analyzed. For example, the tubeless insulin pump segment exhibits a higher CAGR than the tethered segment, reflecting the increasing demand for improved convenience.
Key Drivers of APAC Insulin Infusion Industry Growth
Key growth drivers include:
- Rising prevalence of diabetes: The escalating number of diabetes patients across the APAC region significantly fuels demand.
- Technological advancements: The development of smart insulin pumps, CGM systems, and improved infusion sets enhances patient care and fuels market expansion.
- Government initiatives: Government support through subsidies, insurance coverage, and public awareness campaigns stimulates market growth.
Challenges in the APAC Insulin Infusion Industry Sector
The APAC insulin infusion industry faces challenges such as:
- High cost of insulin pumps and consumables: This limits accessibility for many patients, particularly in emerging economies.
- Regulatory hurdles: Stringent regulatory requirements for device approvals and market entry pose significant barriers.
- Competition: Intense competition among established players and emerging companies pressures profit margins.
Emerging Opportunities in APAC Insulin Infusion Industry
Significant opportunities exist in:
- Expansion into underserved markets: Untapped market potential exists in rural areas and developing countries.
- Development of innovative technologies: Continuous advancements in insulin delivery systems create exciting opportunities.
- Telemedicine and remote monitoring: Integration of technology facilitates remote patient monitoring and management.
Leading Players in the APAC Insulin Infusion Industry Market
Key Developments in APAC Insulin Infusion Industry
- April 2023: Medtronic's MiniMed 780G system FDA approval marks a significant advancement in automated insulin delivery.
- July 2022: The Australian government's USD 273.1 Million investment in CGM and insulin pump programs significantly expands access for type-1 diabetics.
Future Outlook for APAC Insulin Infusion Industry Market
The APAC insulin infusion market is poised for robust growth, driven by increasing diabetes prevalence, technological advancements, and supportive government policies. Strategic partnerships, technological innovations, and expansion into new markets will shape the industry's future. The market's long-term potential remains high due to a growing diabetic population and increasing demand for improved diabetes management solutions.
APAC Insulin Infusion Industry Segmentation
-
1. Technology
- 1.1. Tethered Insulin Pump
- 1.2. Tubeless Insulin Pump
-
2. Component
- 2.1. Insulin Pump Device
- 2.2. Insulin Pump Reservoir
- 2.3. Infusion Set
-
3. End User
- 3.1. Hospital/Clinics
- 3.2. Home/Personal
-
4. Geography
- 4.1. Japan
- 4.2. South Korea
- 4.3. China
- 4.4. India
- 4.5. Australia
- 4.6. Vietnam
- 4.7. Malaysia
- 4.8. Indonesia
- 4.9. Philippines
- 4.10. Thailand
- 4.11. Rest of Asia-Pacific
APAC Insulin Infusion Industry Segmentation By Geography
- 1. Japan
- 2. South Korea
- 3. China
- 4. India
- 5. Australia
- 6. Vietnam
- 7. Malaysia
- 8. Indonesia
- 9. Philippines
- 10. Thailand
- 11. Rest of Asia Pacific
APAC Insulin Infusion Industry REPORT HIGHLIGHTS
| Aspects | Details |
|---|---|
| Study Period | 2019-2033 |
| Base Year | 2024 |
| Estimated Year | 2025 |
| Forecast Period | 2025-2033 |
| Historical Period | 2019-2024 |
| Growth Rate | CAGR of 4.65% from 2019-2033 |
| Segmentation |
|
Table of Contents
- 1. Introduction
- 1.1. Research Scope
- 1.2. Market Segmentation
- 1.3. Research Methodology
- 1.4. Definitions and Assumptions
- 2. Executive Summary
- 2.1. Introduction
- 3. Market Dynamics
- 3.1. Introduction
- 3.2. Market Drivers
- 3.2.1. Increasing Applications of Cryosurgery; Technological Advancements in Cryotherapy Equipment; Rising Preference for Minimally Invasive Techniques
- 3.3. Market Restrains
- 3.3.1. Hazardous Effects of Cryogenic Gases; Complexity of the Cryotherapy Mechanisms
- 3.4. Market Trends
- 3.4.1. Insulin Infusion Pump Devices Dominating the Asia-Pacific Insulin Infusion Pump Market
- 4. Market Factor Analysis
- 4.1. Porters Five Forces
- 4.2. Supply/Value Chain
- 4.3. PESTEL analysis
- 4.4. Market Entropy
- 4.5. Patent/Trademark Analysis
- 5. Global APAC Insulin Infusion Industry Analysis, Insights and Forecast, 2019-2031
- 5.1. Market Analysis, Insights and Forecast - by Technology
- 5.1.1. Tethered Insulin Pump
- 5.1.2. Tubeless Insulin Pump
- 5.2. Market Analysis, Insights and Forecast - by Component
- 5.2.1. Insulin Pump Device
- 5.2.2. Insulin Pump Reservoir
- 5.2.3. Infusion Set
- 5.3. Market Analysis, Insights and Forecast - by End User
- 5.3.1. Hospital/Clinics
- 5.3.2. Home/Personal
- 5.4. Market Analysis, Insights and Forecast - by Geography
- 5.4.1. Japan
- 5.4.2. South Korea
- 5.4.3. China
- 5.4.4. India
- 5.4.5. Australia
- 5.4.6. Vietnam
- 5.4.7. Malaysia
- 5.4.8. Indonesia
- 5.4.9. Philippines
- 5.4.10. Thailand
- 5.4.11. Rest of Asia-Pacific
- 5.5. Market Analysis, Insights and Forecast - by Region
- 5.5.1. Japan
- 5.5.2. South Korea
- 5.5.3. China
- 5.5.4. India
- 5.5.5. Australia
- 5.5.6. Vietnam
- 5.5.7. Malaysia
- 5.5.8. Indonesia
- 5.5.9. Philippines
- 5.5.10. Thailand
- 5.5.11. Rest of Asia Pacific
- 5.1. Market Analysis, Insights and Forecast - by Technology
- 6. Japan APAC Insulin Infusion Industry Analysis, Insights and Forecast, 2019-2031
- 6.1. Market Analysis, Insights and Forecast - by Technology
- 6.1.1. Tethered Insulin Pump
- 6.1.2. Tubeless Insulin Pump
- 6.2. Market Analysis, Insights and Forecast - by Component
- 6.2.1. Insulin Pump Device
- 6.2.2. Insulin Pump Reservoir
- 6.2.3. Infusion Set
- 6.3. Market Analysis, Insights and Forecast - by End User
- 6.3.1. Hospital/Clinics
- 6.3.2. Home/Personal
- 6.4. Market Analysis, Insights and Forecast - by Geography
- 6.4.1. Japan
- 6.4.2. South Korea
- 6.4.3. China
- 6.4.4. India
- 6.4.5. Australia
- 6.4.6. Vietnam
- 6.4.7. Malaysia
- 6.4.8. Indonesia
- 6.4.9. Philippines
- 6.4.10. Thailand
- 6.4.11. Rest of Asia-Pacific
- 6.1. Market Analysis, Insights and Forecast - by Technology
- 7. South Korea APAC Insulin Infusion Industry Analysis, Insights and Forecast, 2019-2031
- 7.1. Market Analysis, Insights and Forecast - by Technology
- 7.1.1. Tethered Insulin Pump
- 7.1.2. Tubeless Insulin Pump
- 7.2. Market Analysis, Insights and Forecast - by Component
- 7.2.1. Insulin Pump Device
- 7.2.2. Insulin Pump Reservoir
- 7.2.3. Infusion Set
- 7.3. Market Analysis, Insights and Forecast - by End User
- 7.3.1. Hospital/Clinics
- 7.3.2. Home/Personal
- 7.4. Market Analysis, Insights and Forecast - by Geography
- 7.4.1. Japan
- 7.4.2. South Korea
- 7.4.3. China
- 7.4.4. India
- 7.4.5. Australia
- 7.4.6. Vietnam
- 7.4.7. Malaysia
- 7.4.8. Indonesia
- 7.4.9. Philippines
- 7.4.10. Thailand
- 7.4.11. Rest of Asia-Pacific
- 7.1. Market Analysis, Insights and Forecast - by Technology
- 8. China APAC Insulin Infusion Industry Analysis, Insights and Forecast, 2019-2031
- 8.1. Market Analysis, Insights and Forecast - by Technology
- 8.1.1. Tethered Insulin Pump
- 8.1.2. Tubeless Insulin Pump
- 8.2. Market Analysis, Insights and Forecast - by Component
- 8.2.1. Insulin Pump Device
- 8.2.2. Insulin Pump Reservoir
- 8.2.3. Infusion Set
- 8.3. Market Analysis, Insights and Forecast - by End User
- 8.3.1. Hospital/Clinics
- 8.3.2. Home/Personal
- 8.4. Market Analysis, Insights and Forecast - by Geography
- 8.4.1. Japan
- 8.4.2. South Korea
- 8.4.3. China
- 8.4.4. India
- 8.4.5. Australia
- 8.4.6. Vietnam
- 8.4.7. Malaysia
- 8.4.8. Indonesia
- 8.4.9. Philippines
- 8.4.10. Thailand
- 8.4.11. Rest of Asia-Pacific
- 8.1. Market Analysis, Insights and Forecast - by Technology
- 9. India APAC Insulin Infusion Industry Analysis, Insights and Forecast, 2019-2031
- 9.1. Market Analysis, Insights and Forecast - by Technology
- 9.1.1. Tethered Insulin Pump
- 9.1.2. Tubeless Insulin Pump
- 9.2. Market Analysis, Insights and Forecast - by Component
- 9.2.1. Insulin Pump Device
- 9.2.2. Insulin Pump Reservoir
- 9.2.3. Infusion Set
- 9.3. Market Analysis, Insights and Forecast - by End User
- 9.3.1. Hospital/Clinics
- 9.3.2. Home/Personal
- 9.4. Market Analysis, Insights and Forecast - by Geography
- 9.4.1. Japan
- 9.4.2. South Korea
- 9.4.3. China
- 9.4.4. India
- 9.4.5. Australia
- 9.4.6. Vietnam
- 9.4.7. Malaysia
- 9.4.8. Indonesia
- 9.4.9. Philippines
- 9.4.10. Thailand
- 9.4.11. Rest of Asia-Pacific
- 9.1. Market Analysis, Insights and Forecast - by Technology
- 10. Australia APAC Insulin Infusion Industry Analysis, Insights and Forecast, 2019-2031
- 10.1. Market Analysis, Insights and Forecast - by Technology
- 10.1.1. Tethered Insulin Pump
- 10.1.2. Tubeless Insulin Pump
- 10.2. Market Analysis, Insights and Forecast - by Component
- 10.2.1. Insulin Pump Device
- 10.2.2. Insulin Pump Reservoir
- 10.2.3. Infusion Set
- 10.3. Market Analysis, Insights and Forecast - by End User
- 10.3.1. Hospital/Clinics
- 10.3.2. Home/Personal
- 10.4. Market Analysis, Insights and Forecast - by Geography
- 10.4.1. Japan
- 10.4.2. South Korea
- 10.4.3. China
- 10.4.4. India
- 10.4.5. Australia
- 10.4.6. Vietnam
- 10.4.7. Malaysia
- 10.4.8. Indonesia
- 10.4.9. Philippines
- 10.4.10. Thailand
- 10.4.11. Rest of Asia-Pacific
- 10.1. Market Analysis, Insights and Forecast - by Technology
- 11. Vietnam APAC Insulin Infusion Industry Analysis, Insights and Forecast, 2019-2031
- 11.1. Market Analysis, Insights and Forecast - by Technology
- 11.1.1. Tethered Insulin Pump
- 11.1.2. Tubeless Insulin Pump
- 11.2. Market Analysis, Insights and Forecast - by Component
- 11.2.1. Insulin Pump Device
- 11.2.2. Insulin Pump Reservoir
- 11.2.3. Infusion Set
- 11.3. Market Analysis, Insights and Forecast - by End User
- 11.3.1. Hospital/Clinics
- 11.3.2. Home/Personal
- 11.4. Market Analysis, Insights and Forecast - by Geography
- 11.4.1. Japan
- 11.4.2. South Korea
- 11.4.3. China
- 11.4.4. India
- 11.4.5. Australia
- 11.4.6. Vietnam
- 11.4.7. Malaysia
- 11.4.8. Indonesia
- 11.4.9. Philippines
- 11.4.10. Thailand
- 11.4.11. Rest of Asia-Pacific
- 11.1. Market Analysis, Insights and Forecast - by Technology
- 12. Malaysia APAC Insulin Infusion Industry Analysis, Insights and Forecast, 2019-2031
- 12.1. Market Analysis, Insights and Forecast - by Technology
- 12.1.1. Tethered Insulin Pump
- 12.1.2. Tubeless Insulin Pump
- 12.2. Market Analysis, Insights and Forecast - by Component
- 12.2.1. Insulin Pump Device
- 12.2.2. Insulin Pump Reservoir
- 12.2.3. Infusion Set
- 12.3. Market Analysis, Insights and Forecast - by End User
- 12.3.1. Hospital/Clinics
- 12.3.2. Home/Personal
- 12.4. Market Analysis, Insights and Forecast - by Geography
- 12.4.1. Japan
- 12.4.2. South Korea
- 12.4.3. China
- 12.4.4. India
- 12.4.5. Australia
- 12.4.6. Vietnam
- 12.4.7. Malaysia
- 12.4.8. Indonesia
- 12.4.9. Philippines
- 12.4.10. Thailand
- 12.4.11. Rest of Asia-Pacific
- 12.1. Market Analysis, Insights and Forecast - by Technology
- 13. Indonesia APAC Insulin Infusion Industry Analysis, Insights and Forecast, 2019-2031
- 13.1. Market Analysis, Insights and Forecast - by Technology
- 13.1.1. Tethered Insulin Pump
- 13.1.2. Tubeless Insulin Pump
- 13.2. Market Analysis, Insights and Forecast - by Component
- 13.2.1. Insulin Pump Device
- 13.2.2. Insulin Pump Reservoir
- 13.2.3. Infusion Set
- 13.3. Market Analysis, Insights and Forecast - by End User
- 13.3.1. Hospital/Clinics
- 13.3.2. Home/Personal
- 13.4. Market Analysis, Insights and Forecast - by Geography
- 13.4.1. Japan
- 13.4.2. South Korea
- 13.4.3. China
- 13.4.4. India
- 13.4.5. Australia
- 13.4.6. Vietnam
- 13.4.7. Malaysia
- 13.4.8. Indonesia
- 13.4.9. Philippines
- 13.4.10. Thailand
- 13.4.11. Rest of Asia-Pacific
- 13.1. Market Analysis, Insights and Forecast - by Technology
- 14. Philippines APAC Insulin Infusion Industry Analysis, Insights and Forecast, 2019-2031
- 14.1. Market Analysis, Insights and Forecast - by Technology
- 14.1.1. Tethered Insulin Pump
- 14.1.2. Tubeless Insulin Pump
- 14.2. Market Analysis, Insights and Forecast - by Component
- 14.2.1. Insulin Pump Device
- 14.2.2. Insulin Pump Reservoir
- 14.2.3. Infusion Set
- 14.3. Market Analysis, Insights and Forecast - by End User
- 14.3.1. Hospital/Clinics
- 14.3.2. Home/Personal
- 14.4. Market Analysis, Insights and Forecast - by Geography
- 14.4.1. Japan
- 14.4.2. South Korea
- 14.4.3. China
- 14.4.4. India
- 14.4.5. Australia
- 14.4.6. Vietnam
- 14.4.7. Malaysia
- 14.4.8. Indonesia
- 14.4.9. Philippines
- 14.4.10. Thailand
- 14.4.11. Rest of Asia-Pacific
- 14.1. Market Analysis, Insights and Forecast - by Technology
- 15. Thailand APAC Insulin Infusion Industry Analysis, Insights and Forecast, 2019-2031
- 15.1. Market Analysis, Insights and Forecast - by Technology
- 15.1.1. Tethered Insulin Pump
- 15.1.2. Tubeless Insulin Pump
- 15.2. Market Analysis, Insights and Forecast - by Component
- 15.2.1. Insulin Pump Device
- 15.2.2. Insulin Pump Reservoir
- 15.2.3. Infusion Set
- 15.3. Market Analysis, Insights and Forecast - by End User
- 15.3.1. Hospital/Clinics
- 15.3.2. Home/Personal
- 15.4. Market Analysis, Insights and Forecast - by Geography
- 15.4.1. Japan
- 15.4.2. South Korea
- 15.4.3. China
- 15.4.4. India
- 15.4.5. Australia
- 15.4.6. Vietnam
- 15.4.7. Malaysia
- 15.4.8. Indonesia
- 15.4.9. Philippines
- 15.4.10. Thailand
- 15.4.11. Rest of Asia-Pacific
- 15.1. Market Analysis, Insights and Forecast - by Technology
- 16. Rest of Asia Pacific APAC Insulin Infusion Industry Analysis, Insights and Forecast, 2019-2031
- 16.1. Market Analysis, Insights and Forecast - by Technology
- 16.1.1. Tethered Insulin Pump
- 16.1.2. Tubeless Insulin Pump
- 16.2. Market Analysis, Insights and Forecast - by Component
- 16.2.1. Insulin Pump Device
- 16.2.2. Insulin Pump Reservoir
- 16.2.3. Infusion Set
- 16.3. Market Analysis, Insights and Forecast - by End User
- 16.3.1. Hospital/Clinics
- 16.3.2. Home/Personal
- 16.4. Market Analysis, Insights and Forecast - by Geography
- 16.4.1. Japan
- 16.4.2. South Korea
- 16.4.3. China
- 16.4.4. India
- 16.4.5. Australia
- 16.4.6. Vietnam
- 16.4.7. Malaysia
- 16.4.8. Indonesia
- 16.4.9. Philippines
- 16.4.10. Thailand
- 16.4.11. Rest of Asia-Pacific
- 16.1. Market Analysis, Insights and Forecast - by Technology
- 17. North America APAC Insulin Infusion Industry Analysis, Insights and Forecast, 2019-2031
- 17.1. Market Analysis, Insights and Forecast - By Country/Sub-region
- 17.1.1 United States
- 17.1.2 Canada
- 17.1.3 Mexico
- 18. Europe APAC Insulin Infusion Industry Analysis, Insights and Forecast, 2019-2031
- 18.1. Market Analysis, Insights and Forecast - By Country/Sub-region
- 18.1.1 Germany
- 18.1.2 United Kingdom
- 18.1.3 France
- 18.1.4 Spain
- 18.1.5 Italy
- 18.1.6 Spain
- 18.1.7 Belgium
- 18.1.8 Netherland
- 18.1.9 Nordics
- 18.1.10 Rest of Europe
- 19. Asia Pacific APAC Insulin Infusion Industry Analysis, Insights and Forecast, 2019-2031
- 19.1. Market Analysis, Insights and Forecast - By Country/Sub-region
- 19.1.1 China
- 19.1.2 Japan
- 19.1.3 India
- 19.1.4 South Korea
- 19.1.5 Southeast Asia
- 19.1.6 Australia
- 19.1.7 Indonesia
- 19.1.8 Phillipes
- 19.1.9 Singapore
- 19.1.10 Thailandc
- 19.1.11 Rest of Asia Pacific
- 20. South America APAC Insulin Infusion Industry Analysis, Insights and Forecast, 2019-2031
- 20.1. Market Analysis, Insights and Forecast - By Country/Sub-region
- 20.1.1 Brazil
- 20.1.2 Argentina
- 20.1.3 Peru
- 20.1.4 Chile
- 20.1.5 Colombia
- 20.1.6 Ecuador
- 20.1.7 Venezuela
- 20.1.8 Rest of South America
- 21. North America APAC Insulin Infusion Industry Analysis, Insights and Forecast, 2019-2031
- 21.1. Market Analysis, Insights and Forecast - By Country/Sub-region
- 21.1.1 United States
- 21.1.2 Canada
- 21.1.3 Mexico
- 22. MEA APAC Insulin Infusion Industry Analysis, Insights and Forecast, 2019-2031
- 22.1. Market Analysis, Insights and Forecast - By Country/Sub-region
- 22.1.1 United Arab Emirates
- 22.1.2 Saudi Arabia
- 22.1.3 South Africa
- 22.1.4 Rest of Middle East and Africa
- 23. Competitive Analysis
- 23.1. Global Market Share Analysis 2024
- 23.2. Company Profiles
- 23.2.1 Terumo
- 23.2.1.1. Overview
- 23.2.1.2. Products
- 23.2.1.3. SWOT Analysis
- 23.2.1.4. Recent Developments
- 23.2.1.5. Financials (Based on Availability)
- 23.2.2 Roche
- 23.2.2.1. Overview
- 23.2.2.2. Products
- 23.2.2.3. SWOT Analysis
- 23.2.2.4. Recent Developments
- 23.2.2.5. Financials (Based on Availability)
- 23.2.3 Ypsomed
- 23.2.3.1. Overview
- 23.2.3.2. Products
- 23.2.3.3. SWOT Analysis
- 23.2.3.4. Recent Developments
- 23.2.3.5. Financials (Based on Availability)
- 23.2.4 Medtronic
- 23.2.4.1. Overview
- 23.2.4.2. Products
- 23.2.4.3. SWOT Analysis
- 23.2.4.4. Recent Developments
- 23.2.4.5. Financials (Based on Availability)
- 23.2.5 Cellnovo
- 23.2.5.1. Overview
- 23.2.5.2. Products
- 23.2.5.3. SWOT Analysis
- 23.2.5.4. Recent Developments
- 23.2.5.5. Financials (Based on Availability)
- 23.2.6 Animas
- 23.2.6.1. Overview
- 23.2.6.2. Products
- 23.2.6.3. SWOT Analysis
- 23.2.6.4. Recent Developments
- 23.2.6.5. Financials (Based on Availability)
- 23.2.7 Tandem
- 23.2.7.1. Overview
- 23.2.7.2. Products
- 23.2.7.3. SWOT Analysis
- 23.2.7.4. Recent Developments
- 23.2.7.5. Financials (Based on Availability)
- 23.2.8 Insulet
- 23.2.8.1. Overview
- 23.2.8.2. Products
- 23.2.8.3. SWOT Analysis
- 23.2.8.4. Recent Developments
- 23.2.8.5. Financials (Based on Availability)
- 23.2.9 Other Company Share Analyse
- 23.2.9.1. Overview
- 23.2.9.2. Products
- 23.2.9.3. SWOT Analysis
- 23.2.9.4. Recent Developments
- 23.2.9.5. Financials (Based on Availability)
- 23.2.1 Terumo
List of Figures
- Figure 1: Global APAC Insulin Infusion Industry Revenue Breakdown (Million, %) by Region 2024 & 2032
- Figure 2: Global APAC Insulin Infusion Industry Volume Breakdown (K Unit, %) by Region 2024 & 2032
- Figure 3: North America APAC Insulin Infusion Industry Revenue (Million), by Country 2024 & 2032
- Figure 4: North America APAC Insulin Infusion Industry Volume (K Unit), by Country 2024 & 2032
- Figure 5: North America APAC Insulin Infusion Industry Revenue Share (%), by Country 2024 & 2032
- Figure 6: North America APAC Insulin Infusion Industry Volume Share (%), by Country 2024 & 2032
- Figure 7: Europe APAC Insulin Infusion Industry Revenue (Million), by Country 2024 & 2032
- Figure 8: Europe APAC Insulin Infusion Industry Volume (K Unit), by Country 2024 & 2032
- Figure 9: Europe APAC Insulin Infusion Industry Revenue Share (%), by Country 2024 & 2032
- Figure 10: Europe APAC Insulin Infusion Industry Volume Share (%), by Country 2024 & 2032
- Figure 11: Asia Pacific APAC Insulin Infusion Industry Revenue (Million), by Country 2024 & 2032
- Figure 12: Asia Pacific APAC Insulin Infusion Industry Volume (K Unit), by Country 2024 & 2032
- Figure 13: Asia Pacific APAC Insulin Infusion Industry Revenue Share (%), by Country 2024 & 2032
- Figure 14: Asia Pacific APAC Insulin Infusion Industry Volume Share (%), by Country 2024 & 2032
- Figure 15: South America APAC Insulin Infusion Industry Revenue (Million), by Country 2024 & 2032
- Figure 16: South America APAC Insulin Infusion Industry Volume (K Unit), by Country 2024 & 2032
- Figure 17: South America APAC Insulin Infusion Industry Revenue Share (%), by Country 2024 & 2032
- Figure 18: South America APAC Insulin Infusion Industry Volume Share (%), by Country 2024 & 2032
- Figure 19: North America APAC Insulin Infusion Industry Revenue (Million), by Country 2024 & 2032
- Figure 20: North America APAC Insulin Infusion Industry Volume (K Unit), by Country 2024 & 2032
- Figure 21: North America APAC Insulin Infusion Industry Revenue Share (%), by Country 2024 & 2032
- Figure 22: North America APAC Insulin Infusion Industry Volume Share (%), by Country 2024 & 2032
- Figure 23: MEA APAC Insulin Infusion Industry Revenue (Million), by Country 2024 & 2032
- Figure 24: MEA APAC Insulin Infusion Industry Volume (K Unit), by Country 2024 & 2032
- Figure 25: MEA APAC Insulin Infusion Industry Revenue Share (%), by Country 2024 & 2032
- Figure 26: MEA APAC Insulin Infusion Industry Volume Share (%), by Country 2024 & 2032
- Figure 27: Japan APAC Insulin Infusion Industry Revenue (Million), by Technology 2024 & 2032
- Figure 28: Japan APAC Insulin Infusion Industry Volume (K Unit), by Technology 2024 & 2032
- Figure 29: Japan APAC Insulin Infusion Industry Revenue Share (%), by Technology 2024 & 2032
- Figure 30: Japan APAC Insulin Infusion Industry Volume Share (%), by Technology 2024 & 2032
- Figure 31: Japan APAC Insulin Infusion Industry Revenue (Million), by Component 2024 & 2032
- Figure 32: Japan APAC Insulin Infusion Industry Volume (K Unit), by Component 2024 & 2032
- Figure 33: Japan APAC Insulin Infusion Industry Revenue Share (%), by Component 2024 & 2032
- Figure 34: Japan APAC Insulin Infusion Industry Volume Share (%), by Component 2024 & 2032
- Figure 35: Japan APAC Insulin Infusion Industry Revenue (Million), by End User 2024 & 2032
- Figure 36: Japan APAC Insulin Infusion Industry Volume (K Unit), by End User 2024 & 2032
- Figure 37: Japan APAC Insulin Infusion Industry Revenue Share (%), by End User 2024 & 2032
- Figure 38: Japan APAC Insulin Infusion Industry Volume Share (%), by End User 2024 & 2032
- Figure 39: Japan APAC Insulin Infusion Industry Revenue (Million), by Geography 2024 & 2032
- Figure 40: Japan APAC Insulin Infusion Industry Volume (K Unit), by Geography 2024 & 2032
- Figure 41: Japan APAC Insulin Infusion Industry Revenue Share (%), by Geography 2024 & 2032
- Figure 42: Japan APAC Insulin Infusion Industry Volume Share (%), by Geography 2024 & 2032
- Figure 43: Japan APAC Insulin Infusion Industry Revenue (Million), by Country 2024 & 2032
- Figure 44: Japan APAC Insulin Infusion Industry Volume (K Unit), by Country 2024 & 2032
- Figure 45: Japan APAC Insulin Infusion Industry Revenue Share (%), by Country 2024 & 2032
- Figure 46: Japan APAC Insulin Infusion Industry Volume Share (%), by Country 2024 & 2032
- Figure 47: South Korea APAC Insulin Infusion Industry Revenue (Million), by Technology 2024 & 2032
- Figure 48: South Korea APAC Insulin Infusion Industry Volume (K Unit), by Technology 2024 & 2032
- Figure 49: South Korea APAC Insulin Infusion Industry Revenue Share (%), by Technology 2024 & 2032
- Figure 50: South Korea APAC Insulin Infusion Industry Volume Share (%), by Technology 2024 & 2032
- Figure 51: South Korea APAC Insulin Infusion Industry Revenue (Million), by Component 2024 & 2032
- Figure 52: South Korea APAC Insulin Infusion Industry Volume (K Unit), by Component 2024 & 2032
- Figure 53: South Korea APAC Insulin Infusion Industry Revenue Share (%), by Component 2024 & 2032
- Figure 54: South Korea APAC Insulin Infusion Industry Volume Share (%), by Component 2024 & 2032
- Figure 55: South Korea APAC Insulin Infusion Industry Revenue (Million), by End User 2024 & 2032
- Figure 56: South Korea APAC Insulin Infusion Industry Volume (K Unit), by End User 2024 & 2032
- Figure 57: South Korea APAC Insulin Infusion Industry Revenue Share (%), by End User 2024 & 2032
- Figure 58: South Korea APAC Insulin Infusion Industry Volume Share (%), by End User 2024 & 2032
- Figure 59: South Korea APAC Insulin Infusion Industry Revenue (Million), by Geography 2024 & 2032
- Figure 60: South Korea APAC Insulin Infusion Industry Volume (K Unit), by Geography 2024 & 2032
- Figure 61: South Korea APAC Insulin Infusion Industry Revenue Share (%), by Geography 2024 & 2032
- Figure 62: South Korea APAC Insulin Infusion Industry Volume Share (%), by Geography 2024 & 2032
- Figure 63: South Korea APAC Insulin Infusion Industry Revenue (Million), by Country 2024 & 2032
- Figure 64: South Korea APAC Insulin Infusion Industry Volume (K Unit), by Country 2024 & 2032
- Figure 65: South Korea APAC Insulin Infusion Industry Revenue Share (%), by Country 2024 & 2032
- Figure 66: South Korea APAC Insulin Infusion Industry Volume Share (%), by Country 2024 & 2032
- Figure 67: China APAC Insulin Infusion Industry Revenue (Million), by Technology 2024 & 2032
- Figure 68: China APAC Insulin Infusion Industry Volume (K Unit), by Technology 2024 & 2032
- Figure 69: China APAC Insulin Infusion Industry Revenue Share (%), by Technology 2024 & 2032
- Figure 70: China APAC Insulin Infusion Industry Volume Share (%), by Technology 2024 & 2032
- Figure 71: China APAC Insulin Infusion Industry Revenue (Million), by Component 2024 & 2032
- Figure 72: China APAC Insulin Infusion Industry Volume (K Unit), by Component 2024 & 2032
- Figure 73: China APAC Insulin Infusion Industry Revenue Share (%), by Component 2024 & 2032
- Figure 74: China APAC Insulin Infusion Industry Volume Share (%), by Component 2024 & 2032
- Figure 75: China APAC Insulin Infusion Industry Revenue (Million), by End User 2024 & 2032
- Figure 76: China APAC Insulin Infusion Industry Volume (K Unit), by End User 2024 & 2032
- Figure 77: China APAC Insulin Infusion Industry Revenue Share (%), by End User 2024 & 2032
- Figure 78: China APAC Insulin Infusion Industry Volume Share (%), by End User 2024 & 2032
- Figure 79: China APAC Insulin Infusion Industry Revenue (Million), by Geography 2024 & 2032
- Figure 80: China APAC Insulin Infusion Industry Volume (K Unit), by Geography 2024 & 2032
- Figure 81: China APAC Insulin Infusion Industry Revenue Share (%), by Geography 2024 & 2032
- Figure 82: China APAC Insulin Infusion Industry Volume Share (%), by Geography 2024 & 2032
- Figure 83: China APAC Insulin Infusion Industry Revenue (Million), by Country 2024 & 2032
- Figure 84: China APAC Insulin Infusion Industry Volume (K Unit), by Country 2024 & 2032
- Figure 85: China APAC Insulin Infusion Industry Revenue Share (%), by Country 2024 & 2032
- Figure 86: China APAC Insulin Infusion Industry Volume Share (%), by Country 2024 & 2032
- Figure 87: India APAC Insulin Infusion Industry Revenue (Million), by Technology 2024 & 2032
- Figure 88: India APAC Insulin Infusion Industry Volume (K Unit), by Technology 2024 & 2032
- Figure 89: India APAC Insulin Infusion Industry Revenue Share (%), by Technology 2024 & 2032
- Figure 90: India APAC Insulin Infusion Industry Volume Share (%), by Technology 2024 & 2032
- Figure 91: India APAC Insulin Infusion Industry Revenue (Million), by Component 2024 & 2032
- Figure 92: India APAC Insulin Infusion Industry Volume (K Unit), by Component 2024 & 2032
- Figure 93: India APAC Insulin Infusion Industry Revenue Share (%), by Component 2024 & 2032
- Figure 94: India APAC Insulin Infusion Industry Volume Share (%), by Component 2024 & 2032
- Figure 95: India APAC Insulin Infusion Industry Revenue (Million), by End User 2024 & 2032
- Figure 96: India APAC Insulin Infusion Industry Volume (K Unit), by End User 2024 & 2032
- Figure 97: India APAC Insulin Infusion Industry Revenue Share (%), by End User 2024 & 2032
- Figure 98: India APAC Insulin Infusion Industry Volume Share (%), by End User 2024 & 2032
- Figure 99: India APAC Insulin Infusion Industry Revenue (Million), by Geography 2024 & 2032
- Figure 100: India APAC Insulin Infusion Industry Volume (K Unit), by Geography 2024 & 2032
- Figure 101: India APAC Insulin Infusion Industry Revenue Share (%), by Geography 2024 & 2032
- Figure 102: India APAC Insulin Infusion Industry Volume Share (%), by Geography 2024 & 2032
- Figure 103: India APAC Insulin Infusion Industry Revenue (Million), by Country 2024 & 2032
- Figure 104: India APAC Insulin Infusion Industry Volume (K Unit), by Country 2024 & 2032
- Figure 105: India APAC Insulin Infusion Industry Revenue Share (%), by Country 2024 & 2032
- Figure 106: India APAC Insulin Infusion Industry Volume Share (%), by Country 2024 & 2032
- Figure 107: Australia APAC Insulin Infusion Industry Revenue (Million), by Technology 2024 & 2032
- Figure 108: Australia APAC Insulin Infusion Industry Volume (K Unit), by Technology 2024 & 2032
- Figure 109: Australia APAC Insulin Infusion Industry Revenue Share (%), by Technology 2024 & 2032
- Figure 110: Australia APAC Insulin Infusion Industry Volume Share (%), by Technology 2024 & 2032
- Figure 111: Australia APAC Insulin Infusion Industry Revenue (Million), by Component 2024 & 2032
- Figure 112: Australia APAC Insulin Infusion Industry Volume (K Unit), by Component 2024 & 2032
- Figure 113: Australia APAC Insulin Infusion Industry Revenue Share (%), by Component 2024 & 2032
- Figure 114: Australia APAC Insulin Infusion Industry Volume Share (%), by Component 2024 & 2032
- Figure 115: Australia APAC Insulin Infusion Industry Revenue (Million), by End User 2024 & 2032
- Figure 116: Australia APAC Insulin Infusion Industry Volume (K Unit), by End User 2024 & 2032
- Figure 117: Australia APAC Insulin Infusion Industry Revenue Share (%), by End User 2024 & 2032
- Figure 118: Australia APAC Insulin Infusion Industry Volume Share (%), by End User 2024 & 2032
- Figure 119: Australia APAC Insulin Infusion Industry Revenue (Million), by Geography 2024 & 2032
- Figure 120: Australia APAC Insulin Infusion Industry Volume (K Unit), by Geography 2024 & 2032
- Figure 121: Australia APAC Insulin Infusion Industry Revenue Share (%), by Geography 2024 & 2032
- Figure 122: Australia APAC Insulin Infusion Industry Volume Share (%), by Geography 2024 & 2032
- Figure 123: Australia APAC Insulin Infusion Industry Revenue (Million), by Country 2024 & 2032
- Figure 124: Australia APAC Insulin Infusion Industry Volume (K Unit), by Country 2024 & 2032
- Figure 125: Australia APAC Insulin Infusion Industry Revenue Share (%), by Country 2024 & 2032
- Figure 126: Australia APAC Insulin Infusion Industry Volume Share (%), by Country 2024 & 2032
- Figure 127: Vietnam APAC Insulin Infusion Industry Revenue (Million), by Technology 2024 & 2032
- Figure 128: Vietnam APAC Insulin Infusion Industry Volume (K Unit), by Technology 2024 & 2032
- Figure 129: Vietnam APAC Insulin Infusion Industry Revenue Share (%), by Technology 2024 & 2032
- Figure 130: Vietnam APAC Insulin Infusion Industry Volume Share (%), by Technology 2024 & 2032
- Figure 131: Vietnam APAC Insulin Infusion Industry Revenue (Million), by Component 2024 & 2032
- Figure 132: Vietnam APAC Insulin Infusion Industry Volume (K Unit), by Component 2024 & 2032
- Figure 133: Vietnam APAC Insulin Infusion Industry Revenue Share (%), by Component 2024 & 2032
- Figure 134: Vietnam APAC Insulin Infusion Industry Volume Share (%), by Component 2024 & 2032
- Figure 135: Vietnam APAC Insulin Infusion Industry Revenue (Million), by End User 2024 & 2032
- Figure 136: Vietnam APAC Insulin Infusion Industry Volume (K Unit), by End User 2024 & 2032
- Figure 137: Vietnam APAC Insulin Infusion Industry Revenue Share (%), by End User 2024 & 2032
- Figure 138: Vietnam APAC Insulin Infusion Industry Volume Share (%), by End User 2024 & 2032
- Figure 139: Vietnam APAC Insulin Infusion Industry Revenue (Million), by Geography 2024 & 2032
- Figure 140: Vietnam APAC Insulin Infusion Industry Volume (K Unit), by Geography 2024 & 2032
- Figure 141: Vietnam APAC Insulin Infusion Industry Revenue Share (%), by Geography 2024 & 2032
- Figure 142: Vietnam APAC Insulin Infusion Industry Volume Share (%), by Geography 2024 & 2032
- Figure 143: Vietnam APAC Insulin Infusion Industry Revenue (Million), by Country 2024 & 2032
- Figure 144: Vietnam APAC Insulin Infusion Industry Volume (K Unit), by Country 2024 & 2032
- Figure 145: Vietnam APAC Insulin Infusion Industry Revenue Share (%), by Country 2024 & 2032
- Figure 146: Vietnam APAC Insulin Infusion Industry Volume Share (%), by Country 2024 & 2032
- Figure 147: Malaysia APAC Insulin Infusion Industry Revenue (Million), by Technology 2024 & 2032
- Figure 148: Malaysia APAC Insulin Infusion Industry Volume (K Unit), by Technology 2024 & 2032
- Figure 149: Malaysia APAC Insulin Infusion Industry Revenue Share (%), by Technology 2024 & 2032
- Figure 150: Malaysia APAC Insulin Infusion Industry Volume Share (%), by Technology 2024 & 2032
- Figure 151: Malaysia APAC Insulin Infusion Industry Revenue (Million), by Component 2024 & 2032
- Figure 152: Malaysia APAC Insulin Infusion Industry Volume (K Unit), by Component 2024 & 2032
- Figure 153: Malaysia APAC Insulin Infusion Industry Revenue Share (%), by Component 2024 & 2032
- Figure 154: Malaysia APAC Insulin Infusion Industry Volume Share (%), by Component 2024 & 2032
- Figure 155: Malaysia APAC Insulin Infusion Industry Revenue (Million), by End User 2024 & 2032
- Figure 156: Malaysia APAC Insulin Infusion Industry Volume (K Unit), by End User 2024 & 2032
- Figure 157: Malaysia APAC Insulin Infusion Industry Revenue Share (%), by End User 2024 & 2032
- Figure 158: Malaysia APAC Insulin Infusion Industry Volume Share (%), by End User 2024 & 2032
- Figure 159: Malaysia APAC Insulin Infusion Industry Revenue (Million), by Geography 2024 & 2032
- Figure 160: Malaysia APAC Insulin Infusion Industry Volume (K Unit), by Geography 2024 & 2032
- Figure 161: Malaysia APAC Insulin Infusion Industry Revenue Share (%), by Geography 2024 & 2032
- Figure 162: Malaysia APAC Insulin Infusion Industry Volume Share (%), by Geography 2024 & 2032
- Figure 163: Malaysia APAC Insulin Infusion Industry Revenue (Million), by Country 2024 & 2032
- Figure 164: Malaysia APAC Insulin Infusion Industry Volume (K Unit), by Country 2024 & 2032
- Figure 165: Malaysia APAC Insulin Infusion Industry Revenue Share (%), by Country 2024 & 2032
- Figure 166: Malaysia APAC Insulin Infusion Industry Volume Share (%), by Country 2024 & 2032
- Figure 167: Indonesia APAC Insulin Infusion Industry Revenue (Million), by Technology 2024 & 2032
- Figure 168: Indonesia APAC Insulin Infusion Industry Volume (K Unit), by Technology 2024 & 2032
- Figure 169: Indonesia APAC Insulin Infusion Industry Revenue Share (%), by Technology 2024 & 2032
- Figure 170: Indonesia APAC Insulin Infusion Industry Volume Share (%), by Technology 2024 & 2032
- Figure 171: Indonesia APAC Insulin Infusion Industry Revenue (Million), by Component 2024 & 2032
- Figure 172: Indonesia APAC Insulin Infusion Industry Volume (K Unit), by Component 2024 & 2032
- Figure 173: Indonesia APAC Insulin Infusion Industry Revenue Share (%), by Component 2024 & 2032
- Figure 174: Indonesia APAC Insulin Infusion Industry Volume Share (%), by Component 2024 & 2032
- Figure 175: Indonesia APAC Insulin Infusion Industry Revenue (Million), by End User 2024 & 2032
- Figure 176: Indonesia APAC Insulin Infusion Industry Volume (K Unit), by End User 2024 & 2032
- Figure 177: Indonesia APAC Insulin Infusion Industry Revenue Share (%), by End User 2024 & 2032
- Figure 178: Indonesia APAC Insulin Infusion Industry Volume Share (%), by End User 2024 & 2032
- Figure 179: Indonesia APAC Insulin Infusion Industry Revenue (Million), by Geography 2024 & 2032
- Figure 180: Indonesia APAC Insulin Infusion Industry Volume (K Unit), by Geography 2024 & 2032
- Figure 181: Indonesia APAC Insulin Infusion Industry Revenue Share (%), by Geography 2024 & 2032
- Figure 182: Indonesia APAC Insulin Infusion Industry Volume Share (%), by Geography 2024 & 2032
- Figure 183: Indonesia APAC Insulin Infusion Industry Revenue (Million), by Country 2024 & 2032
- Figure 184: Indonesia APAC Insulin Infusion Industry Volume (K Unit), by Country 2024 & 2032
- Figure 185: Indonesia APAC Insulin Infusion Industry Revenue Share (%), by Country 2024 & 2032
- Figure 186: Indonesia APAC Insulin Infusion Industry Volume Share (%), by Country 2024 & 2032
- Figure 187: Philippines APAC Insulin Infusion Industry Revenue (Million), by Technology 2024 & 2032
- Figure 188: Philippines APAC Insulin Infusion Industry Volume (K Unit), by Technology 2024 & 2032
- Figure 189: Philippines APAC Insulin Infusion Industry Revenue Share (%), by Technology 2024 & 2032
- Figure 190: Philippines APAC Insulin Infusion Industry Volume Share (%), by Technology 2024 & 2032
- Figure 191: Philippines APAC Insulin Infusion Industry Revenue (Million), by Component 2024 & 2032
- Figure 192: Philippines APAC Insulin Infusion Industry Volume (K Unit), by Component 2024 & 2032
- Figure 193: Philippines APAC Insulin Infusion Industry Revenue Share (%), by Component 2024 & 2032
- Figure 194: Philippines APAC Insulin Infusion Industry Volume Share (%), by Component 2024 & 2032
- Figure 195: Philippines APAC Insulin Infusion Industry Revenue (Million), by End User 2024 & 2032
- Figure 196: Philippines APAC Insulin Infusion Industry Volume (K Unit), by End User 2024 & 2032
- Figure 197: Philippines APAC Insulin Infusion Industry Revenue Share (%), by End User 2024 & 2032
- Figure 198: Philippines APAC Insulin Infusion Industry Volume Share (%), by End User 2024 & 2032
- Figure 199: Philippines APAC Insulin Infusion Industry Revenue (Million), by Geography 2024 & 2032
- Figure 200: Philippines APAC Insulin Infusion Industry Volume (K Unit), by Geography 2024 & 2032
- Figure 201: Philippines APAC Insulin Infusion Industry Revenue Share (%), by Geography 2024 & 2032
- Figure 202: Philippines APAC Insulin Infusion Industry Volume Share (%), by Geography 2024 & 2032
- Figure 203: Philippines APAC Insulin Infusion Industry Revenue (Million), by Country 2024 & 2032
- Figure 204: Philippines APAC Insulin Infusion Industry Volume (K Unit), by Country 2024 & 2032
- Figure 205: Philippines APAC Insulin Infusion Industry Revenue Share (%), by Country 2024 & 2032
- Figure 206: Philippines APAC Insulin Infusion Industry Volume Share (%), by Country 2024 & 2032
- Figure 207: Thailand APAC Insulin Infusion Industry Revenue (Million), by Technology 2024 & 2032
- Figure 208: Thailand APAC Insulin Infusion Industry Volume (K Unit), by Technology 2024 & 2032
- Figure 209: Thailand APAC Insulin Infusion Industry Revenue Share (%), by Technology 2024 & 2032
- Figure 210: Thailand APAC Insulin Infusion Industry Volume Share (%), by Technology 2024 & 2032
- Figure 211: Thailand APAC Insulin Infusion Industry Revenue (Million), by Component 2024 & 2032
- Figure 212: Thailand APAC Insulin Infusion Industry Volume (K Unit), by Component 2024 & 2032
- Figure 213: Thailand APAC Insulin Infusion Industry Revenue Share (%), by Component 2024 & 2032
- Figure 214: Thailand APAC Insulin Infusion Industry Volume Share (%), by Component 2024 & 2032
- Figure 215: Thailand APAC Insulin Infusion Industry Revenue (Million), by End User 2024 & 2032
- Figure 216: Thailand APAC Insulin Infusion Industry Volume (K Unit), by End User 2024 & 2032
- Figure 217: Thailand APAC Insulin Infusion Industry Revenue Share (%), by End User 2024 & 2032
- Figure 218: Thailand APAC Insulin Infusion Industry Volume Share (%), by End User 2024 & 2032
- Figure 219: Thailand APAC Insulin Infusion Industry Revenue (Million), by Geography 2024 & 2032
- Figure 220: Thailand APAC Insulin Infusion Industry Volume (K Unit), by Geography 2024 & 2032
- Figure 221: Thailand APAC Insulin Infusion Industry Revenue Share (%), by Geography 2024 & 2032
- Figure 222: Thailand APAC Insulin Infusion Industry Volume Share (%), by Geography 2024 & 2032
- Figure 223: Thailand APAC Insulin Infusion Industry Revenue (Million), by Country 2024 & 2032
- Figure 224: Thailand APAC Insulin Infusion Industry Volume (K Unit), by Country 2024 & 2032
- Figure 225: Thailand APAC Insulin Infusion Industry Revenue Share (%), by Country 2024 & 2032
- Figure 226: Thailand APAC Insulin Infusion Industry Volume Share (%), by Country 2024 & 2032
- Figure 227: Rest of Asia Pacific APAC Insulin Infusion Industry Revenue (Million), by Technology 2024 & 2032
- Figure 228: Rest of Asia Pacific APAC Insulin Infusion Industry Volume (K Unit), by Technology 2024 & 2032
- Figure 229: Rest of Asia Pacific APAC Insulin Infusion Industry Revenue Share (%), by Technology 2024 & 2032
- Figure 230: Rest of Asia Pacific APAC Insulin Infusion Industry Volume Share (%), by Technology 2024 & 2032
- Figure 231: Rest of Asia Pacific APAC Insulin Infusion Industry Revenue (Million), by Component 2024 & 2032
- Figure 232: Rest of Asia Pacific APAC Insulin Infusion Industry Volume (K Unit), by Component 2024 & 2032
- Figure 233: Rest of Asia Pacific APAC Insulin Infusion Industry Revenue Share (%), by Component 2024 & 2032
- Figure 234: Rest of Asia Pacific APAC Insulin Infusion Industry Volume Share (%), by Component 2024 & 2032
- Figure 235: Rest of Asia Pacific APAC Insulin Infusion Industry Revenue (Million), by End User 2024 & 2032
- Figure 236: Rest of Asia Pacific APAC Insulin Infusion Industry Volume (K Unit), by End User 2024 & 2032
- Figure 237: Rest of Asia Pacific APAC Insulin Infusion Industry Revenue Share (%), by End User 2024 & 2032
- Figure 238: Rest of Asia Pacific APAC Insulin Infusion Industry Volume Share (%), by End User 2024 & 2032
- Figure 239: Rest of Asia Pacific APAC Insulin Infusion Industry Revenue (Million), by Geography 2024 & 2032
- Figure 240: Rest of Asia Pacific APAC Insulin Infusion Industry Volume (K Unit), by Geography 2024 & 2032
- Figure 241: Rest of Asia Pacific APAC Insulin Infusion Industry Revenue Share (%), by Geography 2024 & 2032
- Figure 242: Rest of Asia Pacific APAC Insulin Infusion Industry Volume Share (%), by Geography 2024 & 2032
- Figure 243: Rest of Asia Pacific APAC Insulin Infusion Industry Revenue (Million), by Country 2024 & 2032
- Figure 244: Rest of Asia Pacific APAC Insulin Infusion Industry Volume (K Unit), by Country 2024 & 2032
- Figure 245: Rest of Asia Pacific APAC Insulin Infusion Industry Revenue Share (%), by Country 2024 & 2032
- Figure 246: Rest of Asia Pacific APAC Insulin Infusion Industry Volume Share (%), by Country 2024 & 2032
List of Tables
- Table 1: Global APAC Insulin Infusion Industry Revenue Million Forecast, by Region 2019 & 2032
- Table 2: Global APAC Insulin Infusion Industry Volume K Unit Forecast, by Region 2019 & 2032
- Table 3: Global APAC Insulin Infusion Industry Revenue Million Forecast, by Technology 2019 & 2032
- Table 4: Global APAC Insulin Infusion Industry Volume K Unit Forecast, by Technology 2019 & 2032
- Table 5: Global APAC Insulin Infusion Industry Revenue Million Forecast, by Component 2019 & 2032
- Table 6: Global APAC Insulin Infusion Industry Volume K Unit Forecast, by Component 2019 & 2032
- Table 7: Global APAC Insulin Infusion Industry Revenue Million Forecast, by End User 2019 & 2032
- Table 8: Global APAC Insulin Infusion Industry Volume K Unit Forecast, by End User 2019 & 2032
- Table 9: Global APAC Insulin Infusion Industry Revenue Million Forecast, by Geography 2019 & 2032
- Table 10: Global APAC Insulin Infusion Industry Volume K Unit Forecast, by Geography 2019 & 2032
- Table 11: Global APAC Insulin Infusion Industry Revenue Million Forecast, by Region 2019 & 2032
- Table 12: Global APAC Insulin Infusion Industry Volume K Unit Forecast, by Region 2019 & 2032
- Table 13: Global APAC Insulin Infusion Industry Revenue Million Forecast, by Country 2019 & 2032
- Table 14: Global APAC Insulin Infusion Industry Volume K Unit Forecast, by Country 2019 & 2032
- Table 15: United States APAC Insulin Infusion Industry Revenue (Million) Forecast, by Application 2019 & 2032
- Table 16: United States APAC Insulin Infusion Industry Volume (K Unit) Forecast, by Application 2019 & 2032
- Table 17: Canada APAC Insulin Infusion Industry Revenue (Million) Forecast, by Application 2019 & 2032
- Table 18: Canada APAC Insulin Infusion Industry Volume (K Unit) Forecast, by Application 2019 & 2032
- Table 19: Mexico APAC Insulin Infusion Industry Revenue (Million) Forecast, by Application 2019 & 2032
- Table 20: Mexico APAC Insulin Infusion Industry Volume (K Unit) Forecast, by Application 2019 & 2032
- Table 21: Global APAC Insulin Infusion Industry Revenue Million Forecast, by Country 2019 & 2032
- Table 22: Global APAC Insulin Infusion Industry Volume K Unit Forecast, by Country 2019 & 2032
- Table 23: Germany APAC Insulin Infusion Industry Revenue (Million) Forecast, by Application 2019 & 2032
- Table 24: Germany APAC Insulin Infusion Industry Volume (K Unit) Forecast, by Application 2019 & 2032
- Table 25: United Kingdom APAC Insulin Infusion Industry Revenue (Million) Forecast, by Application 2019 & 2032
- Table 26: United Kingdom APAC Insulin Infusion Industry Volume (K Unit) Forecast, by Application 2019 & 2032
- Table 27: France APAC Insulin Infusion Industry Revenue (Million) Forecast, by Application 2019 & 2032
- Table 28: France APAC Insulin Infusion Industry Volume (K Unit) Forecast, by Application 2019 & 2032
- Table 29: Spain APAC Insulin Infusion Industry Revenue (Million) Forecast, by Application 2019 & 2032
- Table 30: Spain APAC Insulin Infusion Industry Volume (K Unit) Forecast, by Application 2019 & 2032
- Table 31: Italy APAC Insulin Infusion Industry Revenue (Million) Forecast, by Application 2019 & 2032
- Table 32: Italy APAC Insulin Infusion Industry Volume (K Unit) Forecast, by Application 2019 & 2032
- Table 33: Spain APAC Insulin Infusion Industry Revenue (Million) Forecast, by Application 2019 & 2032
- Table 34: Spain APAC Insulin Infusion Industry Volume (K Unit) Forecast, by Application 2019 & 2032
- Table 35: Belgium APAC Insulin Infusion Industry Revenue (Million) Forecast, by Application 2019 & 2032
- Table 36: Belgium APAC Insulin Infusion Industry Volume (K Unit) Forecast, by Application 2019 & 2032
- Table 37: Netherland APAC Insulin Infusion Industry Revenue (Million) Forecast, by Application 2019 & 2032
- Table 38: Netherland APAC Insulin Infusion Industry Volume (K Unit) Forecast, by Application 2019 & 2032
- Table 39: Nordics APAC Insulin Infusion Industry Revenue (Million) Forecast, by Application 2019 & 2032
- Table 40: Nordics APAC Insulin Infusion Industry Volume (K Unit) Forecast, by Application 2019 & 2032
- Table 41: Rest of Europe APAC Insulin Infusion Industry Revenue (Million) Forecast, by Application 2019 & 2032
- Table 42: Rest of Europe APAC Insulin Infusion Industry Volume (K Unit) Forecast, by Application 2019 & 2032
- Table 43: Global APAC Insulin Infusion Industry Revenue Million Forecast, by Country 2019 & 2032
- Table 44: Global APAC Insulin Infusion Industry Volume K Unit Forecast, by Country 2019 & 2032
- Table 45: China APAC Insulin Infusion Industry Revenue (Million) Forecast, by Application 2019 & 2032
- Table 46: China APAC Insulin Infusion Industry Volume (K Unit) Forecast, by Application 2019 & 2032
- Table 47: Japan APAC Insulin Infusion Industry Revenue (Million) Forecast, by Application 2019 & 2032
- Table 48: Japan APAC Insulin Infusion Industry Volume (K Unit) Forecast, by Application 2019 & 2032
- Table 49: India APAC Insulin Infusion Industry Revenue (Million) Forecast, by Application 2019 & 2032
- Table 50: India APAC Insulin Infusion Industry Volume (K Unit) Forecast, by Application 2019 & 2032
- Table 51: South Korea APAC Insulin Infusion Industry Revenue (Million) Forecast, by Application 2019 & 2032
- Table 52: South Korea APAC Insulin Infusion Industry Volume (K Unit) Forecast, by Application 2019 & 2032
- Table 53: Southeast Asia APAC Insulin Infusion Industry Revenue (Million) Forecast, by Application 2019 & 2032
- Table 54: Southeast Asia APAC Insulin Infusion Industry Volume (K Unit) Forecast, by Application 2019 & 2032
- Table 55: Australia APAC Insulin Infusion Industry Revenue (Million) Forecast, by Application 2019 & 2032
- Table 56: Australia APAC Insulin Infusion Industry Volume (K Unit) Forecast, by Application 2019 & 2032
- Table 57: Indonesia APAC Insulin Infusion Industry Revenue (Million) Forecast, by Application 2019 & 2032
- Table 58: Indonesia APAC Insulin Infusion Industry Volume (K Unit) Forecast, by Application 2019 & 2032
- Table 59: Phillipes APAC Insulin Infusion Industry Revenue (Million) Forecast, by Application 2019 & 2032
- Table 60: Phillipes APAC Insulin Infusion Industry Volume (K Unit) Forecast, by Application 2019 & 2032
- Table 61: Singapore APAC Insulin Infusion Industry Revenue (Million) Forecast, by Application 2019 & 2032
- Table 62: Singapore APAC Insulin Infusion Industry Volume (K Unit) Forecast, by Application 2019 & 2032
- Table 63: Thailandc APAC Insulin Infusion Industry Revenue (Million) Forecast, by Application 2019 & 2032
- Table 64: Thailandc APAC Insulin Infusion Industry Volume (K Unit) Forecast, by Application 2019 & 2032
- Table 65: Rest of Asia Pacific APAC Insulin Infusion Industry Revenue (Million) Forecast, by Application 2019 & 2032
- Table 66: Rest of Asia Pacific APAC Insulin Infusion Industry Volume (K Unit) Forecast, by Application 2019 & 2032
- Table 67: Global APAC Insulin Infusion Industry Revenue Million Forecast, by Country 2019 & 2032
- Table 68: Global APAC Insulin Infusion Industry Volume K Unit Forecast, by Country 2019 & 2032
- Table 69: Brazil APAC Insulin Infusion Industry Revenue (Million) Forecast, by Application 2019 & 2032
- Table 70: Brazil APAC Insulin Infusion Industry Volume (K Unit) Forecast, by Application 2019 & 2032
- Table 71: Argentina APAC Insulin Infusion Industry Revenue (Million) Forecast, by Application 2019 & 2032
- Table 72: Argentina APAC Insulin Infusion Industry Volume (K Unit) Forecast, by Application 2019 & 2032
- Table 73: Peru APAC Insulin Infusion Industry Revenue (Million) Forecast, by Application 2019 & 2032
- Table 74: Peru APAC Insulin Infusion Industry Volume (K Unit) Forecast, by Application 2019 & 2032
- Table 75: Chile APAC Insulin Infusion Industry Revenue (Million) Forecast, by Application 2019 & 2032
- Table 76: Chile APAC Insulin Infusion Industry Volume (K Unit) Forecast, by Application 2019 & 2032
- Table 77: Colombia APAC Insulin Infusion Industry Revenue (Million) Forecast, by Application 2019 & 2032
- Table 78: Colombia APAC Insulin Infusion Industry Volume (K Unit) Forecast, by Application 2019 & 2032
- Table 79: Ecuador APAC Insulin Infusion Industry Revenue (Million) Forecast, by Application 2019 & 2032
- Table 80: Ecuador APAC Insulin Infusion Industry Volume (K Unit) Forecast, by Application 2019 & 2032
- Table 81: Venezuela APAC Insulin Infusion Industry Revenue (Million) Forecast, by Application 2019 & 2032
- Table 82: Venezuela APAC Insulin Infusion Industry Volume (K Unit) Forecast, by Application 2019 & 2032
- Table 83: Rest of South America APAC Insulin Infusion Industry Revenue (Million) Forecast, by Application 2019 & 2032
- Table 84: Rest of South America APAC Insulin Infusion Industry Volume (K Unit) Forecast, by Application 2019 & 2032
- Table 85: Global APAC Insulin Infusion Industry Revenue Million Forecast, by Country 2019 & 2032
- Table 86: Global APAC Insulin Infusion Industry Volume K Unit Forecast, by Country 2019 & 2032
- Table 87: United States APAC Insulin Infusion Industry Revenue (Million) Forecast, by Application 2019 & 2032
- Table 88: United States APAC Insulin Infusion Industry Volume (K Unit) Forecast, by Application 2019 & 2032
- Table 89: Canada APAC Insulin Infusion Industry Revenue (Million) Forecast, by Application 2019 & 2032
- Table 90: Canada APAC Insulin Infusion Industry Volume (K Unit) Forecast, by Application 2019 & 2032
- Table 91: Mexico APAC Insulin Infusion Industry Revenue (Million) Forecast, by Application 2019 & 2032
- Table 92: Mexico APAC Insulin Infusion Industry Volume (K Unit) Forecast, by Application 2019 & 2032
- Table 93: Global APAC Insulin Infusion Industry Revenue Million Forecast, by Country 2019 & 2032
- Table 94: Global APAC Insulin Infusion Industry Volume K Unit Forecast, by Country 2019 & 2032
- Table 95: United Arab Emirates APAC Insulin Infusion Industry Revenue (Million) Forecast, by Application 2019 & 2032
- Table 96: United Arab Emirates APAC Insulin Infusion Industry Volume (K Unit) Forecast, by Application 2019 & 2032
- Table 97: Saudi Arabia APAC Insulin Infusion Industry Revenue (Million) Forecast, by Application 2019 & 2032
- Table 98: Saudi Arabia APAC Insulin Infusion Industry Volume (K Unit) Forecast, by Application 2019 & 2032
- Table 99: South Africa APAC Insulin Infusion Industry Revenue (Million) Forecast, by Application 2019 & 2032
- Table 100: South Africa APAC Insulin Infusion Industry Volume (K Unit) Forecast, by Application 2019 & 2032
- Table 101: Rest of Middle East and Africa APAC Insulin Infusion Industry Revenue (Million) Forecast, by Application 2019 & 2032
- Table 102: Rest of Middle East and Africa APAC Insulin Infusion Industry Volume (K Unit) Forecast, by Application 2019 & 2032
- Table 103: Global APAC Insulin Infusion Industry Revenue Million Forecast, by Technology 2019 & 2032
- Table 104: Global APAC Insulin Infusion Industry Volume K Unit Forecast, by Technology 2019 & 2032
- Table 105: Global APAC Insulin Infusion Industry Revenue Million Forecast, by Component 2019 & 2032
- Table 106: Global APAC Insulin Infusion Industry Volume K Unit Forecast, by Component 2019 & 2032
- Table 107: Global APAC Insulin Infusion Industry Revenue Million Forecast, by End User 2019 & 2032
- Table 108: Global APAC Insulin Infusion Industry Volume K Unit Forecast, by End User 2019 & 2032
- Table 109: Global APAC Insulin Infusion Industry Revenue Million Forecast, by Geography 2019 & 2032
- Table 110: Global APAC Insulin Infusion Industry Volume K Unit Forecast, by Geography 2019 & 2032
- Table 111: Global APAC Insulin Infusion Industry Revenue Million Forecast, by Country 2019 & 2032
- Table 112: Global APAC Insulin Infusion Industry Volume K Unit Forecast, by Country 2019 & 2032
- Table 113: Global APAC Insulin Infusion Industry Revenue Million Forecast, by Technology 2019 & 2032
- Table 114: Global APAC Insulin Infusion Industry Volume K Unit Forecast, by Technology 2019 & 2032
- Table 115: Global APAC Insulin Infusion Industry Revenue Million Forecast, by Component 2019 & 2032
- Table 116: Global APAC Insulin Infusion Industry Volume K Unit Forecast, by Component 2019 & 2032
- Table 117: Global APAC Insulin Infusion Industry Revenue Million Forecast, by End User 2019 & 2032
- Table 118: Global APAC Insulin Infusion Industry Volume K Unit Forecast, by End User 2019 & 2032
- Table 119: Global APAC Insulin Infusion Industry Revenue Million Forecast, by Geography 2019 & 2032
- Table 120: Global APAC Insulin Infusion Industry Volume K Unit Forecast, by Geography 2019 & 2032
- Table 121: Global APAC Insulin Infusion Industry Revenue Million Forecast, by Country 2019 & 2032
- Table 122: Global APAC Insulin Infusion Industry Volume K Unit Forecast, by Country 2019 & 2032
- Table 123: Global APAC Insulin Infusion Industry Revenue Million Forecast, by Technology 2019 & 2032
- Table 124: Global APAC Insulin Infusion Industry Volume K Unit Forecast, by Technology 2019 & 2032
- Table 125: Global APAC Insulin Infusion Industry Revenue Million Forecast, by Component 2019 & 2032
- Table 126: Global APAC Insulin Infusion Industry Volume K Unit Forecast, by Component 2019 & 2032
- Table 127: Global APAC Insulin Infusion Industry Revenue Million Forecast, by End User 2019 & 2032
- Table 128: Global APAC Insulin Infusion Industry Volume K Unit Forecast, by End User 2019 & 2032
- Table 129: Global APAC Insulin Infusion Industry Revenue Million Forecast, by Geography 2019 & 2032
- Table 130: Global APAC Insulin Infusion Industry Volume K Unit Forecast, by Geography 2019 & 2032
- Table 131: Global APAC Insulin Infusion Industry Revenue Million Forecast, by Country 2019 & 2032
- Table 132: Global APAC Insulin Infusion Industry Volume K Unit Forecast, by Country 2019 & 2032
- Table 133: Global APAC Insulin Infusion Industry Revenue Million Forecast, by Technology 2019 & 2032
- Table 134: Global APAC Insulin Infusion Industry Volume K Unit Forecast, by Technology 2019 & 2032
- Table 135: Global APAC Insulin Infusion Industry Revenue Million Forecast, by Component 2019 & 2032
- Table 136: Global APAC Insulin Infusion Industry Volume K Unit Forecast, by Component 2019 & 2032
- Table 137: Global APAC Insulin Infusion Industry Revenue Million Forecast, by End User 2019 & 2032
- Table 138: Global APAC Insulin Infusion Industry Volume K Unit Forecast, by End User 2019 & 2032
- Table 139: Global APAC Insulin Infusion Industry Revenue Million Forecast, by Geography 2019 & 2032
- Table 140: Global APAC Insulin Infusion Industry Volume K Unit Forecast, by Geography 2019 & 2032
- Table 141: Global APAC Insulin Infusion Industry Revenue Million Forecast, by Country 2019 & 2032
- Table 142: Global APAC Insulin Infusion Industry Volume K Unit Forecast, by Country 2019 & 2032
- Table 143: Global APAC Insulin Infusion Industry Revenue Million Forecast, by Technology 2019 & 2032
- Table 144: Global APAC Insulin Infusion Industry Volume K Unit Forecast, by Technology 2019 & 2032
- Table 145: Global APAC Insulin Infusion Industry Revenue Million Forecast, by Component 2019 & 2032
- Table 146: Global APAC Insulin Infusion Industry Volume K Unit Forecast, by Component 2019 & 2032
- Table 147: Global APAC Insulin Infusion Industry Revenue Million Forecast, by End User 2019 & 2032
- Table 148: Global APAC Insulin Infusion Industry Volume K Unit Forecast, by End User 2019 & 2032
- Table 149: Global APAC Insulin Infusion Industry Revenue Million Forecast, by Geography 2019 & 2032
- Table 150: Global APAC Insulin Infusion Industry Volume K Unit Forecast, by Geography 2019 & 2032
- Table 151: Global APAC Insulin Infusion Industry Revenue Million Forecast, by Country 2019 & 2032
- Table 152: Global APAC Insulin Infusion Industry Volume K Unit Forecast, by Country 2019 & 2032
- Table 153: Global APAC Insulin Infusion Industry Revenue Million Forecast, by Technology 2019 & 2032
- Table 154: Global APAC Insulin Infusion Industry Volume K Unit Forecast, by Technology 2019 & 2032
- Table 155: Global APAC Insulin Infusion Industry Revenue Million Forecast, by Component 2019 & 2032
- Table 156: Global APAC Insulin Infusion Industry Volume K Unit Forecast, by Component 2019 & 2032
- Table 157: Global APAC Insulin Infusion Industry Revenue Million Forecast, by End User 2019 & 2032
- Table 158: Global APAC Insulin Infusion Industry Volume K Unit Forecast, by End User 2019 & 2032
- Table 159: Global APAC Insulin Infusion Industry Revenue Million Forecast, by Geography 2019 & 2032
- Table 160: Global APAC Insulin Infusion Industry Volume K Unit Forecast, by Geography 2019 & 2032
- Table 161: Global APAC Insulin Infusion Industry Revenue Million Forecast, by Country 2019 & 2032
- Table 162: Global APAC Insulin Infusion Industry Volume K Unit Forecast, by Country 2019 & 2032
- Table 163: Global APAC Insulin Infusion Industry Revenue Million Forecast, by Technology 2019 & 2032
- Table 164: Global APAC Insulin Infusion Industry Volume K Unit Forecast, by Technology 2019 & 2032
- Table 165: Global APAC Insulin Infusion Industry Revenue Million Forecast, by Component 2019 & 2032
- Table 166: Global APAC Insulin Infusion Industry Volume K Unit Forecast, by Component 2019 & 2032
- Table 167: Global APAC Insulin Infusion Industry Revenue Million Forecast, by End User 2019 & 2032
- Table 168: Global APAC Insulin Infusion Industry Volume K Unit Forecast, by End User 2019 & 2032
- Table 169: Global APAC Insulin Infusion Industry Revenue Million Forecast, by Geography 2019 & 2032
- Table 170: Global APAC Insulin Infusion Industry Volume K Unit Forecast, by Geography 2019 & 2032
- Table 171: Global APAC Insulin Infusion Industry Revenue Million Forecast, by Country 2019 & 2032
- Table 172: Global APAC Insulin Infusion Industry Volume K Unit Forecast, by Country 2019 & 2032
- Table 173: Global APAC Insulin Infusion Industry Revenue Million Forecast, by Technology 2019 & 2032
- Table 174: Global APAC Insulin Infusion Industry Volume K Unit Forecast, by Technology 2019 & 2032
- Table 175: Global APAC Insulin Infusion Industry Revenue Million Forecast, by Component 2019 & 2032
- Table 176: Global APAC Insulin Infusion Industry Volume K Unit Forecast, by Component 2019 & 2032
- Table 177: Global APAC Insulin Infusion Industry Revenue Million Forecast, by End User 2019 & 2032
- Table 178: Global APAC Insulin Infusion Industry Volume K Unit Forecast, by End User 2019 & 2032
- Table 179: Global APAC Insulin Infusion Industry Revenue Million Forecast, by Geography 2019 & 2032
- Table 180: Global APAC Insulin Infusion Industry Volume K Unit Forecast, by Geography 2019 & 2032
- Table 181: Global APAC Insulin Infusion Industry Revenue Million Forecast, by Country 2019 & 2032
- Table 182: Global APAC Insulin Infusion Industry Volume K Unit Forecast, by Country 2019 & 2032
- Table 183: Global APAC Insulin Infusion Industry Revenue Million Forecast, by Technology 2019 & 2032
- Table 184: Global APAC Insulin Infusion Industry Volume K Unit Forecast, by Technology 2019 & 2032
- Table 185: Global APAC Insulin Infusion Industry Revenue Million Forecast, by Component 2019 & 2032
- Table 186: Global APAC Insulin Infusion Industry Volume K Unit Forecast, by Component 2019 & 2032
- Table 187: Global APAC Insulin Infusion Industry Revenue Million Forecast, by End User 2019 & 2032
- Table 188: Global APAC Insulin Infusion Industry Volume K Unit Forecast, by End User 2019 & 2032
- Table 189: Global APAC Insulin Infusion Industry Revenue Million Forecast, by Geography 2019 & 2032
- Table 190: Global APAC Insulin Infusion Industry Volume K Unit Forecast, by Geography 2019 & 2032
- Table 191: Global APAC Insulin Infusion Industry Revenue Million Forecast, by Country 2019 & 2032
- Table 192: Global APAC Insulin Infusion Industry Volume K Unit Forecast, by Country 2019 & 2032
- Table 193: Global APAC Insulin Infusion Industry Revenue Million Forecast, by Technology 2019 & 2032
- Table 194: Global APAC Insulin Infusion Industry Volume K Unit Forecast, by Technology 2019 & 2032
- Table 195: Global APAC Insulin Infusion Industry Revenue Million Forecast, by Component 2019 & 2032
- Table 196: Global APAC Insulin Infusion Industry Volume K Unit Forecast, by Component 2019 & 2032
- Table 197: Global APAC Insulin Infusion Industry Revenue Million Forecast, by End User 2019 & 2032
- Table 198: Global APAC Insulin Infusion Industry Volume K Unit Forecast, by End User 2019 & 2032
- Table 199: Global APAC Insulin Infusion Industry Revenue Million Forecast, by Geography 2019 & 2032
- Table 200: Global APAC Insulin Infusion Industry Volume K Unit Forecast, by Geography 2019 & 2032
- Table 201: Global APAC Insulin Infusion Industry Revenue Million Forecast, by Country 2019 & 2032
- Table 202: Global APAC Insulin Infusion Industry Volume K Unit Forecast, by Country 2019 & 2032
- Table 203: Global APAC Insulin Infusion Industry Revenue Million Forecast, by Technology 2019 & 2032
- Table 204: Global APAC Insulin Infusion Industry Volume K Unit Forecast, by Technology 2019 & 2032
- Table 205: Global APAC Insulin Infusion Industry Revenue Million Forecast, by Component 2019 & 2032
- Table 206: Global APAC Insulin Infusion Industry Volume K Unit Forecast, by Component 2019 & 2032
- Table 207: Global APAC Insulin Infusion Industry Revenue Million Forecast, by End User 2019 & 2032
- Table 208: Global APAC Insulin Infusion Industry Volume K Unit Forecast, by End User 2019 & 2032
- Table 209: Global APAC Insulin Infusion Industry Revenue Million Forecast, by Geography 2019 & 2032
- Table 210: Global APAC Insulin Infusion Industry Volume K Unit Forecast, by Geography 2019 & 2032
- Table 211: Global APAC Insulin Infusion Industry Revenue Million Forecast, by Country 2019 & 2032
- Table 212: Global APAC Insulin Infusion Industry Volume K Unit Forecast, by Country 2019 & 2032
Frequently Asked Questions
1. What is the projected Compound Annual Growth Rate (CAGR) of the APAC Insulin Infusion Industry?
The projected CAGR is approximately 4.65%.
2. Which companies are prominent players in the APAC Insulin Infusion Industry?
Key companies in the market include Terumo, Roche, Ypsomed, Medtronic, Cellnovo, Animas, Tandem, Insulet, Other Company Share Analyse.
3. What are the main segments of the APAC Insulin Infusion Industry?
The market segments include Technology, Component, End User, Geography.
4. Can you provide details about the market size?
The market size is estimated to be USD 328.01 Million as of 2022.
5. What are some drivers contributing to market growth?
Increasing Applications of Cryosurgery; Technological Advancements in Cryotherapy Equipment; Rising Preference for Minimally Invasive Techniques.
6. What are the notable trends driving market growth?
Insulin Infusion Pump Devices Dominating the Asia-Pacific Insulin Infusion Pump Market.
7. Are there any restraints impacting market growth?
Hazardous Effects of Cryogenic Gases; Complexity of the Cryotherapy Mechanisms.
8. Can you provide examples of recent developments in the market?
April 2023: Medtronics has recently revealed that the MiniMed 780G system, equipped with the Guardian 4 sensor and SmartGuard technology, has received approval from the U.S. Food and Drug Administration (FDA). This significant achievement signifies the endorsement of the sole system incorporating meal detection technology that offers automatic adjustments and corrections to blood sugar levels every 5 minutes, catering to both basal (background) and bolus (mealtime) insulin requirements. Moreover, this system assists users by providing insulin to compensate for instances when they occasionally forget to administer bolus or underestimate the carbohydrate content in their meals.
9. What pricing options are available for accessing the report?
Pricing options include single-user, multi-user, and enterprise licenses priced at USD 4750, USD 5250, and USD 8750 respectively.
10. Is the market size provided in terms of value or volume?
The market size is provided in terms of value, measured in Million and volume, measured in K Unit.
11. Are there any specific market keywords associated with the report?
Yes, the market keyword associated with the report is "APAC Insulin Infusion Industry," which aids in identifying and referencing the specific market segment covered.
12. How do I determine which pricing option suits my needs best?
The pricing options vary based on user requirements and access needs. Individual users may opt for single-user licenses, while businesses requiring broader access may choose multi-user or enterprise licenses for cost-effective access to the report.
13. Are there any additional resources or data provided in the APAC Insulin Infusion Industry report?
While the report offers comprehensive insights, it's advisable to review the specific contents or supplementary materials provided to ascertain if additional resources or data are available.
14. How can I stay updated on further developments or reports in the APAC Insulin Infusion Industry?
To stay informed about further developments, trends, and reports in the APAC Insulin Infusion Industry, consider subscribing to industry newsletters, following relevant companies and organizations, or regularly checking reputable industry news sources and publications.
Methodology
Step 1 - Identification of Relevant Samples Size from Population Database


Step 2 - Approaches for Defining Global Market Size (Value, Volume* & Price*)

Note*: In applicable scenarios
Step 3 - Data Sources
Primary Research
- Web Analytics
- Survey Reports
- Research Institute
- Latest Research Reports
- Opinion Leaders
Secondary Research
- Annual Reports
- White Paper
- Latest Press Release
- Industry Association
- Paid Database
- Investor Presentations

Step 4 - Data Triangulation
Involves using different sources of information in order to increase the validity of a study
These sources are likely to be stakeholders in a program - participants, other researchers, program staff, other community members, and so on.
Then we put all data in single framework & apply various statistical tools to find out the dynamic on the market.
During the analysis stage, feedback from the stakeholder groups would be compared to determine areas of agreement as well as areas of divergence


