
Key Insights
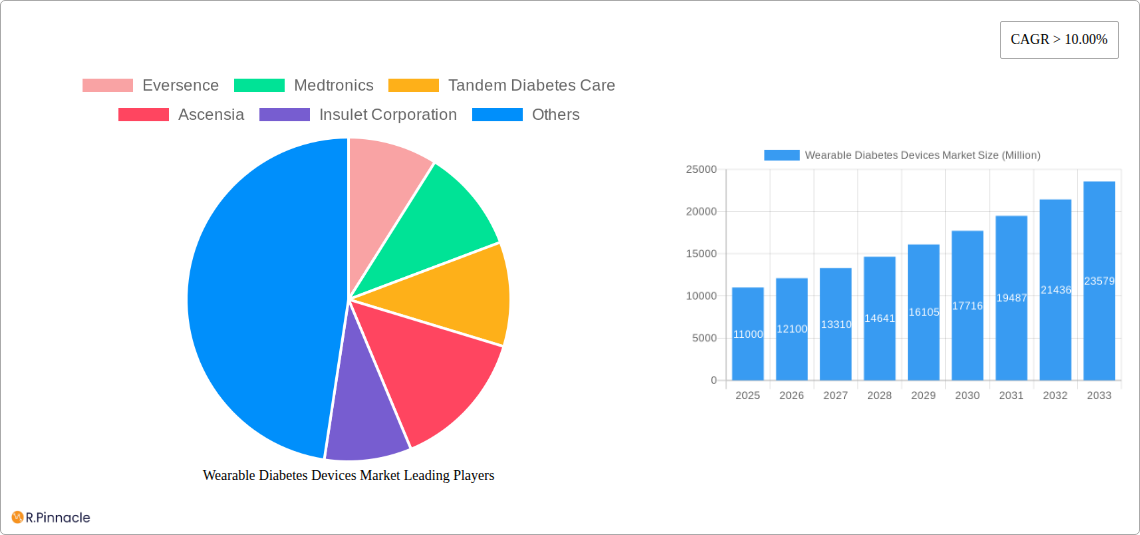
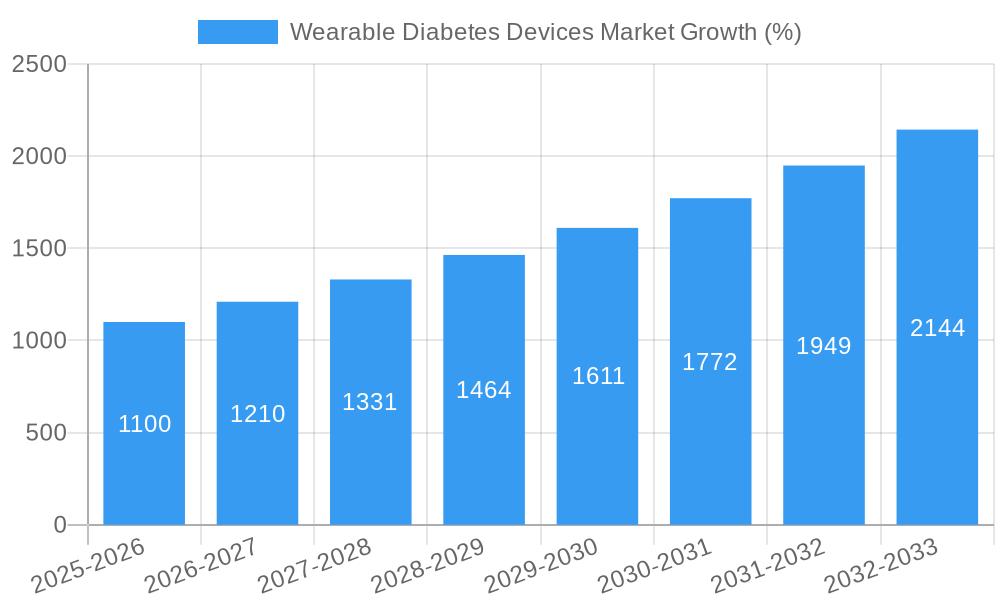
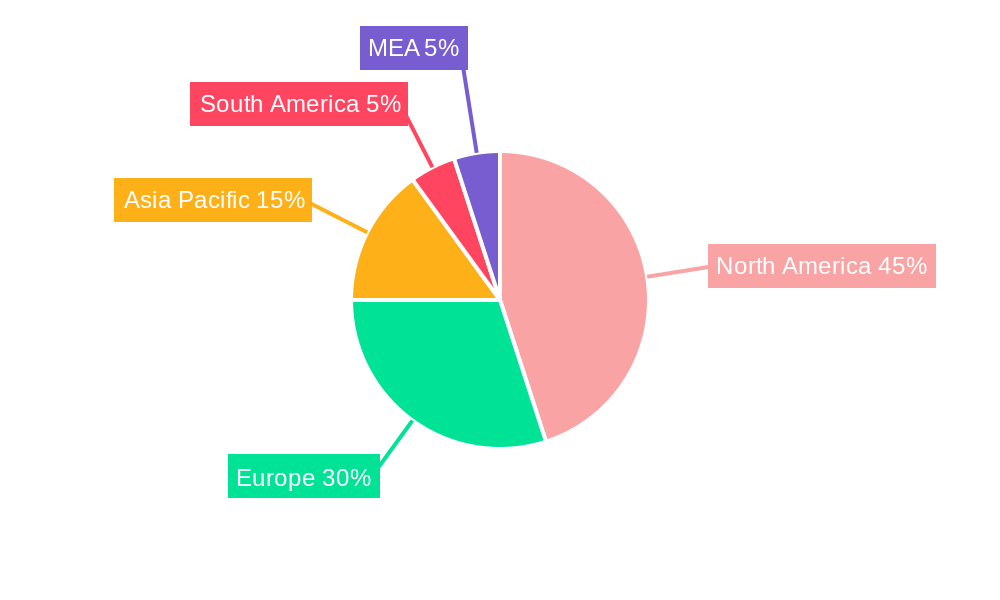
The Wearable Diabetes Devices market, valued at $11 billion in 2025, is projected for robust growth, exhibiting a Compound Annual Growth Rate (CAGR) exceeding 10% from 2025 to 2033. This expansion is fueled by several key drivers. The increasing prevalence of diabetes globally, coupled with advancements in continuous glucose monitoring (CGM) technology offering smaller, more user-friendly devices, significantly contributes to market growth. Furthermore, rising consumer awareness regarding proactive diabetes management and the associated health benefits of continuous monitoring are boosting demand. The market is segmented by device type (invasive and non-invasive glucose monitoring devices, insulin pumps), end-user (hospital/clinics, home/personal), and durable goods. Non-invasive glucose monitoring is expected to witness faster growth due to its convenience and reduced pain compared to invasive methods. The home/personal care segment is anticipated to dominate due to increased preference for self-monitoring and remote patient management. Key players like Medtronic, Dexcom, Abbott, and Insulet Corporation are driving innovation and competition, leading to continuous improvements in device accuracy, features, and affordability. Geographical expansion is another significant factor, with North America and Europe currently holding substantial market shares, while Asia Pacific is expected to witness significant growth due to rising diabetes prevalence and increasing disposable incomes. Challenges remain, such as high device costs, potential for inaccurate readings, and the need for ongoing technological advancements to overcome limitations.
The forecast period (2025-2033) anticipates consistent market expansion. Continued technological advancements, particularly in the development of non-invasive, accurate, and affordable CGM devices, will be crucial for sustained growth. The integration of smart technologies, such as smartphone connectivity and data analytics, will further enhance patient management and contribute to market expansion. Regulatory approvals and reimbursement policies will also play a significant role in influencing market access and adoption. Competition among established players and emerging companies will likely intensify, driving innovation and potentially leading to price reductions, thereby making these life-enhancing technologies more accessible to a wider patient population. Ultimately, the future of the wearable diabetes devices market hinges on continuous innovation, improved accessibility, and successful navigation of regulatory landscapes to deliver effective and user-friendly solutions for diabetes management.
Wearable Diabetes Devices Market Report: 2019-2033
This comprehensive report provides an in-depth analysis of the Wearable Diabetes Devices Market, offering invaluable insights for industry professionals, investors, and strategic decision-makers. Covering the period from 2019 to 2033, with 2025 as the base year, this report meticulously examines market dynamics, growth drivers, challenges, and emerging opportunities. The market is segmented by device type (Continuous Glucose Monitoring Devices, Non-Invasive Glucose Monitoring Devices, Invasive Glucose Monitoring Devices), end-user (Hospital/Clinics, Home/Personal), and durables (Insulin Pumps). Key players like Eversence, Medtronic, Tandem Diabetes Care, Ascensia, Insulet Corporation, Abbott, Ypsomed, and Dexcom are analyzed for their market share and strategic moves. The report projects a market value of xx Million by 2033, showcasing significant growth potential.
Wearable Diabetes Devices Market Market Structure & Innovation Trends
This section analyzes the competitive landscape, innovation drivers, and regulatory influences shaping the Wearable Diabetes Devices Market. The market exhibits a moderately concentrated structure, with key players holding significant market share. For example, Medtronic and Dexcom collectively hold an estimated xx% of the market in 2025. Innovation is driven by advancements in sensor technology, miniaturization, data analytics, and improved user interfaces. Stringent regulatory frameworks, such as FDA approvals, significantly impact market entry and product development. The market also witnesses considerable M&A activity, with deal values exceeding xx Million in the last five years. The rising prevalence of diabetes, coupled with increasing patient preference for convenient, non-invasive monitoring, fuels market growth. Substitute products, such as traditional blood glucose meters, continue to compete, albeit with declining market share. The end-user demographics are increasingly skewed towards the Home/Personal segment, reflecting the growing preference for self-monitoring and management of diabetes.
- Market Concentration: Moderately concentrated, with top players holding xx% market share (2025).
- Innovation Drivers: Advancements in sensor technology, miniaturization, data analytics, user-friendly interfaces.
- Regulatory Frameworks: Stringent FDA approvals and international standards influence market dynamics.
- Product Substitutes: Traditional blood glucose meters, facing declining market share.
- End-User Demographics: Predominantly Home/Personal use, reflecting self-management trends.
- M&A Activity: Significant activity with deal values exceeding xx Million in the last five years.
Wearable Diabetes Devices Market Market Dynamics & Trends
The Wearable Diabetes Devices Market is experiencing robust growth, driven by several factors. The rising prevalence of diabetes globally is a primary driver, with a projected xx% increase in the diabetic population by 2033. Technological advancements, such as the development of more accurate and user-friendly CGM systems, contribute significantly. Consumer preferences are shifting towards continuous monitoring, enhanced data analytics, and seamless integration with smartphones and other devices. The market is witnessing a high rate of technological disruption, with companies continuously innovating to improve accuracy, reduce invasiveness, and enhance data interpretation. Competitive dynamics are characterized by intense innovation, strategic partnerships, and product diversification. The market is estimated to exhibit a CAGR of xx% during the forecast period (2025-2033), with a significant market penetration expected in developing economies.
Dominant Regions & Segments in Wearable Diabetes Devices Market
North America currently dominates the Wearable Diabetes Devices Market, driven by high diabetes prevalence, advanced healthcare infrastructure, and strong regulatory support. However, Asia-Pacific is poised for rapid growth due to rising diabetes incidence and increasing healthcare expenditure.
- Leading Region: North America.
- Key Drivers in North America: High diabetes prevalence, advanced healthcare infrastructure, strong regulatory support, high disposable income.
- Growth Potential in Asia-Pacific: Rapidly rising diabetes incidence, increasing healthcare expenditure, expanding adoption of advanced technologies.
Dominant Segments:
- Durables: Insulin Pumps: This segment benefits from technological improvements enhancing ease of use and accuracy.
- Type: Continuous Glucose Monitoring Devices (CGM): CGM systems are witnessing the highest growth due to their real-time monitoring capabilities and convenience.
- End User: Home/Personal: The home-use segment exhibits the highest market share due to increasing patient preference for self-management.
Wearable Diabetes Devices Market Product Innovations
Recent product developments highlight a clear trend towards miniaturization, improved accuracy, and seamless integration with mobile applications. The launch of the Eversense E3 CGM system and the FDA approval of the Beta Bionics iLet Bionic Pancreas represent significant advancements, enhancing the ease of use, accuracy, and effectiveness of diabetes management. These innovations cater to the growing demand for convenient and effective self-monitoring solutions, leading to increased market penetration and higher patient satisfaction.
Report Scope & Segmentation Analysis
This report comprehensively analyzes the Wearable Diabetes Devices Market based on device type (Continuous Glucose Monitoring Devices, Non-Invasive Glucose Monitoring Devices, Invasive Glucose Monitoring Devices), end-user (Hospital/Clinics, Home/Personal), and durables (Insulin Pumps). Each segment is analyzed for its growth potential, market size, and competitive dynamics. Growth projections vary across segments, with CGM devices expected to witness the highest growth rate due to their accuracy and convenience.
Key Drivers of Wearable Diabetes Devices Market Growth
Several factors drive the growth of the Wearable Diabetes Devices Market. The rising prevalence of diabetes is the primary driver, exacerbated by increasingly sedentary lifestyles and unhealthy diets. Technological advancements, such as improved sensor technology and miniaturization, lead to more accurate, user-friendly devices. Government initiatives and regulatory support promote the adoption of advanced monitoring technologies. Increasing healthcare expenditure, particularly in developing economies, further fuels market expansion.
Challenges in the Wearable Diabetes Devices Market Sector
The Wearable Diabetes Devices Market faces several challenges. High device costs and limited insurance coverage restrict market accessibility in certain regions. Supply chain disruptions can affect production and availability. Stringent regulatory approvals increase the time and cost associated with product launches. Intense competition among established players and emerging companies puts pressure on pricing and profitability. The accuracy and reliability of certain devices remain areas of concern for both patients and healthcare providers. These challenges collectively impact market growth and penetration.
Emerging Opportunities in Wearable Diabetes Devices Market
Several emerging opportunities exist within the Wearable Diabetes Devices Market. The integration of AI and machine learning in data analysis holds significant potential for improved diagnostic capabilities and personalized treatment plans. Expansion into emerging markets with high diabetes prevalence presents significant growth opportunities. Development of advanced features, such as automated insulin delivery systems, enhances device functionality and patient convenience. The increasing adoption of remote patient monitoring (RPM) creates new avenues for telehealth applications and improved patient outcomes.
Leading Players in the Wearable Diabetes Devices Market Market
- Eversence
- Medtronic
- Tandem Diabetes Care
- Ascensia
- Insulet Corporation
- Abbott
- Ypsomed
- Dexcom
Key Developments in Wearable Diabetes Devices Market Industry
- May 2023: The Beta Bionics iLet ACE Pump and iLet Dosing Decision Software received FDA clearance for type 1 diabetes patients aged six and above, creating the iLet Bionic Pancreas automated insulin dosing system.
- March 2023: The FDA approved the Eversense E3 Continuous Glucose Monitoring (CGM) System, offering real-time blood sugar monitoring via a mobile app.
These developments reflect a trend towards automated insulin delivery and enhanced continuous glucose monitoring, significantly impacting market dynamics by driving innovation and expanding treatment options.
Future Outlook for Wearable Diabetes Devices Market Market
The Wearable Diabetes Devices Market is poised for significant growth, fueled by technological advancements, increasing diabetes prevalence, and rising demand for convenient self-management solutions. The integration of artificial intelligence, expansion into new markets, and strategic partnerships will drive future market expansion. Continued innovation in sensor technology, data analytics, and user interface design will further enhance the accuracy, reliability, and affordability of these devices, making them accessible to a broader patient population and significantly impacting the future of diabetes care.
Wearable Diabetes Devices Market Segmentation
-
1. Device
-
1.1. Continuous Glucose Monitoring Devices
- 1.1.1. Sensors
- 1.1.2. Durables
-
1.2. Insulin Pumps
- 1.2.1. Insulin Pump Devices
- 1.2.2. Insulin Infusion Sets
- 1.2.3. Reservoirs
-
1.1. Continuous Glucose Monitoring Devices
-
2. Type
- 2.1. Non-Invasive Glucose Monitoring Devices
-
3. End User
- 3.1. Hospital/Clinics
- 3.2. Home/Personal
Wearable Diabetes Devices Market Segmentation By Geography
-
1. North America
- 1.1. United States
- 1.2. Canada
- 1.3. Rest of North America
-
2. Europe
- 2.1. France
- 2.2. Germany
- 2.3. Italy
- 2.4. Spain
- 2.5. United Kingdom
- 2.6. Russia
- 2.7. Rest of Europe
-
3. Latin America
- 3.1. Mexico
- 3.2. Brazil
- 3.3. Rest of Latin America
-
4. Asia Pacific
- 4.1. Japan
- 4.2. South Korea
- 4.3. China
- 4.4. India
- 4.5. Australia
- 4.6. Vietnam
- 4.7. Malaysia
- 4.8. Indonesia
- 4.9. Thailand
- 4.10. Rest of Asia Pacific
-
5. Middle East and Africa
- 5.1. Saudi Arabia
- 5.2. Iran
- 5.3. Egypt
- 5.4. Oman
- 5.5. South Africa
- 5.6. Rest of Middle East and Africa
Wearable Diabetes Devices Market REPORT HIGHLIGHTS
| Aspects | Details |
|---|---|
| Study Period | 2019-2033 |
| Base Year | 2024 |
| Estimated Year | 2025 |
| Forecast Period | 2025-2033 |
| Historical Period | 2019-2024 |
| Growth Rate | CAGR of > 10.00% from 2019-2033 |
| Segmentation |
|
Table of Contents
- 1. Introduction
- 1.1. Research Scope
- 1.2. Market Segmentation
- 1.3. Research Methodology
- 1.4. Definitions and Assumptions
- 2. Executive Summary
- 2.1. Introduction
- 3. Market Dynamics
- 3.1. Introduction
- 3.2. Market Drivers
- 3.2.1. Rapidly Increasing Incidence and Prevalence of Diabetes; Technological Advancements in the Market
- 3.3. Market Restrains
- 3.3.1. Monopolized Supply Chain and High Cost of Devices
- 3.4. Market Trends
- 3.4.1. Rising diabetes prevalence globally is driving the market in forecast years
- 4. Market Factor Analysis
- 4.1. Porters Five Forces
- 4.2. Supply/Value Chain
- 4.3. PESTEL analysis
- 4.4. Market Entropy
- 4.5. Patent/Trademark Analysis
- 5. Global Wearable Diabetes Devices Market Analysis, Insights and Forecast, 2019-2031
- 5.1. Market Analysis, Insights and Forecast - by Device
- 5.1.1. Continuous Glucose Monitoring Devices
- 5.1.1.1. Sensors
- 5.1.1.2. Durables
- 5.1.2. Insulin Pumps
- 5.1.2.1. Insulin Pump Devices
- 5.1.2.2. Insulin Infusion Sets
- 5.1.2.3. Reservoirs
- 5.1.1. Continuous Glucose Monitoring Devices
- 5.2. Market Analysis, Insights and Forecast - by Type
- 5.2.1. Non-Invasive Glucose Monitoring Devices
- 5.3. Market Analysis, Insights and Forecast - by End User
- 5.3.1. Hospital/Clinics
- 5.3.2. Home/Personal
- 5.4. Market Analysis, Insights and Forecast - by Region
- 5.4.1. North America
- 5.4.2. Europe
- 5.4.3. Latin America
- 5.4.4. Asia Pacific
- 5.4.5. Middle East and Africa
- 5.1. Market Analysis, Insights and Forecast - by Device
- 6. North America Wearable Diabetes Devices Market Analysis, Insights and Forecast, 2019-2031
- 6.1. Market Analysis, Insights and Forecast - by Device
- 6.1.1. Continuous Glucose Monitoring Devices
- 6.1.1.1. Sensors
- 6.1.1.2. Durables
- 6.1.2. Insulin Pumps
- 6.1.2.1. Insulin Pump Devices
- 6.1.2.2. Insulin Infusion Sets
- 6.1.2.3. Reservoirs
- 6.1.1. Continuous Glucose Monitoring Devices
- 6.2. Market Analysis, Insights and Forecast - by Type
- 6.2.1. Non-Invasive Glucose Monitoring Devices
- 6.3. Market Analysis, Insights and Forecast - by End User
- 6.3.1. Hospital/Clinics
- 6.3.2. Home/Personal
- 6.1. Market Analysis, Insights and Forecast - by Device
- 7. Europe Wearable Diabetes Devices Market Analysis, Insights and Forecast, 2019-2031
- 7.1. Market Analysis, Insights and Forecast - by Device
- 7.1.1. Continuous Glucose Monitoring Devices
- 7.1.1.1. Sensors
- 7.1.1.2. Durables
- 7.1.2. Insulin Pumps
- 7.1.2.1. Insulin Pump Devices
- 7.1.2.2. Insulin Infusion Sets
- 7.1.2.3. Reservoirs
- 7.1.1. Continuous Glucose Monitoring Devices
- 7.2. Market Analysis, Insights and Forecast - by Type
- 7.2.1. Non-Invasive Glucose Monitoring Devices
- 7.3. Market Analysis, Insights and Forecast - by End User
- 7.3.1. Hospital/Clinics
- 7.3.2. Home/Personal
- 7.1. Market Analysis, Insights and Forecast - by Device
- 8. Latin America Wearable Diabetes Devices Market Analysis, Insights and Forecast, 2019-2031
- 8.1. Market Analysis, Insights and Forecast - by Device
- 8.1.1. Continuous Glucose Monitoring Devices
- 8.1.1.1. Sensors
- 8.1.1.2. Durables
- 8.1.2. Insulin Pumps
- 8.1.2.1. Insulin Pump Devices
- 8.1.2.2. Insulin Infusion Sets
- 8.1.2.3. Reservoirs
- 8.1.1. Continuous Glucose Monitoring Devices
- 8.2. Market Analysis, Insights and Forecast - by Type
- 8.2.1. Non-Invasive Glucose Monitoring Devices
- 8.3. Market Analysis, Insights and Forecast - by End User
- 8.3.1. Hospital/Clinics
- 8.3.2. Home/Personal
- 8.1. Market Analysis, Insights and Forecast - by Device
- 9. Asia Pacific Wearable Diabetes Devices Market Analysis, Insights and Forecast, 2019-2031
- 9.1. Market Analysis, Insights and Forecast - by Device
- 9.1.1. Continuous Glucose Monitoring Devices
- 9.1.1.1. Sensors
- 9.1.1.2. Durables
- 9.1.2. Insulin Pumps
- 9.1.2.1. Insulin Pump Devices
- 9.1.2.2. Insulin Infusion Sets
- 9.1.2.3. Reservoirs
- 9.1.1. Continuous Glucose Monitoring Devices
- 9.2. Market Analysis, Insights and Forecast - by Type
- 9.2.1. Non-Invasive Glucose Monitoring Devices
- 9.3. Market Analysis, Insights and Forecast - by End User
- 9.3.1. Hospital/Clinics
- 9.3.2. Home/Personal
- 9.1. Market Analysis, Insights and Forecast - by Device
- 10. Middle East and Africa Wearable Diabetes Devices Market Analysis, Insights and Forecast, 2019-2031
- 10.1. Market Analysis, Insights and Forecast - by Device
- 10.1.1. Continuous Glucose Monitoring Devices
- 10.1.1.1. Sensors
- 10.1.1.2. Durables
- 10.1.2. Insulin Pumps
- 10.1.2.1. Insulin Pump Devices
- 10.1.2.2. Insulin Infusion Sets
- 10.1.2.3. Reservoirs
- 10.1.1. Continuous Glucose Monitoring Devices
- 10.2. Market Analysis, Insights and Forecast - by Type
- 10.2.1. Non-Invasive Glucose Monitoring Devices
- 10.3. Market Analysis, Insights and Forecast - by End User
- 10.3.1. Hospital/Clinics
- 10.3.2. Home/Personal
- 10.1. Market Analysis, Insights and Forecast - by Device
- 11. North America Wearable Diabetes Devices Market Analysis, Insights and Forecast, 2019-2031
- 11.1. Market Analysis, Insights and Forecast - By Country/Sub-region
- 11.1.1 United States
- 11.1.2 Canada
- 11.1.3 Mexico
- 12. Europe Wearable Diabetes Devices Market Analysis, Insights and Forecast, 2019-2031
- 12.1. Market Analysis, Insights and Forecast - By Country/Sub-region
- 12.1.1 Germany
- 12.1.2 United Kingdom
- 12.1.3 France
- 12.1.4 Spain
- 12.1.5 Italy
- 12.1.6 Spain
- 12.1.7 Belgium
- 12.1.8 Netherland
- 12.1.9 Nordics
- 12.1.10 Rest of Europe
- 13. Asia Pacific Wearable Diabetes Devices Market Analysis, Insights and Forecast, 2019-2031
- 13.1. Market Analysis, Insights and Forecast - By Country/Sub-region
- 13.1.1 China
- 13.1.2 Japan
- 13.1.3 India
- 13.1.4 South Korea
- 13.1.5 Southeast Asia
- 13.1.6 Australia
- 13.1.7 Indonesia
- 13.1.8 Phillipes
- 13.1.9 Singapore
- 13.1.10 Thailandc
- 13.1.11 Rest of Asia Pacific
- 14. South America Wearable Diabetes Devices Market Analysis, Insights and Forecast, 2019-2031
- 14.1. Market Analysis, Insights and Forecast - By Country/Sub-region
- 14.1.1 Brazil
- 14.1.2 Argentina
- 14.1.3 Peru
- 14.1.4 Chile
- 14.1.5 Colombia
- 14.1.6 Ecuador
- 14.1.7 Venezuela
- 14.1.8 Rest of South America
- 15. MEA Wearable Diabetes Devices Market Analysis, Insights and Forecast, 2019-2031
- 15.1. Market Analysis, Insights and Forecast - By Country/Sub-region
- 15.1.1 United Arab Emirates
- 15.1.2 Saudi Arabia
- 15.1.3 South Africa
- 15.1.4 Rest of Middle East and Africa
- 16. Competitive Analysis
- 16.1. Global Market Share Analysis 2024
- 16.2. Company Profiles
- 16.2.1 Eversence
- 16.2.1.1. Overview
- 16.2.1.2. Products
- 16.2.1.3. SWOT Analysis
- 16.2.1.4. Recent Developments
- 16.2.1.5. Financials (Based on Availability)
- 16.2.2 Medtronics
- 16.2.2.1. Overview
- 16.2.2.2. Products
- 16.2.2.3. SWOT Analysis
- 16.2.2.4. Recent Developments
- 16.2.2.5. Financials (Based on Availability)
- 16.2.3 Tandem Diabetes Care
- 16.2.3.1. Overview
- 16.2.3.2. Products
- 16.2.3.3. SWOT Analysis
- 16.2.3.4. Recent Developments
- 16.2.3.5. Financials (Based on Availability)
- 16.2.4 Ascensia
- 16.2.4.1. Overview
- 16.2.4.2. Products
- 16.2.4.3. SWOT Analysis
- 16.2.4.4. Recent Developments
- 16.2.4.5. Financials (Based on Availability)
- 16.2.5 Insulet Corporation
- 16.2.5.1. Overview
- 16.2.5.2. Products
- 16.2.5.3. SWOT Analysis
- 16.2.5.4. Recent Developments
- 16.2.5.5. Financials (Based on Availability)
- 16.2.6 Abbott
- 16.2.6.1. Overview
- 16.2.6.2. Products
- 16.2.6.3. SWOT Analysis
- 16.2.6.4. Recent Developments
- 16.2.6.5. Financials (Based on Availability)
- 16.2.7 Ypsomped
- 16.2.7.1. Overview
- 16.2.7.2. Products
- 16.2.7.3. SWOT Analysis
- 16.2.7.4. Recent Developments
- 16.2.7.5. Financials (Based on Availability)
- 16.2.8 Dexcom
- 16.2.8.1. Overview
- 16.2.8.2. Products
- 16.2.8.3. SWOT Analysis
- 16.2.8.4. Recent Developments
- 16.2.8.5. Financials (Based on Availability)
- 16.2.1 Eversence
List of Figures
- Figure 1: Global Wearable Diabetes Devices Market Revenue Breakdown (Million, %) by Region 2024 & 2032
- Figure 2: Global Wearable Diabetes Devices Market Volume Breakdown (K Unit, %) by Region 2024 & 2032
- Figure 3: North America Wearable Diabetes Devices Market Revenue (Million), by Country 2024 & 2032
- Figure 4: North America Wearable Diabetes Devices Market Volume (K Unit), by Country 2024 & 2032
- Figure 5: North America Wearable Diabetes Devices Market Revenue Share (%), by Country 2024 & 2032
- Figure 6: North America Wearable Diabetes Devices Market Volume Share (%), by Country 2024 & 2032
- Figure 7: Europe Wearable Diabetes Devices Market Revenue (Million), by Country 2024 & 2032
- Figure 8: Europe Wearable Diabetes Devices Market Volume (K Unit), by Country 2024 & 2032
- Figure 9: Europe Wearable Diabetes Devices Market Revenue Share (%), by Country 2024 & 2032
- Figure 10: Europe Wearable Diabetes Devices Market Volume Share (%), by Country 2024 & 2032
- Figure 11: Asia Pacific Wearable Diabetes Devices Market Revenue (Million), by Country 2024 & 2032
- Figure 12: Asia Pacific Wearable Diabetes Devices Market Volume (K Unit), by Country 2024 & 2032
- Figure 13: Asia Pacific Wearable Diabetes Devices Market Revenue Share (%), by Country 2024 & 2032
- Figure 14: Asia Pacific Wearable Diabetes Devices Market Volume Share (%), by Country 2024 & 2032
- Figure 15: South America Wearable Diabetes Devices Market Revenue (Million), by Country 2024 & 2032
- Figure 16: South America Wearable Diabetes Devices Market Volume (K Unit), by Country 2024 & 2032
- Figure 17: South America Wearable Diabetes Devices Market Revenue Share (%), by Country 2024 & 2032
- Figure 18: South America Wearable Diabetes Devices Market Volume Share (%), by Country 2024 & 2032
- Figure 19: MEA Wearable Diabetes Devices Market Revenue (Million), by Country 2024 & 2032
- Figure 20: MEA Wearable Diabetes Devices Market Volume (K Unit), by Country 2024 & 2032
- Figure 21: MEA Wearable Diabetes Devices Market Revenue Share (%), by Country 2024 & 2032
- Figure 22: MEA Wearable Diabetes Devices Market Volume Share (%), by Country 2024 & 2032
- Figure 23: North America Wearable Diabetes Devices Market Revenue (Million), by Device 2024 & 2032
- Figure 24: North America Wearable Diabetes Devices Market Volume (K Unit), by Device 2024 & 2032
- Figure 25: North America Wearable Diabetes Devices Market Revenue Share (%), by Device 2024 & 2032
- Figure 26: North America Wearable Diabetes Devices Market Volume Share (%), by Device 2024 & 2032
- Figure 27: North America Wearable Diabetes Devices Market Revenue (Million), by Type 2024 & 2032
- Figure 28: North America Wearable Diabetes Devices Market Volume (K Unit), by Type 2024 & 2032
- Figure 29: North America Wearable Diabetes Devices Market Revenue Share (%), by Type 2024 & 2032
- Figure 30: North America Wearable Diabetes Devices Market Volume Share (%), by Type 2024 & 2032
- Figure 31: North America Wearable Diabetes Devices Market Revenue (Million), by End User 2024 & 2032
- Figure 32: North America Wearable Diabetes Devices Market Volume (K Unit), by End User 2024 & 2032
- Figure 33: North America Wearable Diabetes Devices Market Revenue Share (%), by End User 2024 & 2032
- Figure 34: North America Wearable Diabetes Devices Market Volume Share (%), by End User 2024 & 2032
- Figure 35: North America Wearable Diabetes Devices Market Revenue (Million), by Country 2024 & 2032
- Figure 36: North America Wearable Diabetes Devices Market Volume (K Unit), by Country 2024 & 2032
- Figure 37: North America Wearable Diabetes Devices Market Revenue Share (%), by Country 2024 & 2032
- Figure 38: North America Wearable Diabetes Devices Market Volume Share (%), by Country 2024 & 2032
- Figure 39: Europe Wearable Diabetes Devices Market Revenue (Million), by Device 2024 & 2032
- Figure 40: Europe Wearable Diabetes Devices Market Volume (K Unit), by Device 2024 & 2032
- Figure 41: Europe Wearable Diabetes Devices Market Revenue Share (%), by Device 2024 & 2032
- Figure 42: Europe Wearable Diabetes Devices Market Volume Share (%), by Device 2024 & 2032
- Figure 43: Europe Wearable Diabetes Devices Market Revenue (Million), by Type 2024 & 2032
- Figure 44: Europe Wearable Diabetes Devices Market Volume (K Unit), by Type 2024 & 2032
- Figure 45: Europe Wearable Diabetes Devices Market Revenue Share (%), by Type 2024 & 2032
- Figure 46: Europe Wearable Diabetes Devices Market Volume Share (%), by Type 2024 & 2032
- Figure 47: Europe Wearable Diabetes Devices Market Revenue (Million), by End User 2024 & 2032
- Figure 48: Europe Wearable Diabetes Devices Market Volume (K Unit), by End User 2024 & 2032
- Figure 49: Europe Wearable Diabetes Devices Market Revenue Share (%), by End User 2024 & 2032
- Figure 50: Europe Wearable Diabetes Devices Market Volume Share (%), by End User 2024 & 2032
- Figure 51: Europe Wearable Diabetes Devices Market Revenue (Million), by Country 2024 & 2032
- Figure 52: Europe Wearable Diabetes Devices Market Volume (K Unit), by Country 2024 & 2032
- Figure 53: Europe Wearable Diabetes Devices Market Revenue Share (%), by Country 2024 & 2032
- Figure 54: Europe Wearable Diabetes Devices Market Volume Share (%), by Country 2024 & 2032
- Figure 55: Latin America Wearable Diabetes Devices Market Revenue (Million), by Device 2024 & 2032
- Figure 56: Latin America Wearable Diabetes Devices Market Volume (K Unit), by Device 2024 & 2032
- Figure 57: Latin America Wearable Diabetes Devices Market Revenue Share (%), by Device 2024 & 2032
- Figure 58: Latin America Wearable Diabetes Devices Market Volume Share (%), by Device 2024 & 2032
- Figure 59: Latin America Wearable Diabetes Devices Market Revenue (Million), by Type 2024 & 2032
- Figure 60: Latin America Wearable Diabetes Devices Market Volume (K Unit), by Type 2024 & 2032
- Figure 61: Latin America Wearable Diabetes Devices Market Revenue Share (%), by Type 2024 & 2032
- Figure 62: Latin America Wearable Diabetes Devices Market Volume Share (%), by Type 2024 & 2032
- Figure 63: Latin America Wearable Diabetes Devices Market Revenue (Million), by End User 2024 & 2032
- Figure 64: Latin America Wearable Diabetes Devices Market Volume (K Unit), by End User 2024 & 2032
- Figure 65: Latin America Wearable Diabetes Devices Market Revenue Share (%), by End User 2024 & 2032
- Figure 66: Latin America Wearable Diabetes Devices Market Volume Share (%), by End User 2024 & 2032
- Figure 67: Latin America Wearable Diabetes Devices Market Revenue (Million), by Country 2024 & 2032
- Figure 68: Latin America Wearable Diabetes Devices Market Volume (K Unit), by Country 2024 & 2032
- Figure 69: Latin America Wearable Diabetes Devices Market Revenue Share (%), by Country 2024 & 2032
- Figure 70: Latin America Wearable Diabetes Devices Market Volume Share (%), by Country 2024 & 2032
- Figure 71: Asia Pacific Wearable Diabetes Devices Market Revenue (Million), by Device 2024 & 2032
- Figure 72: Asia Pacific Wearable Diabetes Devices Market Volume (K Unit), by Device 2024 & 2032
- Figure 73: Asia Pacific Wearable Diabetes Devices Market Revenue Share (%), by Device 2024 & 2032
- Figure 74: Asia Pacific Wearable Diabetes Devices Market Volume Share (%), by Device 2024 & 2032
- Figure 75: Asia Pacific Wearable Diabetes Devices Market Revenue (Million), by Type 2024 & 2032
- Figure 76: Asia Pacific Wearable Diabetes Devices Market Volume (K Unit), by Type 2024 & 2032
- Figure 77: Asia Pacific Wearable Diabetes Devices Market Revenue Share (%), by Type 2024 & 2032
- Figure 78: Asia Pacific Wearable Diabetes Devices Market Volume Share (%), by Type 2024 & 2032
- Figure 79: Asia Pacific Wearable Diabetes Devices Market Revenue (Million), by End User 2024 & 2032
- Figure 80: Asia Pacific Wearable Diabetes Devices Market Volume (K Unit), by End User 2024 & 2032
- Figure 81: Asia Pacific Wearable Diabetes Devices Market Revenue Share (%), by End User 2024 & 2032
- Figure 82: Asia Pacific Wearable Diabetes Devices Market Volume Share (%), by End User 2024 & 2032
- Figure 83: Asia Pacific Wearable Diabetes Devices Market Revenue (Million), by Country 2024 & 2032
- Figure 84: Asia Pacific Wearable Diabetes Devices Market Volume (K Unit), by Country 2024 & 2032
- Figure 85: Asia Pacific Wearable Diabetes Devices Market Revenue Share (%), by Country 2024 & 2032
- Figure 86: Asia Pacific Wearable Diabetes Devices Market Volume Share (%), by Country 2024 & 2032
- Figure 87: Middle East and Africa Wearable Diabetes Devices Market Revenue (Million), by Device 2024 & 2032
- Figure 88: Middle East and Africa Wearable Diabetes Devices Market Volume (K Unit), by Device 2024 & 2032
- Figure 89: Middle East and Africa Wearable Diabetes Devices Market Revenue Share (%), by Device 2024 & 2032
- Figure 90: Middle East and Africa Wearable Diabetes Devices Market Volume Share (%), by Device 2024 & 2032
- Figure 91: Middle East and Africa Wearable Diabetes Devices Market Revenue (Million), by Type 2024 & 2032
- Figure 92: Middle East and Africa Wearable Diabetes Devices Market Volume (K Unit), by Type 2024 & 2032
- Figure 93: Middle East and Africa Wearable Diabetes Devices Market Revenue Share (%), by Type 2024 & 2032
- Figure 94: Middle East and Africa Wearable Diabetes Devices Market Volume Share (%), by Type 2024 & 2032
- Figure 95: Middle East and Africa Wearable Diabetes Devices Market Revenue (Million), by End User 2024 & 2032
- Figure 96: Middle East and Africa Wearable Diabetes Devices Market Volume (K Unit), by End User 2024 & 2032
- Figure 97: Middle East and Africa Wearable Diabetes Devices Market Revenue Share (%), by End User 2024 & 2032
- Figure 98: Middle East and Africa Wearable Diabetes Devices Market Volume Share (%), by End User 2024 & 2032
- Figure 99: Middle East and Africa Wearable Diabetes Devices Market Revenue (Million), by Country 2024 & 2032
- Figure 100: Middle East and Africa Wearable Diabetes Devices Market Volume (K Unit), by Country 2024 & 2032
- Figure 101: Middle East and Africa Wearable Diabetes Devices Market Revenue Share (%), by Country 2024 & 2032
- Figure 102: Middle East and Africa Wearable Diabetes Devices Market Volume Share (%), by Country 2024 & 2032
List of Tables
- Table 1: Global Wearable Diabetes Devices Market Revenue Million Forecast, by Region 2019 & 2032
- Table 2: Global Wearable Diabetes Devices Market Volume K Unit Forecast, by Region 2019 & 2032
- Table 3: Global Wearable Diabetes Devices Market Revenue Million Forecast, by Device 2019 & 2032
- Table 4: Global Wearable Diabetes Devices Market Volume K Unit Forecast, by Device 2019 & 2032
- Table 5: Global Wearable Diabetes Devices Market Revenue Million Forecast, by Type 2019 & 2032
- Table 6: Global Wearable Diabetes Devices Market Volume K Unit Forecast, by Type 2019 & 2032
- Table 7: Global Wearable Diabetes Devices Market Revenue Million Forecast, by End User 2019 & 2032
- Table 8: Global Wearable Diabetes Devices Market Volume K Unit Forecast, by End User 2019 & 2032
- Table 9: Global Wearable Diabetes Devices Market Revenue Million Forecast, by Region 2019 & 2032
- Table 10: Global Wearable Diabetes Devices Market Volume K Unit Forecast, by Region 2019 & 2032
- Table 11: Global Wearable Diabetes Devices Market Revenue Million Forecast, by Country 2019 & 2032
- Table 12: Global Wearable Diabetes Devices Market Volume K Unit Forecast, by Country 2019 & 2032
- Table 13: United States Wearable Diabetes Devices Market Revenue (Million) Forecast, by Application 2019 & 2032
- Table 14: United States Wearable Diabetes Devices Market Volume (K Unit) Forecast, by Application 2019 & 2032
- Table 15: Canada Wearable Diabetes Devices Market Revenue (Million) Forecast, by Application 2019 & 2032
- Table 16: Canada Wearable Diabetes Devices Market Volume (K Unit) Forecast, by Application 2019 & 2032
- Table 17: Mexico Wearable Diabetes Devices Market Revenue (Million) Forecast, by Application 2019 & 2032
- Table 18: Mexico Wearable Diabetes Devices Market Volume (K Unit) Forecast, by Application 2019 & 2032
- Table 19: Global Wearable Diabetes Devices Market Revenue Million Forecast, by Country 2019 & 2032
- Table 20: Global Wearable Diabetes Devices Market Volume K Unit Forecast, by Country 2019 & 2032
- Table 21: Germany Wearable Diabetes Devices Market Revenue (Million) Forecast, by Application 2019 & 2032
- Table 22: Germany Wearable Diabetes Devices Market Volume (K Unit) Forecast, by Application 2019 & 2032
- Table 23: United Kingdom Wearable Diabetes Devices Market Revenue (Million) Forecast, by Application 2019 & 2032
- Table 24: United Kingdom Wearable Diabetes Devices Market Volume (K Unit) Forecast, by Application 2019 & 2032
- Table 25: France Wearable Diabetes Devices Market Revenue (Million) Forecast, by Application 2019 & 2032
- Table 26: France Wearable Diabetes Devices Market Volume (K Unit) Forecast, by Application 2019 & 2032
- Table 27: Spain Wearable Diabetes Devices Market Revenue (Million) Forecast, by Application 2019 & 2032
- Table 28: Spain Wearable Diabetes Devices Market Volume (K Unit) Forecast, by Application 2019 & 2032
- Table 29: Italy Wearable Diabetes Devices Market Revenue (Million) Forecast, by Application 2019 & 2032
- Table 30: Italy Wearable Diabetes Devices Market Volume (K Unit) Forecast, by Application 2019 & 2032
- Table 31: Spain Wearable Diabetes Devices Market Revenue (Million) Forecast, by Application 2019 & 2032
- Table 32: Spain Wearable Diabetes Devices Market Volume (K Unit) Forecast, by Application 2019 & 2032
- Table 33: Belgium Wearable Diabetes Devices Market Revenue (Million) Forecast, by Application 2019 & 2032
- Table 34: Belgium Wearable Diabetes Devices Market Volume (K Unit) Forecast, by Application 2019 & 2032
- Table 35: Netherland Wearable Diabetes Devices Market Revenue (Million) Forecast, by Application 2019 & 2032
- Table 36: Netherland Wearable Diabetes Devices Market Volume (K Unit) Forecast, by Application 2019 & 2032
- Table 37: Nordics Wearable Diabetes Devices Market Revenue (Million) Forecast, by Application 2019 & 2032
- Table 38: Nordics Wearable Diabetes Devices Market Volume (K Unit) Forecast, by Application 2019 & 2032
- Table 39: Rest of Europe Wearable Diabetes Devices Market Revenue (Million) Forecast, by Application 2019 & 2032
- Table 40: Rest of Europe Wearable Diabetes Devices Market Volume (K Unit) Forecast, by Application 2019 & 2032
- Table 41: Global Wearable Diabetes Devices Market Revenue Million Forecast, by Country 2019 & 2032
- Table 42: Global Wearable Diabetes Devices Market Volume K Unit Forecast, by Country 2019 & 2032
- Table 43: China Wearable Diabetes Devices Market Revenue (Million) Forecast, by Application 2019 & 2032
- Table 44: China Wearable Diabetes Devices Market Volume (K Unit) Forecast, by Application 2019 & 2032
- Table 45: Japan Wearable Diabetes Devices Market Revenue (Million) Forecast, by Application 2019 & 2032
- Table 46: Japan Wearable Diabetes Devices Market Volume (K Unit) Forecast, by Application 2019 & 2032
- Table 47: India Wearable Diabetes Devices Market Revenue (Million) Forecast, by Application 2019 & 2032
- Table 48: India Wearable Diabetes Devices Market Volume (K Unit) Forecast, by Application 2019 & 2032
- Table 49: South Korea Wearable Diabetes Devices Market Revenue (Million) Forecast, by Application 2019 & 2032
- Table 50: South Korea Wearable Diabetes Devices Market Volume (K Unit) Forecast, by Application 2019 & 2032
- Table 51: Southeast Asia Wearable Diabetes Devices Market Revenue (Million) Forecast, by Application 2019 & 2032
- Table 52: Southeast Asia Wearable Diabetes Devices Market Volume (K Unit) Forecast, by Application 2019 & 2032
- Table 53: Australia Wearable Diabetes Devices Market Revenue (Million) Forecast, by Application 2019 & 2032
- Table 54: Australia Wearable Diabetes Devices Market Volume (K Unit) Forecast, by Application 2019 & 2032
- Table 55: Indonesia Wearable Diabetes Devices Market Revenue (Million) Forecast, by Application 2019 & 2032
- Table 56: Indonesia Wearable Diabetes Devices Market Volume (K Unit) Forecast, by Application 2019 & 2032
- Table 57: Phillipes Wearable Diabetes Devices Market Revenue (Million) Forecast, by Application 2019 & 2032
- Table 58: Phillipes Wearable Diabetes Devices Market Volume (K Unit) Forecast, by Application 2019 & 2032
- Table 59: Singapore Wearable Diabetes Devices Market Revenue (Million) Forecast, by Application 2019 & 2032
- Table 60: Singapore Wearable Diabetes Devices Market Volume (K Unit) Forecast, by Application 2019 & 2032
- Table 61: Thailandc Wearable Diabetes Devices Market Revenue (Million) Forecast, by Application 2019 & 2032
- Table 62: Thailandc Wearable Diabetes Devices Market Volume (K Unit) Forecast, by Application 2019 & 2032
- Table 63: Rest of Asia Pacific Wearable Diabetes Devices Market Revenue (Million) Forecast, by Application 2019 & 2032
- Table 64: Rest of Asia Pacific Wearable Diabetes Devices Market Volume (K Unit) Forecast, by Application 2019 & 2032
- Table 65: Global Wearable Diabetes Devices Market Revenue Million Forecast, by Country 2019 & 2032
- Table 66: Global Wearable Diabetes Devices Market Volume K Unit Forecast, by Country 2019 & 2032
- Table 67: Brazil Wearable Diabetes Devices Market Revenue (Million) Forecast, by Application 2019 & 2032
- Table 68: Brazil Wearable Diabetes Devices Market Volume (K Unit) Forecast, by Application 2019 & 2032
- Table 69: Argentina Wearable Diabetes Devices Market Revenue (Million) Forecast, by Application 2019 & 2032
- Table 70: Argentina Wearable Diabetes Devices Market Volume (K Unit) Forecast, by Application 2019 & 2032
- Table 71: Peru Wearable Diabetes Devices Market Revenue (Million) Forecast, by Application 2019 & 2032
- Table 72: Peru Wearable Diabetes Devices Market Volume (K Unit) Forecast, by Application 2019 & 2032
- Table 73: Chile Wearable Diabetes Devices Market Revenue (Million) Forecast, by Application 2019 & 2032
- Table 74: Chile Wearable Diabetes Devices Market Volume (K Unit) Forecast, by Application 2019 & 2032
- Table 75: Colombia Wearable Diabetes Devices Market Revenue (Million) Forecast, by Application 2019 & 2032
- Table 76: Colombia Wearable Diabetes Devices Market Volume (K Unit) Forecast, by Application 2019 & 2032
- Table 77: Ecuador Wearable Diabetes Devices Market Revenue (Million) Forecast, by Application 2019 & 2032
- Table 78: Ecuador Wearable Diabetes Devices Market Volume (K Unit) Forecast, by Application 2019 & 2032
- Table 79: Venezuela Wearable Diabetes Devices Market Revenue (Million) Forecast, by Application 2019 & 2032
- Table 80: Venezuela Wearable Diabetes Devices Market Volume (K Unit) Forecast, by Application 2019 & 2032
- Table 81: Rest of South America Wearable Diabetes Devices Market Revenue (Million) Forecast, by Application 2019 & 2032
- Table 82: Rest of South America Wearable Diabetes Devices Market Volume (K Unit) Forecast, by Application 2019 & 2032
- Table 83: Global Wearable Diabetes Devices Market Revenue Million Forecast, by Country 2019 & 2032
- Table 84: Global Wearable Diabetes Devices Market Volume K Unit Forecast, by Country 2019 & 2032
- Table 85: United Arab Emirates Wearable Diabetes Devices Market Revenue (Million) Forecast, by Application 2019 & 2032
- Table 86: United Arab Emirates Wearable Diabetes Devices Market Volume (K Unit) Forecast, by Application 2019 & 2032
- Table 87: Saudi Arabia Wearable Diabetes Devices Market Revenue (Million) Forecast, by Application 2019 & 2032
- Table 88: Saudi Arabia Wearable Diabetes Devices Market Volume (K Unit) Forecast, by Application 2019 & 2032
- Table 89: South Africa Wearable Diabetes Devices Market Revenue (Million) Forecast, by Application 2019 & 2032
- Table 90: South Africa Wearable Diabetes Devices Market Volume (K Unit) Forecast, by Application 2019 & 2032
- Table 91: Rest of Middle East and Africa Wearable Diabetes Devices Market Revenue (Million) Forecast, by Application 2019 & 2032
- Table 92: Rest of Middle East and Africa Wearable Diabetes Devices Market Volume (K Unit) Forecast, by Application 2019 & 2032
- Table 93: Global Wearable Diabetes Devices Market Revenue Million Forecast, by Device 2019 & 2032
- Table 94: Global Wearable Diabetes Devices Market Volume K Unit Forecast, by Device 2019 & 2032
- Table 95: Global Wearable Diabetes Devices Market Revenue Million Forecast, by Type 2019 & 2032
- Table 96: Global Wearable Diabetes Devices Market Volume K Unit Forecast, by Type 2019 & 2032
- Table 97: Global Wearable Diabetes Devices Market Revenue Million Forecast, by End User 2019 & 2032
- Table 98: Global Wearable Diabetes Devices Market Volume K Unit Forecast, by End User 2019 & 2032
- Table 99: Global Wearable Diabetes Devices Market Revenue Million Forecast, by Country 2019 & 2032
- Table 100: Global Wearable Diabetes Devices Market Volume K Unit Forecast, by Country 2019 & 2032
- Table 101: United States Wearable Diabetes Devices Market Revenue (Million) Forecast, by Application 2019 & 2032
- Table 102: United States Wearable Diabetes Devices Market Volume (K Unit) Forecast, by Application 2019 & 2032
- Table 103: Canada Wearable Diabetes Devices Market Revenue (Million) Forecast, by Application 2019 & 2032
- Table 104: Canada Wearable Diabetes Devices Market Volume (K Unit) Forecast, by Application 2019 & 2032
- Table 105: Rest of North America Wearable Diabetes Devices Market Revenue (Million) Forecast, by Application 2019 & 2032
- Table 106: Rest of North America Wearable Diabetes Devices Market Volume (K Unit) Forecast, by Application 2019 & 2032
- Table 107: Global Wearable Diabetes Devices Market Revenue Million Forecast, by Device 2019 & 2032
- Table 108: Global Wearable Diabetes Devices Market Volume K Unit Forecast, by Device 2019 & 2032
- Table 109: Global Wearable Diabetes Devices Market Revenue Million Forecast, by Type 2019 & 2032
- Table 110: Global Wearable Diabetes Devices Market Volume K Unit Forecast, by Type 2019 & 2032
- Table 111: Global Wearable Diabetes Devices Market Revenue Million Forecast, by End User 2019 & 2032
- Table 112: Global Wearable Diabetes Devices Market Volume K Unit Forecast, by End User 2019 & 2032
- Table 113: Global Wearable Diabetes Devices Market Revenue Million Forecast, by Country 2019 & 2032
- Table 114: Global Wearable Diabetes Devices Market Volume K Unit Forecast, by Country 2019 & 2032
- Table 115: France Wearable Diabetes Devices Market Revenue (Million) Forecast, by Application 2019 & 2032
- Table 116: France Wearable Diabetes Devices Market Volume (K Unit) Forecast, by Application 2019 & 2032
- Table 117: Germany Wearable Diabetes Devices Market Revenue (Million) Forecast, by Application 2019 & 2032
- Table 118: Germany Wearable Diabetes Devices Market Volume (K Unit) Forecast, by Application 2019 & 2032
- Table 119: Italy Wearable Diabetes Devices Market Revenue (Million) Forecast, by Application 2019 & 2032
- Table 120: Italy Wearable Diabetes Devices Market Volume (K Unit) Forecast, by Application 2019 & 2032
- Table 121: Spain Wearable Diabetes Devices Market Revenue (Million) Forecast, by Application 2019 & 2032
- Table 122: Spain Wearable Diabetes Devices Market Volume (K Unit) Forecast, by Application 2019 & 2032
- Table 123: United Kingdom Wearable Diabetes Devices Market Revenue (Million) Forecast, by Application 2019 & 2032
- Table 124: United Kingdom Wearable Diabetes Devices Market Volume (K Unit) Forecast, by Application 2019 & 2032
- Table 125: Russia Wearable Diabetes Devices Market Revenue (Million) Forecast, by Application 2019 & 2032
- Table 126: Russia Wearable Diabetes Devices Market Volume (K Unit) Forecast, by Application 2019 & 2032
- Table 127: Rest of Europe Wearable Diabetes Devices Market Revenue (Million) Forecast, by Application 2019 & 2032
- Table 128: Rest of Europe Wearable Diabetes Devices Market Volume (K Unit) Forecast, by Application 2019 & 2032
- Table 129: Global Wearable Diabetes Devices Market Revenue Million Forecast, by Device 2019 & 2032
- Table 130: Global Wearable Diabetes Devices Market Volume K Unit Forecast, by Device 2019 & 2032
- Table 131: Global Wearable Diabetes Devices Market Revenue Million Forecast, by Type 2019 & 2032
- Table 132: Global Wearable Diabetes Devices Market Volume K Unit Forecast, by Type 2019 & 2032
- Table 133: Global Wearable Diabetes Devices Market Revenue Million Forecast, by End User 2019 & 2032
- Table 134: Global Wearable Diabetes Devices Market Volume K Unit Forecast, by End User 2019 & 2032
- Table 135: Global Wearable Diabetes Devices Market Revenue Million Forecast, by Country 2019 & 2032
- Table 136: Global Wearable Diabetes Devices Market Volume K Unit Forecast, by Country 2019 & 2032
- Table 137: Mexico Wearable Diabetes Devices Market Revenue (Million) Forecast, by Application 2019 & 2032
- Table 138: Mexico Wearable Diabetes Devices Market Volume (K Unit) Forecast, by Application 2019 & 2032
- Table 139: Brazil Wearable Diabetes Devices Market Revenue (Million) Forecast, by Application 2019 & 2032
- Table 140: Brazil Wearable Diabetes Devices Market Volume (K Unit) Forecast, by Application 2019 & 2032
- Table 141: Rest of Latin America Wearable Diabetes Devices Market Revenue (Million) Forecast, by Application 2019 & 2032
- Table 142: Rest of Latin America Wearable Diabetes Devices Market Volume (K Unit) Forecast, by Application 2019 & 2032
- Table 143: Global Wearable Diabetes Devices Market Revenue Million Forecast, by Device 2019 & 2032
- Table 144: Global Wearable Diabetes Devices Market Volume K Unit Forecast, by Device 2019 & 2032
- Table 145: Global Wearable Diabetes Devices Market Revenue Million Forecast, by Type 2019 & 2032
- Table 146: Global Wearable Diabetes Devices Market Volume K Unit Forecast, by Type 2019 & 2032
- Table 147: Global Wearable Diabetes Devices Market Revenue Million Forecast, by End User 2019 & 2032
- Table 148: Global Wearable Diabetes Devices Market Volume K Unit Forecast, by End User 2019 & 2032
- Table 149: Global Wearable Diabetes Devices Market Revenue Million Forecast, by Country 2019 & 2032
- Table 150: Global Wearable Diabetes Devices Market Volume K Unit Forecast, by Country 2019 & 2032
- Table 151: Japan Wearable Diabetes Devices Market Revenue (Million) Forecast, by Application 2019 & 2032
- Table 152: Japan Wearable Diabetes Devices Market Volume (K Unit) Forecast, by Application 2019 & 2032
- Table 153: South Korea Wearable Diabetes Devices Market Revenue (Million) Forecast, by Application 2019 & 2032
- Table 154: South Korea Wearable Diabetes Devices Market Volume (K Unit) Forecast, by Application 2019 & 2032
- Table 155: China Wearable Diabetes Devices Market Revenue (Million) Forecast, by Application 2019 & 2032
- Table 156: China Wearable Diabetes Devices Market Volume (K Unit) Forecast, by Application 2019 & 2032
- Table 157: India Wearable Diabetes Devices Market Revenue (Million) Forecast, by Application 2019 & 2032
- Table 158: India Wearable Diabetes Devices Market Volume (K Unit) Forecast, by Application 2019 & 2032
- Table 159: Australia Wearable Diabetes Devices Market Revenue (Million) Forecast, by Application 2019 & 2032
- Table 160: Australia Wearable Diabetes Devices Market Volume (K Unit) Forecast, by Application 2019 & 2032
- Table 161: Vietnam Wearable Diabetes Devices Market Revenue (Million) Forecast, by Application 2019 & 2032
- Table 162: Vietnam Wearable Diabetes Devices Market Volume (K Unit) Forecast, by Application 2019 & 2032
- Table 163: Malaysia Wearable Diabetes Devices Market Revenue (Million) Forecast, by Application 2019 & 2032
- Table 164: Malaysia Wearable Diabetes Devices Market Volume (K Unit) Forecast, by Application 2019 & 2032
- Table 165: Indonesia Wearable Diabetes Devices Market Revenue (Million) Forecast, by Application 2019 & 2032
- Table 166: Indonesia Wearable Diabetes Devices Market Volume (K Unit) Forecast, by Application 2019 & 2032
- Table 167: Thailand Wearable Diabetes Devices Market Revenue (Million) Forecast, by Application 2019 & 2032
- Table 168: Thailand Wearable Diabetes Devices Market Volume (K Unit) Forecast, by Application 2019 & 2032
- Table 169: Rest of Asia Pacific Wearable Diabetes Devices Market Revenue (Million) Forecast, by Application 2019 & 2032
- Table 170: Rest of Asia Pacific Wearable Diabetes Devices Market Volume (K Unit) Forecast, by Application 2019 & 2032
- Table 171: Global Wearable Diabetes Devices Market Revenue Million Forecast, by Device 2019 & 2032
- Table 172: Global Wearable Diabetes Devices Market Volume K Unit Forecast, by Device 2019 & 2032
- Table 173: Global Wearable Diabetes Devices Market Revenue Million Forecast, by Type 2019 & 2032
- Table 174: Global Wearable Diabetes Devices Market Volume K Unit Forecast, by Type 2019 & 2032
- Table 175: Global Wearable Diabetes Devices Market Revenue Million Forecast, by End User 2019 & 2032
- Table 176: Global Wearable Diabetes Devices Market Volume K Unit Forecast, by End User 2019 & 2032
- Table 177: Global Wearable Diabetes Devices Market Revenue Million Forecast, by Country 2019 & 2032
- Table 178: Global Wearable Diabetes Devices Market Volume K Unit Forecast, by Country 2019 & 2032
- Table 179: Saudi Arabia Wearable Diabetes Devices Market Revenue (Million) Forecast, by Application 2019 & 2032
- Table 180: Saudi Arabia Wearable Diabetes Devices Market Volume (K Unit) Forecast, by Application 2019 & 2032
- Table 181: Iran Wearable Diabetes Devices Market Revenue (Million) Forecast, by Application 2019 & 2032
- Table 182: Iran Wearable Diabetes Devices Market Volume (K Unit) Forecast, by Application 2019 & 2032
- Table 183: Egypt Wearable Diabetes Devices Market Revenue (Million) Forecast, by Application 2019 & 2032
- Table 184: Egypt Wearable Diabetes Devices Market Volume (K Unit) Forecast, by Application 2019 & 2032
- Table 185: Oman Wearable Diabetes Devices Market Revenue (Million) Forecast, by Application 2019 & 2032
- Table 186: Oman Wearable Diabetes Devices Market Volume (K Unit) Forecast, by Application 2019 & 2032
- Table 187: South Africa Wearable Diabetes Devices Market Revenue (Million) Forecast, by Application 2019 & 2032
- Table 188: South Africa Wearable Diabetes Devices Market Volume (K Unit) Forecast, by Application 2019 & 2032
- Table 189: Rest of Middle East and Africa Wearable Diabetes Devices Market Revenue (Million) Forecast, by Application 2019 & 2032
- Table 190: Rest of Middle East and Africa Wearable Diabetes Devices Market Volume (K Unit) Forecast, by Application 2019 & 2032
Frequently Asked Questions
1. What is the projected Compound Annual Growth Rate (CAGR) of the Wearable Diabetes Devices Market?
The projected CAGR is approximately > 10.00%.
2. Which companies are prominent players in the Wearable Diabetes Devices Market?
Key companies in the market include Eversence, Medtronics, Tandem Diabetes Care, Ascensia, Insulet Corporation, Abbott, Ypsomped, Dexcom.
3. What are the main segments of the Wearable Diabetes Devices Market?
The market segments include Device, Type, End User.
4. Can you provide details about the market size?
The market size is estimated to be USD 11 Million as of 2022.
5. What are some drivers contributing to market growth?
Rapidly Increasing Incidence and Prevalence of Diabetes; Technological Advancements in the Market.
6. What are the notable trends driving market growth?
Rising diabetes prevalence globally is driving the market in forecast years.
7. Are there any restraints impacting market growth?
Monopolized Supply Chain and High Cost of Devices.
8. Can you provide examples of recent developments in the market?
May 2023: The Beta Bionics iLet ACE Pump and the iLet Dosing Decision Software have been granted clearance by the U.S. Food and Drug Administration for individuals aged six and above who have type 1 diabetes. When combined with a compatible FDA-cleared integrated continuous glucose monitor (iCGM), these two devices will create a novel system known as the iLet Bionic Pancreas. This innovative automated insulin dosing (AID) system employs an algorithm to ascertain and direct the administration of insulin.
9. What pricing options are available for accessing the report?
Pricing options include single-user, multi-user, and enterprise licenses priced at USD 4750, USD 5250, and USD 8750 respectively.
10. Is the market size provided in terms of value or volume?
The market size is provided in terms of value, measured in Million and volume, measured in K Unit.
11. Are there any specific market keywords associated with the report?
Yes, the market keyword associated with the report is "Wearable Diabetes Devices Market," which aids in identifying and referencing the specific market segment covered.
12. How do I determine which pricing option suits my needs best?
The pricing options vary based on user requirements and access needs. Individual users may opt for single-user licenses, while businesses requiring broader access may choose multi-user or enterprise licenses for cost-effective access to the report.
13. Are there any additional resources or data provided in the Wearable Diabetes Devices Market report?
While the report offers comprehensive insights, it's advisable to review the specific contents or supplementary materials provided to ascertain if additional resources or data are available.
14. How can I stay updated on further developments or reports in the Wearable Diabetes Devices Market?
To stay informed about further developments, trends, and reports in the Wearable Diabetes Devices Market, consider subscribing to industry newsletters, following relevant companies and organizations, or regularly checking reputable industry news sources and publications.
Methodology
Step 1 - Identification of Relevant Samples Size from Population Database


Step 2 - Approaches for Defining Global Market Size (Value, Volume* & Price*)

Note*: In applicable scenarios
Step 3 - Data Sources
Primary Research
- Web Analytics
- Survey Reports
- Research Institute
- Latest Research Reports
- Opinion Leaders
Secondary Research
- Annual Reports
- White Paper
- Latest Press Release
- Industry Association
- Paid Database
- Investor Presentations

Step 4 - Data Triangulation
Involves using different sources of information in order to increase the validity of a study
These sources are likely to be stakeholders in a program - participants, other researchers, program staff, other community members, and so on.
Then we put all data in single framework & apply various statistical tools to find out the dynamic on the market.
During the analysis stage, feedback from the stakeholder groups would be compared to determine areas of agreement as well as areas of divergence


