

Key Insights
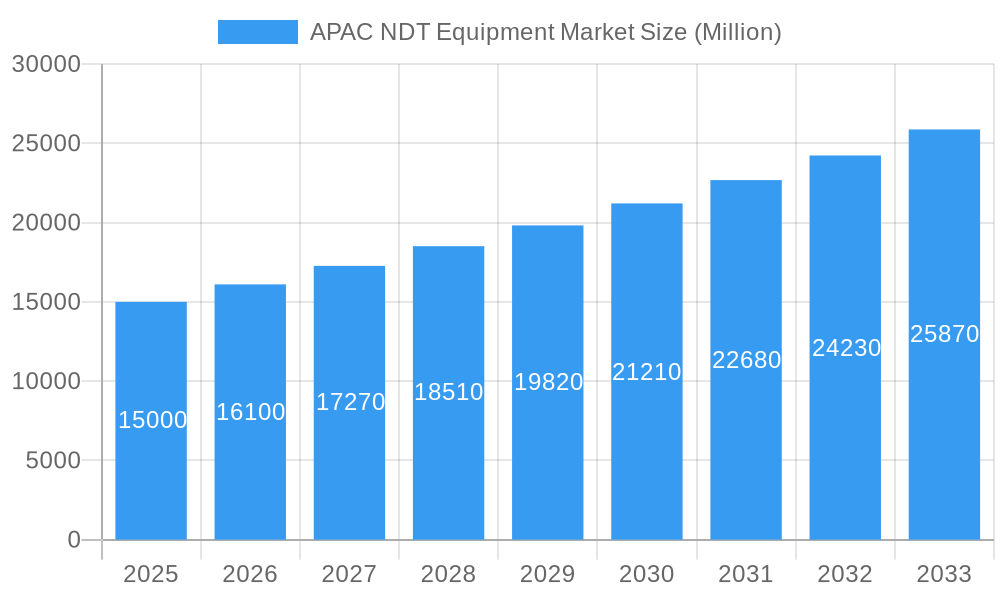
The Asia-Pacific (APAC) Non-Destructive Testing (NDT) equipment market is experiencing substantial growth, propelled by escalating investments in infrastructure development across key economies such as China, India, and Japan. Heightened demand for rigorous quality control and assurance across critical sectors including oil & gas, power & energy, and automotive & transportation is a primary driver. Furthermore, the implementation of stringent safety regulations and a heightened emphasis on preventing operational failures are accelerating the adoption of advanced NDT technologies like ultrasonic and eddy current testing. The market is segmented by technology (radiography, ultrasonic, magnetic particle, liquid penetrant, visual, eddy current, etc.) and end-user (oil & gas, power & energy, construction, automotive & transportation, aerospace & defense, etc.). While the market is characterized by intense competition from global and regional players, the increasing integration of automation and digitalization in NDT processes presents significant opportunities for innovation and expansion. The projected Compound Annual Growth Rate (CAGR) of 7.23% indicates a robust market expansion from the base year 2025, with a projected market size of $5 billion by 2033. Advancements in technology, including the incorporation of AI and machine learning in NDT systems, are expected to further enhance accuracy and efficiency, thereby boosting market growth.
APAC NDT Equipment Market Market Size (In Billion)
China and India are anticipated to be significant contributors to the overall regional market expansion, driven by government initiatives supporting infrastructure development and industrialization, alongside growing awareness of safety and quality standards. Nevertheless, challenges such as the high initial investment for advanced equipment and the requirement for skilled personnel may impact market dynamics. Despite these considerations, the long-term outlook for the APAC NDT equipment market remains optimistic, underpinned by continuous industrial expansion and the critical need for ensuring structural integrity and operational safety in vital industries. The market is poised for continued growth through strategic collaborations, technological innovation, and the widespread adoption of sophisticated NDT techniques.
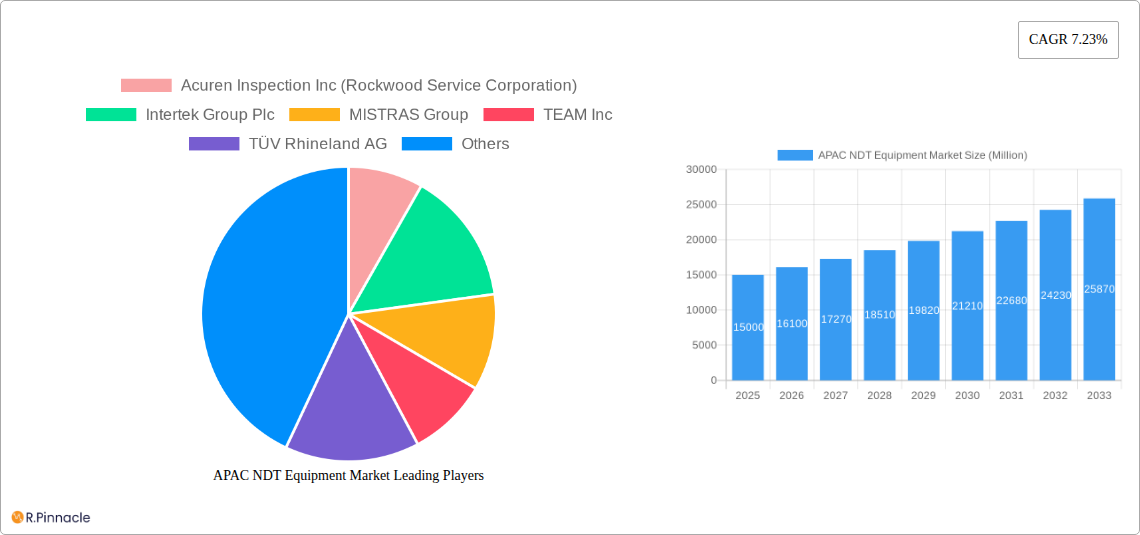
APAC NDT Equipment Market Company Market Share
APAC NDT Equipment Market Report: 2019-2033
This comprehensive report provides a detailed analysis of the Asia-Pacific (APAC) Non-Destructive Testing (NDT) equipment market, offering invaluable insights for industry professionals, investors, and strategic planners. Covering the period from 2019 to 2033, with a focus on 2025, this report dissects market dynamics, identifies key players, and projects future growth trajectories.
APAC NDT Equipment Market Structure & Innovation Trends
The APAC NDT equipment market exhibits a moderately concentrated structure, with key players such as Acuren Inspection Inc (Rockwood Service Corporation), Intertek Group Plc, MISTRAS Group, TEAM Inc, TÜV Rhineland AG, and Zetec Inc holding significant market share. However, the market also features a number of smaller, specialized players, leading to competitive dynamics. Innovation is driven by the increasing demand for advanced NDT techniques across diverse end-user sectors. Regulatory frameworks, particularly concerning safety and environmental compliance, play a significant role in shaping market trends. Product substitutes, such as advanced imaging technologies, present both opportunities and challenges. The market has witnessed several mergers and acquisitions (M&A) in recent years, though the exact values are unavailable (xx Million). These activities demonstrate a clear trend towards consolidation and expansion within the industry.
- Market Concentration: Moderately concentrated, with a few dominant players and several smaller niche players.
- Innovation Drivers: Demand for improved accuracy, efficiency, and automation in NDT processes. Growing adoption of advanced technologies such as AI and machine learning.
- Regulatory Frameworks: Stringent safety regulations across various industries drive demand for advanced NDT solutions.
- Product Substitutes: Advanced imaging and sensing technologies are emerging as potential substitutes.
- End-User Demographics: Diverse, encompassing Oil & Gas, Power & Energy, Construction, Automotive & Transportation, Aerospace & Defense, and other sectors.
- M&A Activities: Several M&A deals have been observed in recent years, with aggregate values estimated at xx Million.
APAC NDT Equipment Market Dynamics & Trends
The APAC NDT equipment market is experiencing robust growth, fueled by several key factors. The expanding infrastructure development projects across the region, particularly in China and India, are driving a strong demand for NDT equipment. The growing need for safety and quality control in various industries, coupled with technological advancements leading to more efficient and accurate NDT techniques, further fuels market expansion. The increasing adoption of automation and digitalization in NDT processes is streamlining operations and improving overall productivity. Competitive dynamics are intense, with both established players and new entrants vying for market share. The market is expected to maintain a Compound Annual Growth Rate (CAGR) of xx% during the forecast period (2025-2033), with significant market penetration across various end-user segments.
Dominant Regions & Segments in APAC NDT Equipment Market
China holds the dominant position in the APAC NDT equipment market, driven by its large manufacturing base and robust infrastructure development. Japan and India also represent significant market segments. Among technology types, Ultrasonic Testing and Radiography Testing hold a considerable share due to their wide applicability and established presence. The Oil & Gas, Power & Energy, and Construction sectors are the primary end-users, accounting for a substantial portion of the overall market demand.
- Key Drivers in China: Rapid industrialization, extensive infrastructure development, stringent quality control regulations.
- Key Drivers in Japan: Advanced manufacturing sector, high adoption of automation in NDT processes, focus on technological innovation.
- Key Drivers in India: Booming construction industry, growing energy sector, increasing adoption of NDT techniques in various industries.
- Dominant Technology Type: Ultrasonic Testing and Radiography Testing due to versatility and wide applicability.
- Dominant End-User: Oil & Gas, Power & Energy, and Construction sectors are major drivers of market demand.
APAC NDT Equipment Market Product Innovations
Recent innovations have focused on improving the accuracy, portability, and efficiency of NDT equipment. Manufacturers are integrating advanced technologies like AI and machine learning to enhance data analysis and improve defect detection. The introduction of automated systems and remote inspection capabilities is streamlining workflows and reducing operational costs. These advancements are aimed at enhancing overall market fit by addressing the demand for faster, more reliable, and cost-effective NDT solutions.
Report Scope & Segmentation Analysis
This report segments the APAC NDT equipment market by Technology Type (Radiography Testing, Ultrasonic Testing, Magnetic Particle Testing, Liquid Penetrant Testing, Visual Inspection, Eddy Current Testing, Other Technologies), End-user (Oil & Gas, Power & Energy, Construction, Automotive & Transportation, Aerospace & Defense, Other End-users), and Country (China, Japan, India, South Korea, Singapore, Indonesia, Others). Each segment’s growth projections, market sizes, and competitive dynamics are analyzed individually, providing a granular understanding of the market landscape. The market size for each segment is estimated to range from xx Million to xx Million depending on the segment and year, with substantial future growth predicted.
Key Drivers of APAC NDT Equipment Market Growth
The APAC NDT equipment market's growth is primarily driven by stringent government regulations mandating quality control, rapid industrialization and infrastructure development in developing economies, increasing adoption of advanced technologies for improved efficiency and accuracy, and rising demand from diverse end-user industries, including Oil & Gas, Power & Energy, Construction, and Automotive.
Challenges in the APAC NDT Equipment Market Sector
Key challenges include the high initial investment costs for advanced NDT equipment, the need for skilled technicians to operate complex systems, the potential for supply chain disruptions due to geopolitical factors, and the competitive pressure from both domestic and international players. These factors can impact market growth negatively, slowing expansion rates.
Emerging Opportunities in APAP NDT Equipment Market
Emerging opportunities lie in the adoption of innovative technologies, including AI and machine learning, for improved automation and data analysis in NDT processes. Expansion into new markets, particularly in the developing economies of Southeast Asia, presents significant growth potential. The increasing focus on sustainable practices in various industries also offers opportunities for environmentally friendly NDT solutions.
Leading Players in the APAC NDT Equipment Market Market
- Acuren Inspection Inc (Rockwood Service Corporation)
- Intertek Group Plc
- MISTRAS Group
- TEAM Inc
- TÜV Rhineland AG
- Zetec Inc
- SGS Group
- Bureau Veritas S A
- Nikon Metrology NV
- Fujifilm Corporation
- Olympus Corporation
- Magnaflux Corp
- NCS Testing Technology Co Limited
- GE Measurement and Control
- Applus Services S A
- YXLON International Gmbh (COMET Group)
Key Developments in APAC NDT Equipment Market Industry
- April 2021: Nikon Corporation launched the Lasermeister 102A, a new optical processing system enhancing capabilities in additive manufacturing and precision measurement. This signals the integration of advanced technologies into related fields impacting the precision needed in NDT.
- April 2021: Nikon Corporation released a "Remote Control SDK" for its NEXIV series, boosting automation and efficiency in measurement and inspection processes. This technology enhances remote inspection capabilities impacting NDT efficiency.
- April 2021: Bureau Veritas joined the Task Force on Climate-related Financial Disclosures (TCFD), highlighting a growing focus on environmental sustainability within the industry and influencing the demand for NDT in environmentally conscious applications.
- April 2021: Bureau Veritas partnered with Carnival Corporation & plc, signifying increased demand for NDT services in the leisure travel sector due to post-pandemic safety concerns.
Future Outlook for APAC NDT Equipment Market Market
The APAC NDT equipment market is poised for continued growth driven by robust infrastructure development, stringent safety regulations, and technological advancements. The increasing adoption of automation and digitalization, coupled with the expansion into new markets, will create significant opportunities for industry players. Strategic partnerships and collaborations will play a vital role in driving future innovation and market expansion.
APAC NDT Equipment Market Segmentation
-
1. Technology Type
- 1.1. Radiography Testing
- 1.2. Ultrasonic Testing
- 1.3. Magnetic Particle Testing*
- 1.4. Liquid Penetrant Testing
- 1.5. Visual Inspection
- 1.6. Eddy Current Testing*
- 1.7. Other Technologies
-
2. End-user
- 2.1. Oil & Gas
- 2.2. Power & Energy
- 2.3. Construction
- 2.4. Automotive & Transportation
- 2.5. Aerospace & Defense
- 2.6. Other End-users
APAC NDT Equipment Market Segmentation By Geography
-
1. North America
- 1.1. United States
- 1.2. Canada
- 1.3. Mexico
-
2. South America
- 2.1. Brazil
- 2.2. Argentina
- 2.3. Rest of South America
-
3. Europe
- 3.1. United Kingdom
- 3.2. Germany
- 3.3. France
- 3.4. Italy
- 3.5. Spain
- 3.6. Russia
- 3.7. Benelux
- 3.8. Nordics
- 3.9. Rest of Europe
-
4. Middle East & Africa
- 4.1. Turkey
- 4.2. Israel
- 4.3. GCC
- 4.4. North Africa
- 4.5. South Africa
- 4.6. Rest of Middle East & Africa
-
5. Asia Pacific
- 5.1. China
- 5.2. India
- 5.3. Japan
- 5.4. South Korea
- 5.5. ASEAN
- 5.6. Oceania
- 5.7. Rest of Asia Pacific
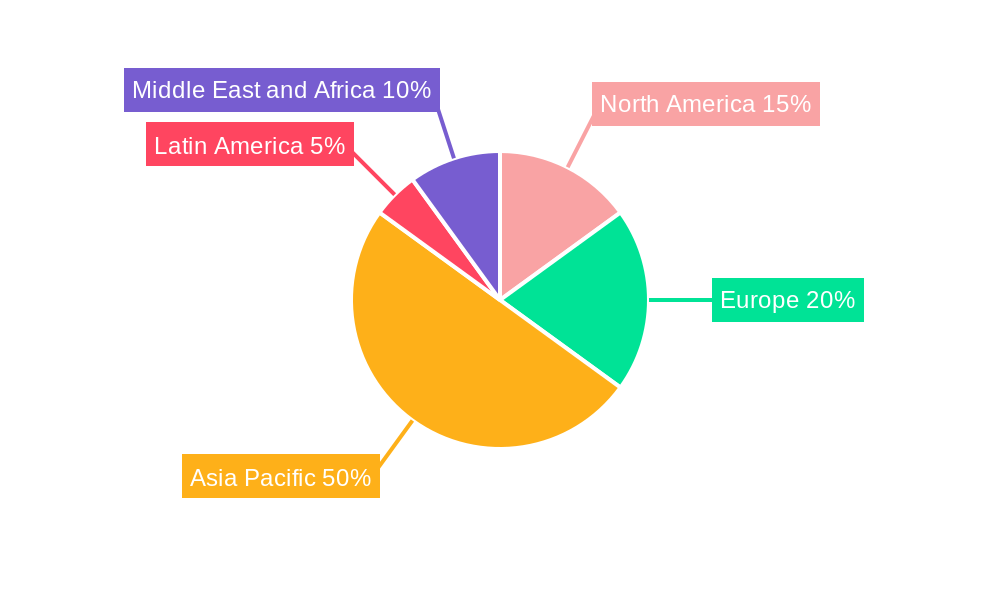
APAC NDT Equipment Market Regional Market Share
Geographic Coverage of APAC NDT Equipment Market
APAC NDT Equipment Market REPORT HIGHLIGHTS
| Aspects | Details |
|---|---|
| Study Period | 2020-2034 |
| Base Year | 2025 |
| Estimated Year | 2026 |
| Forecast Period | 2026-2034 |
| Historical Period | 2020-2025 |
| Growth Rate | CAGR of 7.23% from 2020-2034 |
| Segmentation |
|
Table of Contents
- 1. Introduction
- 1.1. Research Scope
- 1.2. Market Segmentation
- 1.3. Research Objective
- 1.4. Definitions and Assumptions
- 2. Executive Summary
- 2.1. Market Snapshot
- 3. Market Dynamics
- 3.1. Market Drivers
- 3.2. Market Restrains
- 3.3. Market Trends
- 3.4. Market Opportunities
- 4. Market Factor Analysis
- 4.1. Porters Five Forces
- 4.1.1. Bargaining Power of Suppliers
- 4.1.2. Bargaining Power of Buyers
- 4.1.3. Threat of New Entrants
- 4.1.4. Threat of Substitutes
- 4.1.5. Competitive Rivalry
- 4.2. PESTEL analysis
- 4.3. BCG Analysis
- 4.3.1. Stars (High Growth, High Market Share)
- 4.3.2. Cash Cows (Low Growth, High Market Share)
- 4.3.3. Question Mark (High Growth, Low Market Share)
- 4.3.4. Dogs (Low Growth, Low Market Share)
- 4.4. Ansoff Matrix Analysis
- 4.5. Supply Chain Analysis
- 4.6. Regulatory Landscape
- 4.7. Current Market Potential and Opportunity Assessment (TAM–SAM–SOM Framework)
- 4.8. PRI Analyst Note
- 4.1. Porters Five Forces
- 5. Market Analysis, Insights and Forecast 2021-2033
- 5.1. Market Analysis, Insights and Forecast - by Technology Type
- 5.1.1. Radiography Testing
- 5.1.2. Ultrasonic Testing
- 5.1.3. Magnetic Particle Testing*
- 5.1.4. Liquid Penetrant Testing
- 5.1.5. Visual Inspection
- 5.1.6. Eddy Current Testing*
- 5.1.7. Other Technologies
- 5.2. Market Analysis, Insights and Forecast - by End-user
- 5.2.1. Oil & Gas
- 5.2.2. Power & Energy
- 5.2.3. Construction
- 5.2.4. Automotive & Transportation
- 5.2.5. Aerospace & Defense
- 5.2.6. Other End-users
- 5.3. Market Analysis, Insights and Forecast - by Region
- 5.3.1. North America
- 5.3.2. South America
- 5.3.3. Europe
- 5.3.4. Middle East & Africa
- 5.3.5. Asia Pacific
- 5.1. Market Analysis, Insights and Forecast - by Technology Type
- 6. Global APAC NDT Equipment Market Analysis, Insights and Forecast, 2021-2033
- 6.1. Market Analysis, Insights and Forecast - by Technology Type
- 6.1.1. Radiography Testing
- 6.1.2. Ultrasonic Testing
- 6.1.3. Magnetic Particle Testing*
- 6.1.4. Liquid Penetrant Testing
- 6.1.5. Visual Inspection
- 6.1.6. Eddy Current Testing*
- 6.1.7. Other Technologies
- 6.2. Market Analysis, Insights and Forecast - by End-user
- 6.2.1. Oil & Gas
- 6.2.2. Power & Energy
- 6.2.3. Construction
- 6.2.4. Automotive & Transportation
- 6.2.5. Aerospace & Defense
- 6.2.6. Other End-users
- 6.1. Market Analysis, Insights and Forecast - by Technology Type
- 7. North America APAC NDT Equipment Market Analysis, Insights and Forecast, 2020-2032
- 7.1. Market Analysis, Insights and Forecast - by Technology Type
- 7.1.1. Radiography Testing
- 7.1.2. Ultrasonic Testing
- 7.1.3. Magnetic Particle Testing*
- 7.1.4. Liquid Penetrant Testing
- 7.1.5. Visual Inspection
- 7.1.6. Eddy Current Testing*
- 7.1.7. Other Technologies
- 7.2. Market Analysis, Insights and Forecast - by End-user
- 7.2.1. Oil & Gas
- 7.2.2. Power & Energy
- 7.2.3. Construction
- 7.2.4. Automotive & Transportation
- 7.2.5. Aerospace & Defense
- 7.2.6. Other End-users
- 7.1. Market Analysis, Insights and Forecast - by Technology Type
- 8. South America APAC NDT Equipment Market Analysis, Insights and Forecast, 2020-2032
- 8.1. Market Analysis, Insights and Forecast - by Technology Type
- 8.1.1. Radiography Testing
- 8.1.2. Ultrasonic Testing
- 8.1.3. Magnetic Particle Testing*
- 8.1.4. Liquid Penetrant Testing
- 8.1.5. Visual Inspection
- 8.1.6. Eddy Current Testing*
- 8.1.7. Other Technologies
- 8.2. Market Analysis, Insights and Forecast - by End-user
- 8.2.1. Oil & Gas
- 8.2.2. Power & Energy
- 8.2.3. Construction
- 8.2.4. Automotive & Transportation
- 8.2.5. Aerospace & Defense
- 8.2.6. Other End-users
- 8.1. Market Analysis, Insights and Forecast - by Technology Type
- 9. Europe APAC NDT Equipment Market Analysis, Insights and Forecast, 2020-2032
- 9.1. Market Analysis, Insights and Forecast - by Technology Type
- 9.1.1. Radiography Testing
- 9.1.2. Ultrasonic Testing
- 9.1.3. Magnetic Particle Testing*
- 9.1.4. Liquid Penetrant Testing
- 9.1.5. Visual Inspection
- 9.1.6. Eddy Current Testing*
- 9.1.7. Other Technologies
- 9.2. Market Analysis, Insights and Forecast - by End-user
- 9.2.1. Oil & Gas
- 9.2.2. Power & Energy
- 9.2.3. Construction
- 9.2.4. Automotive & Transportation
- 9.2.5. Aerospace & Defense
- 9.2.6. Other End-users
- 9.1. Market Analysis, Insights and Forecast - by Technology Type
- 10. Middle East & Africa APAC NDT Equipment Market Analysis, Insights and Forecast, 2020-2032
- 10.1. Market Analysis, Insights and Forecast - by Technology Type
- 10.1.1. Radiography Testing
- 10.1.2. Ultrasonic Testing
- 10.1.3. Magnetic Particle Testing*
- 10.1.4. Liquid Penetrant Testing
- 10.1.5. Visual Inspection
- 10.1.6. Eddy Current Testing*
- 10.1.7. Other Technologies
- 10.2. Market Analysis, Insights and Forecast - by End-user
- 10.2.1. Oil & Gas
- 10.2.2. Power & Energy
- 10.2.3. Construction
- 10.2.4. Automotive & Transportation
- 10.2.5. Aerospace & Defense
- 10.2.6. Other End-users
- 10.1. Market Analysis, Insights and Forecast - by Technology Type
- 11. Asia Pacific APAC NDT Equipment Market Analysis, Insights and Forecast, 2020-2032
- 11.1. Market Analysis, Insights and Forecast - by Technology Type
- 11.1.1. Radiography Testing
- 11.1.2. Ultrasonic Testing
- 11.1.3. Magnetic Particle Testing*
- 11.1.4. Liquid Penetrant Testing
- 11.1.5. Visual Inspection
- 11.1.6. Eddy Current Testing*
- 11.1.7. Other Technologies
- 11.2. Market Analysis, Insights and Forecast - by End-user
- 11.2.1. Oil & Gas
- 11.2.2. Power & Energy
- 11.2.3. Construction
- 11.2.4. Automotive & Transportation
- 11.2.5. Aerospace & Defense
- 11.2.6. Other End-users
- 11.1. Market Analysis, Insights and Forecast - by Technology Type
- 12. Competitive Analysis
- 12.1. Company Profiles
- 12.1.1 Acuren Inspection Inc (Rockwood Service Corporation)
- 12.1.1.1. Company Overview
- 12.1.1.2. Products
- 12.1.1.3. Company Financials
- 12.1.1.4. SWOT Analysis
- 12.1.2 Intertek Group Plc
- 12.1.2.1. Company Overview
- 12.1.2.2. Products
- 12.1.2.3. Company Financials
- 12.1.2.4. SWOT Analysis
- 12.1.3 MISTRAS Group
- 12.1.3.1. Company Overview
- 12.1.3.2. Products
- 12.1.3.3. Company Financials
- 12.1.3.4. SWOT Analysis
- 12.1.4 TEAM Inc
- 12.1.4.1. Company Overview
- 12.1.4.2. Products
- 12.1.4.3. Company Financials
- 12.1.4.4. SWOT Analysis
- 12.1.5 TÜV Rhineland AG
- 12.1.5.1. Company Overview
- 12.1.5.2. Products
- 12.1.5.3. Company Financials
- 12.1.5.4. SWOT Analysis
- 12.1.6 Zetec Inc *List Not Exhaustive
- 12.1.6.1. Company Overview
- 12.1.6.2. Products
- 12.1.6.3. Company Financials
- 12.1.6.4. SWOT Analysis
- 12.1.7 SGS Group
- 12.1.7.1. Company Overview
- 12.1.7.2. Products
- 12.1.7.3. Company Financials
- 12.1.7.4. SWOT Analysis
- 12.1.8 Bureau Veritas S A
- 12.1.8.1. Company Overview
- 12.1.8.2. Products
- 12.1.8.3. Company Financials
- 12.1.8.4. SWOT Analysis
- 12.1.9 Nikon Metrology NV
- 12.1.9.1. Company Overview
- 12.1.9.2. Products
- 12.1.9.3. Company Financials
- 12.1.9.4. SWOT Analysis
- 12.1.10 Fujifilm Corporation
- 12.1.10.1. Company Overview
- 12.1.10.2. Products
- 12.1.10.3. Company Financials
- 12.1.10.4. SWOT Analysis
- 12.1.11 Olympus Corporation
- 12.1.11.1. Company Overview
- 12.1.11.2. Products
- 12.1.11.3. Company Financials
- 12.1.11.4. SWOT Analysis
- 12.1.12 Magnaflux Corp
- 12.1.12.1. Company Overview
- 12.1.12.2. Products
- 12.1.12.3. Company Financials
- 12.1.12.4. SWOT Analysis
- 12.1.13 NCS Testing Technology Co Limited
- 12.1.13.1. Company Overview
- 12.1.13.2. Products
- 12.1.13.3. Company Financials
- 12.1.13.4. SWOT Analysis
- 12.1.14 GE Measurement and Control
- 12.1.14.1. Company Overview
- 12.1.14.2. Products
- 12.1.14.3. Company Financials
- 12.1.14.4. SWOT Analysis
- 12.1.15 Applus Services S A
- 12.1.15.1. Company Overview
- 12.1.15.2. Products
- 12.1.15.3. Company Financials
- 12.1.15.4. SWOT Analysis
- 12.1.16 YXLON International Gmbh ( COMET Group)
- 12.1.16.1. Company Overview
- 12.1.16.2. Products
- 12.1.16.3. Company Financials
- 12.1.16.4. SWOT Analysis
- 12.1.1 Acuren Inspection Inc (Rockwood Service Corporation)
- 12.2. Market Entropy
- 12.2.1 Company's Key Areas Served
- 12.2.2 Recent Developments
- 12.3. Company Market Share Analysis 2025
- 12.3.1 Top 5 Companies Market Share Analysis
- 12.3.2 Top 3 Companies Market Share Analysis
- 12.4. List of Potential Customers
- 13. Research Methodology
List of Figures
- Figure 1: Global APAC NDT Equipment Market Revenue Breakdown (billion, %) by Region 2025 & 2033
- Figure 2: North America APAC NDT Equipment Market Revenue (billion), by Technology Type 2025 & 2033
- Figure 3: North America APAC NDT Equipment Market Revenue Share (%), by Technology Type 2025 & 2033
- Figure 4: North America APAC NDT Equipment Market Revenue (billion), by End-user 2025 & 2033
- Figure 5: North America APAC NDT Equipment Market Revenue Share (%), by End-user 2025 & 2033
- Figure 6: North America APAC NDT Equipment Market Revenue (billion), by Country 2025 & 2033
- Figure 7: North America APAC NDT Equipment Market Revenue Share (%), by Country 2025 & 2033
- Figure 8: South America APAC NDT Equipment Market Revenue (billion), by Technology Type 2025 & 2033
- Figure 9: South America APAC NDT Equipment Market Revenue Share (%), by Technology Type 2025 & 2033
- Figure 10: South America APAC NDT Equipment Market Revenue (billion), by End-user 2025 & 2033
- Figure 11: South America APAC NDT Equipment Market Revenue Share (%), by End-user 2025 & 2033
- Figure 12: South America APAC NDT Equipment Market Revenue (billion), by Country 2025 & 2033
- Figure 13: South America APAC NDT Equipment Market Revenue Share (%), by Country 2025 & 2033
- Figure 14: Europe APAC NDT Equipment Market Revenue (billion), by Technology Type 2025 & 2033
- Figure 15: Europe APAC NDT Equipment Market Revenue Share (%), by Technology Type 2025 & 2033
- Figure 16: Europe APAC NDT Equipment Market Revenue (billion), by End-user 2025 & 2033
- Figure 17: Europe APAC NDT Equipment Market Revenue Share (%), by End-user 2025 & 2033
- Figure 18: Europe APAC NDT Equipment Market Revenue (billion), by Country 2025 & 2033
- Figure 19: Europe APAC NDT Equipment Market Revenue Share (%), by Country 2025 & 2033
- Figure 20: Middle East & Africa APAC NDT Equipment Market Revenue (billion), by Technology Type 2025 & 2033
- Figure 21: Middle East & Africa APAC NDT Equipment Market Revenue Share (%), by Technology Type 2025 & 2033
- Figure 22: Middle East & Africa APAC NDT Equipment Market Revenue (billion), by End-user 2025 & 2033
- Figure 23: Middle East & Africa APAC NDT Equipment Market Revenue Share (%), by End-user 2025 & 2033
- Figure 24: Middle East & Africa APAC NDT Equipment Market Revenue (billion), by Country 2025 & 2033
- Figure 25: Middle East & Africa APAC NDT Equipment Market Revenue Share (%), by Country 2025 & 2033
- Figure 26: Asia Pacific APAC NDT Equipment Market Revenue (billion), by Technology Type 2025 & 2033
- Figure 27: Asia Pacific APAC NDT Equipment Market Revenue Share (%), by Technology Type 2025 & 2033
- Figure 28: Asia Pacific APAC NDT Equipment Market Revenue (billion), by End-user 2025 & 2033
- Figure 29: Asia Pacific APAC NDT Equipment Market Revenue Share (%), by End-user 2025 & 2033
- Figure 30: Asia Pacific APAC NDT Equipment Market Revenue (billion), by Country 2025 & 2033
- Figure 31: Asia Pacific APAC NDT Equipment Market Revenue Share (%), by Country 2025 & 2033
List of Tables
- Table 1: Global APAC NDT Equipment Market Revenue billion Forecast, by Technology Type 2020 & 2033
- Table 2: Global APAC NDT Equipment Market Revenue billion Forecast, by End-user 2020 & 2033
- Table 3: Global APAC NDT Equipment Market Revenue billion Forecast, by Region 2020 & 2033
- Table 4: Global APAC NDT Equipment Market Revenue billion Forecast, by Technology Type 2020 & 2033
- Table 5: Global APAC NDT Equipment Market Revenue billion Forecast, by End-user 2020 & 2033
- Table 6: Global APAC NDT Equipment Market Revenue billion Forecast, by Country 2020 & 2033
- Table 7: United States APAC NDT Equipment Market Revenue (billion) Forecast, by Application 2020 & 2033
- Table 8: Canada APAC NDT Equipment Market Revenue (billion) Forecast, by Application 2020 & 2033
- Table 9: Mexico APAC NDT Equipment Market Revenue (billion) Forecast, by Application 2020 & 2033
- Table 10: Global APAC NDT Equipment Market Revenue billion Forecast, by Technology Type 2020 & 2033
- Table 11: Global APAC NDT Equipment Market Revenue billion Forecast, by End-user 2020 & 2033
- Table 12: Global APAC NDT Equipment Market Revenue billion Forecast, by Country 2020 & 2033
- Table 13: Brazil APAC NDT Equipment Market Revenue (billion) Forecast, by Application 2020 & 2033
- Table 14: Argentina APAC NDT Equipment Market Revenue (billion) Forecast, by Application 2020 & 2033
- Table 15: Rest of South America APAC NDT Equipment Market Revenue (billion) Forecast, by Application 2020 & 2033
- Table 16: Global APAC NDT Equipment Market Revenue billion Forecast, by Technology Type 2020 & 2033
- Table 17: Global APAC NDT Equipment Market Revenue billion Forecast, by End-user 2020 & 2033
- Table 18: Global APAC NDT Equipment Market Revenue billion Forecast, by Country 2020 & 2033
- Table 19: United Kingdom APAC NDT Equipment Market Revenue (billion) Forecast, by Application 2020 & 2033
- Table 20: Germany APAC NDT Equipment Market Revenue (billion) Forecast, by Application 2020 & 2033
- Table 21: France APAC NDT Equipment Market Revenue (billion) Forecast, by Application 2020 & 2033
- Table 22: Italy APAC NDT Equipment Market Revenue (billion) Forecast, by Application 2020 & 2033
- Table 23: Spain APAC NDT Equipment Market Revenue (billion) Forecast, by Application 2020 & 2033
- Table 24: Russia APAC NDT Equipment Market Revenue (billion) Forecast, by Application 2020 & 2033
- Table 25: Benelux APAC NDT Equipment Market Revenue (billion) Forecast, by Application 2020 & 2033
- Table 26: Nordics APAC NDT Equipment Market Revenue (billion) Forecast, by Application 2020 & 2033
- Table 27: Rest of Europe APAC NDT Equipment Market Revenue (billion) Forecast, by Application 2020 & 2033
- Table 28: Global APAC NDT Equipment Market Revenue billion Forecast, by Technology Type 2020 & 2033
- Table 29: Global APAC NDT Equipment Market Revenue billion Forecast, by End-user 2020 & 2033
- Table 30: Global APAC NDT Equipment Market Revenue billion Forecast, by Country 2020 & 2033
- Table 31: Turkey APAC NDT Equipment Market Revenue (billion) Forecast, by Application 2020 & 2033
- Table 32: Israel APAC NDT Equipment Market Revenue (billion) Forecast, by Application 2020 & 2033
- Table 33: GCC APAC NDT Equipment Market Revenue (billion) Forecast, by Application 2020 & 2033
- Table 34: North Africa APAC NDT Equipment Market Revenue (billion) Forecast, by Application 2020 & 2033
- Table 35: South Africa APAC NDT Equipment Market Revenue (billion) Forecast, by Application 2020 & 2033
- Table 36: Rest of Middle East & Africa APAC NDT Equipment Market Revenue (billion) Forecast, by Application 2020 & 2033
- Table 37: Global APAC NDT Equipment Market Revenue billion Forecast, by Technology Type 2020 & 2033
- Table 38: Global APAC NDT Equipment Market Revenue billion Forecast, by End-user 2020 & 2033
- Table 39: Global APAC NDT Equipment Market Revenue billion Forecast, by Country 2020 & 2033
- Table 40: China APAC NDT Equipment Market Revenue (billion) Forecast, by Application 2020 & 2033
- Table 41: India APAC NDT Equipment Market Revenue (billion) Forecast, by Application 2020 & 2033
- Table 42: Japan APAC NDT Equipment Market Revenue (billion) Forecast, by Application 2020 & 2033
- Table 43: South Korea APAC NDT Equipment Market Revenue (billion) Forecast, by Application 2020 & 2033
- Table 44: ASEAN APAC NDT Equipment Market Revenue (billion) Forecast, by Application 2020 & 2033
- Table 45: Oceania APAC NDT Equipment Market Revenue (billion) Forecast, by Application 2020 & 2033
- Table 46: Rest of Asia Pacific APAC NDT Equipment Market Revenue (billion) Forecast, by Application 2020 & 2033
Frequently Asked Questions
1. What is the projected Compound Annual Growth Rate (CAGR) of the APAC NDT Equipment Market?
The projected CAGR is approximately 7.23%.
2. Which companies are prominent players in the APAC NDT Equipment Market?
Key companies in the market include Acuren Inspection Inc (Rockwood Service Corporation), Intertek Group Plc, MISTRAS Group, TEAM Inc, TÜV Rhineland AG, Zetec Inc *List Not Exhaustive, SGS Group, Bureau Veritas S A, Nikon Metrology NV, Fujifilm Corporation, Olympus Corporation, Magnaflux Corp, NCS Testing Technology Co Limited, GE Measurement and Control, Applus Services S A, YXLON International Gmbh ( COMET Group).
3. What are the main segments of the APAC NDT Equipment Market?
The market segments include Technology Type, End-user.
4. Can you provide details about the market size?
The market size is estimated to be USD 5 billion as of 2022.
5. What are some drivers contributing to market growth?
Stringent safety regulations and growth in inspection services industry expected to drive adoption; Growing demand from the construction industry.
6. What are the notable trends driving market growth?
Stringent Regulations Mandating Safety.
7. Are there any restraints impacting market growth?
High replacement rate remains a key concern followed by reluctance to adopt new technologies in emerging regions.
8. Can you provide examples of recent developments in the market?
APRIL 2021- Nikon Corporation launched the Lasermeister 102A, a new optical processing system capable of titanium alloy additive manufacturing. The Lasermeister series uses a high-precision laser to perform a variety of metal processing tasks, including additive manufacturing like a 3D printer and laser marking and welding.
9. What pricing options are available for accessing the report?
Pricing options include single-user, multi-user, and enterprise licenses priced at USD 4750, USD 4950, and USD 6800 respectively.
10. Is the market size provided in terms of value or volume?
The market size is provided in terms of value, measured in billion.
11. Are there any specific market keywords associated with the report?
Yes, the market keyword associated with the report is "APAC NDT Equipment Market," which aids in identifying and referencing the specific market segment covered.
12. How do I determine which pricing option suits my needs best?
The pricing options vary based on user requirements and access needs. Individual users may opt for single-user licenses, while businesses requiring broader access may choose multi-user or enterprise licenses for cost-effective access to the report.
13. Are there any additional resources or data provided in the APAC NDT Equipment Market report?
While the report offers comprehensive insights, it's advisable to review the specific contents or supplementary materials provided to ascertain if additional resources or data are available.
14. How can I stay updated on further developments or reports in the APAC NDT Equipment Market?
To stay informed about further developments, trends, and reports in the APAC NDT Equipment Market, consider subscribing to industry newsletters, following relevant companies and organizations, or regularly checking reputable industry news sources and publications.
Methodology
Step 1 - Identification of Relevant Samples Size from Population Database


Step 2 - Approaches for Defining Global Market Size (Value, Volume* & Price*)

Note*: In applicable scenarios
Step 3 - Data Sources
Primary Research
- Web Analytics
- Survey Reports
- Research Institute
- Latest Research Reports
- Opinion Leaders
Secondary Research
- Annual Reports
- White Paper
- Latest Press Release
- Industry Association
- Paid Database
- Investor Presentations

Step 4 - Data Triangulation
Involves using different sources of information in order to increase the validity of a study
These sources are likely to be stakeholders in a program - participants, other researchers, program staff, other community members, and so on.
Then we put all data in single framework & apply various statistical tools to find out the dynamic on the market.
During the analysis stage, feedback from the stakeholder groups would be compared to determine areas of agreement as well as areas of divergence