
Key Insights
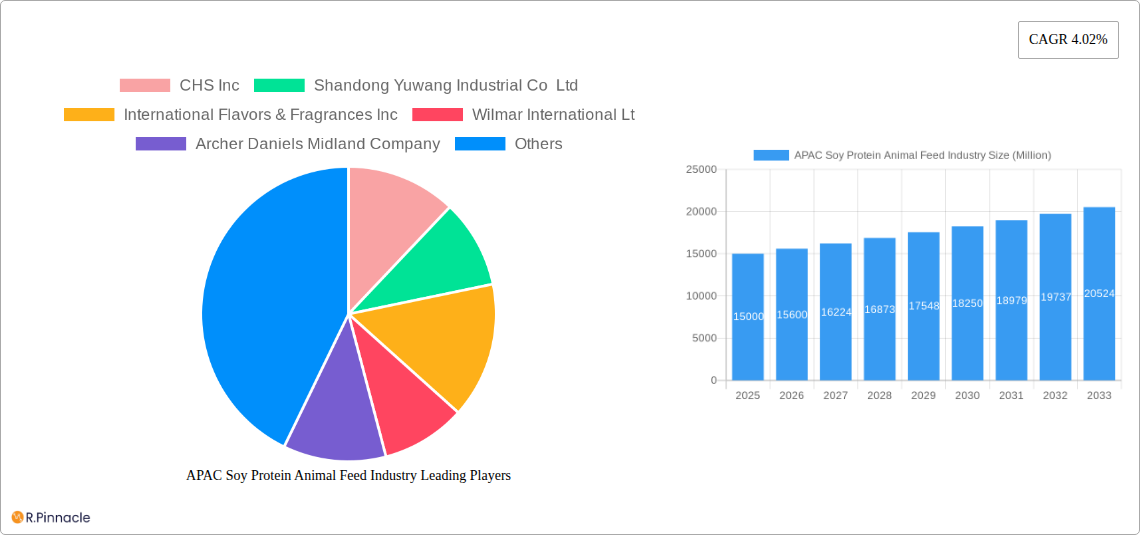
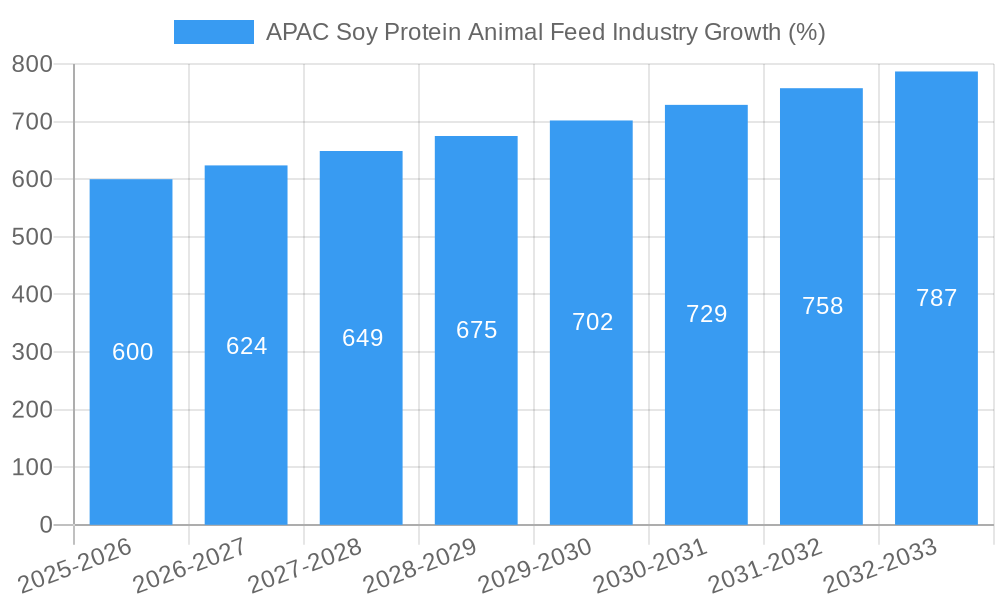
The Asia-Pacific (APAC) soy protein animal feed industry is experiencing robust growth, driven by increasing demand for animal protein, rising consumer incomes leading to higher meat consumption, and the growing awareness of soy protein's nutritional benefits for livestock. The region's large and expanding livestock populations, particularly in countries like China, India, and Vietnam, fuel this demand. Furthermore, the industry benefits from soy protein's cost-effectiveness compared to other protein sources, making it a viable and attractive option for feed manufacturers. The market is segmented by form (concentrates, isolates, textured/hydrolyzed), end-user (animal feed, food and beverages, sports/performance nutrition), and country, reflecting the diverse applications and regional variations in consumption patterns. While factors such as fluctuating soy prices and potential environmental concerns related to soy production pose challenges, the overall trajectory indicates sustained growth, with a projected Compound Annual Growth Rate (CAGR) of 4.02% from 2025 to 2033. This positive outlook is further enhanced by technological advancements in soy protein processing, leading to improved product quality and efficiency.
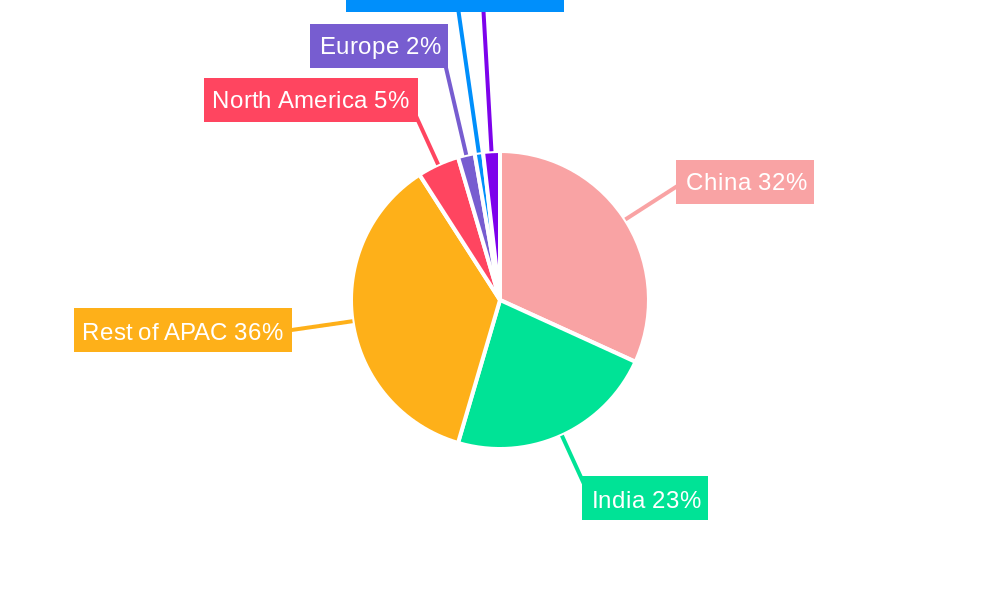
The growth is not uniform across all APAC nations. China and India, due to their massive livestock sectors and expanding middle classes, are expected to dominate the market share. Countries like Vietnam and Indonesia are also showing significant potential, fueled by burgeoning poultry and aquaculture industries. The adoption of soy protein isolates and concentrates is increasing due to their higher protein content and improved functionality in feed formulations. Competition among established players like Cargill, ADM, and Bunge is intense, driving innovation and efficiency. However, smaller regional players are emerging, offering specialized products and catering to niche market segments. The future of the APAC soy protein animal feed market appears promising, with continued growth driven by favorable demographic, economic, and technological trends. However, proactive strategies are needed to address challenges related to sustainability and cost management to ensure continued, responsible growth in the sector.
APAC Soy Protein Animal Feed Industry Report: 2019-2033
This comprehensive report provides an in-depth analysis of the Asia-Pacific (APAC) soy protein animal feed industry, offering invaluable insights for industry professionals, investors, and strategic decision-makers. Covering the period from 2019 to 2033, with a focus on 2025, this report unveils market dynamics, growth drivers, and future opportunities within this rapidly evolving sector. The report meticulously segments the market by country (Australia, China, India, Indonesia, Japan, Malaysia, New Zealand, South Korea, Thailand, Vietnam, and Rest of Asia-Pacific), form (concentrates, isolates, textured/hydrolyzed), and end-user (animal feed, food and beverages, sport/performance nutrition). Expect detailed analysis of key players including CHS Inc, Shandong Yuwang Industrial Co Ltd, International Flavors & Fragrances Inc, Wilmar International Ltd, Archer Daniels Midland Company, Bunge Limited, Fuji Oil Group, Kerry Group PLC, Foodchem International Corporation, and Cargill Incorporated. Discover actionable intelligence to navigate the complexities of this dynamic market and capitalize on emerging trends.
APAC Soy Protein Animal Feed Industry Market Structure & Innovation Trends
The APAC soy protein animal feed market exhibits a moderately concentrated structure, with a few major players holding significant market share. While precise figures are proprietary, companies like Cargill and ADM likely command substantial portions, with regional players holding significant shares within their respective countries. Market concentration is influenced by factors such as economies of scale in production and distribution, as well as access to raw materials. Innovation within this segment is driven by demand for sustainable and high-protein animal feed, leading to the development of novel soy protein formulations. Regulatory frameworks related to food safety and labeling significantly impact market players. Competition from alternative protein sources like insect protein and single-cell protein poses a moderate competitive pressure, yet soy protein maintains its dominance due to cost-effectiveness and established supply chains. M&A activity has been relatively moderate in recent years, with deal values averaging around xx Million in the past five years. These activities mainly focus on expanding geographical reach and integrating upstream and downstream operations.
- Market Share: Cargill and ADM hold significant shares, with regional players holding substantial market shares within their respective countries.
- Innovation Drivers: Demand for sustainable and high-protein animal feed, cost efficiency, and new formulation development
- M&A Activity: Moderate activity in recent years, focusing on geographical expansion and supply chain integration. Average deal value: xx Million.
APAC Soy Protein Animal Feed Industry Market Dynamics & Trends
The APAC soy protein animal feed market is experiencing robust growth, driven by a rising demand for animal protein and increasing consumer awareness of the health benefits of plant-based protein. The market’s Compound Annual Growth Rate (CAGR) during the historical period (2019-2024) was approximately xx%, and is projected to reach xx% during the forecast period (2025-2033). This growth is fueled by several factors: the expanding livestock industry, particularly in rapidly developing economies like China and India; growing adoption of soy protein as a sustainable and cost-effective alternative to traditional animal feed ingredients; and continuous advancements in soy protein processing technology. Technological advancements are streamlining production and improving the quality and functionality of soy protein products. However, fluctuating soy prices and concerns about genetically modified organisms (GMOs) present ongoing challenges. Market penetration of soy protein in animal feed is high in certain regions, but opportunities exist for expansion into underpenetrated markets. Competitive dynamics are characterized by fierce competition among both international and domestic players, driving innovation and price optimization.
Dominant Regions & Segments in APAC Soy Protein Animal Feed Industry
- Dominant Region: China, due to its massive livestock industry and growing demand for animal protein.
- Dominant Country: China, followed by India, due to their large and expanding livestock populations and relatively high consumption of meat.
- Dominant Segment (Form): Concentrates, owing to their cost-effectiveness and widespread application across animal feed formulations.
- Dominant Segment (End-User): Animal Feed, due to its significant application in poultry, swine, and aquaculture feed.
Key Drivers:
- China: Rapid economic growth, expanding livestock sector, and government support for agricultural development.
- India: Growing middle class, increased meat consumption, and government initiatives to boost livestock production.
- Other Countries: Varying levels of economic development, dietary habits, and government policies influence market size and growth.
APAC Soy Protein Animal Feed Industry Product Innovations
Recent years have witnessed significant advancements in soy protein processing technologies, leading to the development of novel products with improved functionality and nutritional profiles. The introduction of soy protein concentrates, isolates, and textured soy protein has expanded the application range, catering to diverse animal feed formulations. Companies are focusing on enhancing protein solubility, digestibility, and amino acid profiles to optimize nutritional value for animals. Technological innovations such as extrusion and fermentation are being applied to enhance the texture and taste of soy protein, increasing its palatability. This focus on improving product functionality, alongside cost optimization, is key to maintaining soy protein's competitiveness within the APAC animal feed market.
Report Scope & Segmentation Analysis
This report segments the APAC soy protein animal feed market based on country, form, and end-user. Market size and growth projections are provided for each segment, considering factors such as economic growth, livestock production trends, and consumer preferences. Competitive dynamics are analyzed for each segment, highlighting key players, their market share, and strategic initiatives. The report's scope encompasses historical data (2019-2024), current estimations (2025), and future forecasts (2025-2033), offering a comprehensive perspective on market evolution.
- By Country: Individual country analyses consider specific market dynamics, including regulatory frameworks, consumer behavior, and competition.
- By Form: Analysis of concentrates, isolates, and textured/hydrolyzed soy protein delves into their respective applications and market shares.
- By End-User: Examines the utilization of soy protein in animal feed, food and beverages, and sports nutrition, highlighting growth potential within each segment.
Key Drivers of APAC Soy Protein Animal Feed Industry Growth
Several factors are driving the growth of the APAC soy protein animal feed industry. The increasing demand for animal protein, fueled by rising incomes and changing dietary habits, is a major driver. Technological advancements in soy protein processing are enhancing product quality and expanding applications. Favorable government policies and incentives to promote sustainable agriculture are also contributing to growth. Moreover, the cost-effectiveness of soy protein compared to other protein sources makes it an attractive option for feed manufacturers.
Challenges in the APAC Soy Protein Animal Feed Industry Sector
The APAC soy protein animal feed industry faces several challenges. Fluctuations in soy prices due to weather patterns and global trade dynamics impact profitability. Concerns about genetically modified organisms (GMOs) and their impact on consumer perception create obstacles for some manufacturers. Strict regulatory requirements related to food safety and labeling add to the operational complexities. Lastly, competition from alternative protein sources and sustainability concerns represent ongoing hurdles.
Emerging Opportunities in APAC Soy Protein Animal Feed Industry
The APAC soy protein animal feed industry presents several exciting opportunities. Growing demand for sustainable and environmentally friendly feed options creates space for companies committed to responsible sourcing and production. Innovation in soy protein processing can lead to the development of products with enhanced nutritional value and functionalities. Expansion into niche markets, such as specialized animal feeds for aquaculture and companion animals, presents substantial potential. Moreover, tapping into the growing demand for plant-based protein sources within the overall food industry offers broader opportunities beyond animal feed.
Leading Players in the APAC Soy Protein Animal Feed Industry Market
- CHS Inc
- Shandong Yuwang Industrial Co Ltd
- International Flavors & Fragrances Inc
- Wilmar International Ltd
- Archer Daniels Midland Company
- Bunge Limited
- Fuji Oil Group
- Kerry Group PLC
- Foodchem International Corporation
- Cargill Incorporated
Key Developments in APAC Soy Protein Animal Feed Industry
- July 2020: DuPont Nutrition & Biosciences (a subsidiary of IFF) launched the Danisco Planit range, expanding its offerings of plant-based ingredients, including soy protein. This significantly broadens the availability of high-quality soy protein for various applications.
- March 2019: DuPont launched SUPRO soy-based protein nuggets, expanding its plant protein portfolio with a focus on high protein content and unique textures within the animal feed segment.
- January 2019: Fuji Oil Holdings Inc. invested JPY 2.4 billion in a new soy processing plant, increasing production capacity and enabling expansion into new markets.
Future Outlook for APAC Soy Protein Animal Feed Industry Market
The APAC soy protein animal feed market is poised for continued growth, driven by several factors including rising demand for animal protein, technological innovations, and increasing consumer awareness of sustainability. Strategic partnerships, investments in research and development, and expansion into new markets will shape the competitive landscape. The market's future growth trajectory will be significantly influenced by factors such as fluctuating commodity prices and regulatory developments. However, the overall outlook remains positive, presenting significant opportunities for industry players to capitalize on evolving market demands.
APAC Soy Protein Animal Feed Industry Segmentation
-
1. Form
- 1.1. Concentrates
- 1.2. Isolates
- 1.3. Textured/Hydrolyzed
-
2. End User
- 2.1. Animal Feed
-
2.2. Food and Beverages
-
2.2.1. By Sub End User
- 2.2.1.1. Bakery
- 2.2.1.2. Breakfast Cereals
- 2.2.1.3. Condiments/Sauces
- 2.2.1.4. Dairy and Dairy Alternative Products
- 2.2.1.5. Meat/Poultry/Seafood and Meat Alternative Products
- 2.2.1.6. RTE/RTC Food Products
- 2.2.1.7. Snacks
-
2.2.1. By Sub End User
- 2.3. Personal Care and Cosmetics
-
2.4. Supplements
- 2.4.1. Baby Food and Infant Formula
- 2.4.2. Elderly Nutrition and Medical Nutrition
- 2.4.3. Sport/Performance Nutrition
APAC Soy Protein Animal Feed Industry Segmentation By Geography
-
1. North America
- 1.1. United States
- 1.2. Canada
- 1.3. Mexico
-
2. South America
- 2.1. Brazil
- 2.2. Argentina
- 2.3. Rest of South America
-
3. Europe
- 3.1. United Kingdom
- 3.2. Germany
- 3.3. France
- 3.4. Italy
- 3.5. Spain
- 3.6. Russia
- 3.7. Benelux
- 3.8. Nordics
- 3.9. Rest of Europe
-
4. Middle East & Africa
- 4.1. Turkey
- 4.2. Israel
- 4.3. GCC
- 4.4. North Africa
- 4.5. South Africa
- 4.6. Rest of Middle East & Africa
-
5. Asia Pacific
- 5.1. China
- 5.2. India
- 5.3. Japan
- 5.4. South Korea
- 5.5. ASEAN
- 5.6. Oceania
- 5.7. Rest of Asia Pacific
APAC Soy Protein Animal Feed Industry REPORT HIGHLIGHTS
| Aspects | Details |
|---|---|
| Study Period | 2019-2033 |
| Base Year | 2024 |
| Estimated Year | 2025 |
| Forecast Period | 2025-2033 |
| Historical Period | 2019-2024 |
| Growth Rate | CAGR of 4.02% from 2019-2033 |
| Segmentation |
|
Table of Contents
- 1. Introduction
- 1.1. Research Scope
- 1.2. Market Segmentation
- 1.3. Research Methodology
- 1.4. Definitions and Assumptions
- 2. Executive Summary
- 2.1. Introduction
- 3. Market Dynamics
- 3.1. Introduction
- 3.2. Market Drivers
- 3.2.1. Increasing awareness towards fitness among consumers; Demand for convenient fortified foods
- 3.3. Market Restrains
- 3.3.1. Prevalence of allergen intolerance among the consumers
- 3.4. Market Trends
- 3.4.1. OTHER KEY INDUSTRY TRENDS COVERED IN THE REPORT
- 4. Market Factor Analysis
- 4.1. Porters Five Forces
- 4.2. Supply/Value Chain
- 4.3. PESTEL analysis
- 4.4. Market Entropy
- 4.5. Patent/Trademark Analysis
- 5. Global APAC Soy Protein Animal Feed Industry Analysis, Insights and Forecast, 2019-2031
- 5.1. Market Analysis, Insights and Forecast - by Form
- 5.1.1. Concentrates
- 5.1.2. Isolates
- 5.1.3. Textured/Hydrolyzed
- 5.2. Market Analysis, Insights and Forecast - by End User
- 5.2.1. Animal Feed
- 5.2.2. Food and Beverages
- 5.2.2.1. By Sub End User
- 5.2.2.1.1. Bakery
- 5.2.2.1.2. Breakfast Cereals
- 5.2.2.1.3. Condiments/Sauces
- 5.2.2.1.4. Dairy and Dairy Alternative Products
- 5.2.2.1.5. Meat/Poultry/Seafood and Meat Alternative Products
- 5.2.2.1.6. RTE/RTC Food Products
- 5.2.2.1.7. Snacks
- 5.2.2.1. By Sub End User
- 5.2.3. Personal Care and Cosmetics
- 5.2.4. Supplements
- 5.2.4.1. Baby Food and Infant Formula
- 5.2.4.2. Elderly Nutrition and Medical Nutrition
- 5.2.4.3. Sport/Performance Nutrition
- 5.3. Market Analysis, Insights and Forecast - by Region
- 5.3.1. North America
- 5.3.2. South America
- 5.3.3. Europe
- 5.3.4. Middle East & Africa
- 5.3.5. Asia Pacific
- 5.1. Market Analysis, Insights and Forecast - by Form
- 6. North America APAC Soy Protein Animal Feed Industry Analysis, Insights and Forecast, 2019-2031
- 6.1. Market Analysis, Insights and Forecast - by Form
- 6.1.1. Concentrates
- 6.1.2. Isolates
- 6.1.3. Textured/Hydrolyzed
- 6.2. Market Analysis, Insights and Forecast - by End User
- 6.2.1. Animal Feed
- 6.2.2. Food and Beverages
- 6.2.2.1. By Sub End User
- 6.2.2.1.1. Bakery
- 6.2.2.1.2. Breakfast Cereals
- 6.2.2.1.3. Condiments/Sauces
- 6.2.2.1.4. Dairy and Dairy Alternative Products
- 6.2.2.1.5. Meat/Poultry/Seafood and Meat Alternative Products
- 6.2.2.1.6. RTE/RTC Food Products
- 6.2.2.1.7. Snacks
- 6.2.2.1. By Sub End User
- 6.2.3. Personal Care and Cosmetics
- 6.2.4. Supplements
- 6.2.4.1. Baby Food and Infant Formula
- 6.2.4.2. Elderly Nutrition and Medical Nutrition
- 6.2.4.3. Sport/Performance Nutrition
- 6.1. Market Analysis, Insights and Forecast - by Form
- 7. South America APAC Soy Protein Animal Feed Industry Analysis, Insights and Forecast, 2019-2031
- 7.1. Market Analysis, Insights and Forecast - by Form
- 7.1.1. Concentrates
- 7.1.2. Isolates
- 7.1.3. Textured/Hydrolyzed
- 7.2. Market Analysis, Insights and Forecast - by End User
- 7.2.1. Animal Feed
- 7.2.2. Food and Beverages
- 7.2.2.1. By Sub End User
- 7.2.2.1.1. Bakery
- 7.2.2.1.2. Breakfast Cereals
- 7.2.2.1.3. Condiments/Sauces
- 7.2.2.1.4. Dairy and Dairy Alternative Products
- 7.2.2.1.5. Meat/Poultry/Seafood and Meat Alternative Products
- 7.2.2.1.6. RTE/RTC Food Products
- 7.2.2.1.7. Snacks
- 7.2.2.1. By Sub End User
- 7.2.3. Personal Care and Cosmetics
- 7.2.4. Supplements
- 7.2.4.1. Baby Food and Infant Formula
- 7.2.4.2. Elderly Nutrition and Medical Nutrition
- 7.2.4.3. Sport/Performance Nutrition
- 7.1. Market Analysis, Insights and Forecast - by Form
- 8. Europe APAC Soy Protein Animal Feed Industry Analysis, Insights and Forecast, 2019-2031
- 8.1. Market Analysis, Insights and Forecast - by Form
- 8.1.1. Concentrates
- 8.1.2. Isolates
- 8.1.3. Textured/Hydrolyzed
- 8.2. Market Analysis, Insights and Forecast - by End User
- 8.2.1. Animal Feed
- 8.2.2. Food and Beverages
- 8.2.2.1. By Sub End User
- 8.2.2.1.1. Bakery
- 8.2.2.1.2. Breakfast Cereals
- 8.2.2.1.3. Condiments/Sauces
- 8.2.2.1.4. Dairy and Dairy Alternative Products
- 8.2.2.1.5. Meat/Poultry/Seafood and Meat Alternative Products
- 8.2.2.1.6. RTE/RTC Food Products
- 8.2.2.1.7. Snacks
- 8.2.2.1. By Sub End User
- 8.2.3. Personal Care and Cosmetics
- 8.2.4. Supplements
- 8.2.4.1. Baby Food and Infant Formula
- 8.2.4.2. Elderly Nutrition and Medical Nutrition
- 8.2.4.3. Sport/Performance Nutrition
- 8.1. Market Analysis, Insights and Forecast - by Form
- 9. Middle East & Africa APAC Soy Protein Animal Feed Industry Analysis, Insights and Forecast, 2019-2031
- 9.1. Market Analysis, Insights and Forecast - by Form
- 9.1.1. Concentrates
- 9.1.2. Isolates
- 9.1.3. Textured/Hydrolyzed
- 9.2. Market Analysis, Insights and Forecast - by End User
- 9.2.1. Animal Feed
- 9.2.2. Food and Beverages
- 9.2.2.1. By Sub End User
- 9.2.2.1.1. Bakery
- 9.2.2.1.2. Breakfast Cereals
- 9.2.2.1.3. Condiments/Sauces
- 9.2.2.1.4. Dairy and Dairy Alternative Products
- 9.2.2.1.5. Meat/Poultry/Seafood and Meat Alternative Products
- 9.2.2.1.6. RTE/RTC Food Products
- 9.2.2.1.7. Snacks
- 9.2.2.1. By Sub End User
- 9.2.3. Personal Care and Cosmetics
- 9.2.4. Supplements
- 9.2.4.1. Baby Food and Infant Formula
- 9.2.4.2. Elderly Nutrition and Medical Nutrition
- 9.2.4.3. Sport/Performance Nutrition
- 9.1. Market Analysis, Insights and Forecast - by Form
- 10. Asia Pacific APAC Soy Protein Animal Feed Industry Analysis, Insights and Forecast, 2019-2031
- 10.1. Market Analysis, Insights and Forecast - by Form
- 10.1.1. Concentrates
- 10.1.2. Isolates
- 10.1.3. Textured/Hydrolyzed
- 10.2. Market Analysis, Insights and Forecast - by End User
- 10.2.1. Animal Feed
- 10.2.2. Food and Beverages
- 10.2.2.1. By Sub End User
- 10.2.2.1.1. Bakery
- 10.2.2.1.2. Breakfast Cereals
- 10.2.2.1.3. Condiments/Sauces
- 10.2.2.1.4. Dairy and Dairy Alternative Products
- 10.2.2.1.5. Meat/Poultry/Seafood and Meat Alternative Products
- 10.2.2.1.6. RTE/RTC Food Products
- 10.2.2.1.7. Snacks
- 10.2.2.1. By Sub End User
- 10.2.3. Personal Care and Cosmetics
- 10.2.4. Supplements
- 10.2.4.1. Baby Food and Infant Formula
- 10.2.4.2. Elderly Nutrition and Medical Nutrition
- 10.2.4.3. Sport/Performance Nutrition
- 10.1. Market Analysis, Insights and Forecast - by Form
- 11. North America APAC Soy Protein Animal Feed Industry Analysis, Insights and Forecast, 2019-2031
- 11.1. Market Analysis, Insights and Forecast - By Country/Sub-region
- 11.1.1 United States
- 11.1.2 Canada
- 11.1.3 Mexico
- 11.1.4 Rest of North America
- 12. Europe APAC Soy Protein Animal Feed Industry Analysis, Insights and Forecast, 2019-2031
- 12.1. Market Analysis, Insights and Forecast - By Country/Sub-region
- 12.1.1 Germany
- 12.1.2 United Kingdom
- 12.1.3 France
- 12.1.4 Russia
- 12.1.5 Spain
- 12.1.6 Italy
- 12.1.7 Rest of Europe
- 13. Asia Pacific APAC Soy Protein Animal Feed Industry Analysis, Insights and Forecast, 2019-2031
- 13.1. Market Analysis, Insights and Forecast - By Country/Sub-region
- 13.1.1 China
- 13.1.2 Japan
- 13.1.3 India
- 13.1.4 Australia
- 13.1.5 Rest of Asia Pacific
- 14. South America APAC Soy Protein Animal Feed Industry Analysis, Insights and Forecast, 2019-2031
- 14.1. Market Analysis, Insights and Forecast - By Country/Sub-region
- 14.1.1 Brazil
- 14.1.2 Argentina
- 14.1.3 Rest of South America
- 15. Middle East and Africa APAC Soy Protein Animal Feed Industry Analysis, Insights and Forecast, 2019-2031
- 15.1. Market Analysis, Insights and Forecast - By Country/Sub-region
- 15.1.1 United Arab Emirates
- 15.1.2 South Africa
- 15.1.3 Rest of Middle East and Africa
- 16. Competitive Analysis
- 16.1. Global Market Share Analysis 2024
- 16.2. Company Profiles
- 16.2.1 CHS Inc
- 16.2.1.1. Overview
- 16.2.1.2. Products
- 16.2.1.3. SWOT Analysis
- 16.2.1.4. Recent Developments
- 16.2.1.5. Financials (Based on Availability)
- 16.2.2 Shandong Yuwang Industrial Co Ltd
- 16.2.2.1. Overview
- 16.2.2.2. Products
- 16.2.2.3. SWOT Analysis
- 16.2.2.4. Recent Developments
- 16.2.2.5. Financials (Based on Availability)
- 16.2.3 International Flavors & Fragrances Inc
- 16.2.3.1. Overview
- 16.2.3.2. Products
- 16.2.3.3. SWOT Analysis
- 16.2.3.4. Recent Developments
- 16.2.3.5. Financials (Based on Availability)
- 16.2.4 Wilmar International Lt
- 16.2.4.1. Overview
- 16.2.4.2. Products
- 16.2.4.3. SWOT Analysis
- 16.2.4.4. Recent Developments
- 16.2.4.5. Financials (Based on Availability)
- 16.2.5 Archer Daniels Midland Company
- 16.2.5.1. Overview
- 16.2.5.2. Products
- 16.2.5.3. SWOT Analysis
- 16.2.5.4. Recent Developments
- 16.2.5.5. Financials (Based on Availability)
- 16.2.6 Bunge Limited
- 16.2.6.1. Overview
- 16.2.6.2. Products
- 16.2.6.3. SWOT Analysis
- 16.2.6.4. Recent Developments
- 16.2.6.5. Financials (Based on Availability)
- 16.2.7 Fuji Oil Group
- 16.2.7.1. Overview
- 16.2.7.2. Products
- 16.2.7.3. SWOT Analysis
- 16.2.7.4. Recent Developments
- 16.2.7.5. Financials (Based on Availability)
- 16.2.8 Kerry Group PLC
- 16.2.8.1. Overview
- 16.2.8.2. Products
- 16.2.8.3. SWOT Analysis
- 16.2.8.4. Recent Developments
- 16.2.8.5. Financials (Based on Availability)
- 16.2.9 Foodchem International Corporation
- 16.2.9.1. Overview
- 16.2.9.2. Products
- 16.2.9.3. SWOT Analysis
- 16.2.9.4. Recent Developments
- 16.2.9.5. Financials (Based on Availability)
- 16.2.10 Cargill Incorporated
- 16.2.10.1. Overview
- 16.2.10.2. Products
- 16.2.10.3. SWOT Analysis
- 16.2.10.4. Recent Developments
- 16.2.10.5. Financials (Based on Availability)
- 16.2.1 CHS Inc
List of Figures
- Figure 1: Global APAC Soy Protein Animal Feed Industry Revenue Breakdown (Million, %) by Region 2024 & 2032
- Figure 2: Global APAC Soy Protein Animal Feed Industry Volume Breakdown (K Tons, %) by Region 2024 & 2032
- Figure 3: North America APAC Soy Protein Animal Feed Industry Revenue (Million), by Country 2024 & 2032
- Figure 4: North America APAC Soy Protein Animal Feed Industry Volume (K Tons), by Country 2024 & 2032
- Figure 5: North America APAC Soy Protein Animal Feed Industry Revenue Share (%), by Country 2024 & 2032
- Figure 6: North America APAC Soy Protein Animal Feed Industry Volume Share (%), by Country 2024 & 2032
- Figure 7: Europe APAC Soy Protein Animal Feed Industry Revenue (Million), by Country 2024 & 2032
- Figure 8: Europe APAC Soy Protein Animal Feed Industry Volume (K Tons), by Country 2024 & 2032
- Figure 9: Europe APAC Soy Protein Animal Feed Industry Revenue Share (%), by Country 2024 & 2032
- Figure 10: Europe APAC Soy Protein Animal Feed Industry Volume Share (%), by Country 2024 & 2032
- Figure 11: Asia Pacific APAC Soy Protein Animal Feed Industry Revenue (Million), by Country 2024 & 2032
- Figure 12: Asia Pacific APAC Soy Protein Animal Feed Industry Volume (K Tons), by Country 2024 & 2032
- Figure 13: Asia Pacific APAC Soy Protein Animal Feed Industry Revenue Share (%), by Country 2024 & 2032
- Figure 14: Asia Pacific APAC Soy Protein Animal Feed Industry Volume Share (%), by Country 2024 & 2032
- Figure 15: South America APAC Soy Protein Animal Feed Industry Revenue (Million), by Country 2024 & 2032
- Figure 16: South America APAC Soy Protein Animal Feed Industry Volume (K Tons), by Country 2024 & 2032
- Figure 17: South America APAC Soy Protein Animal Feed Industry Revenue Share (%), by Country 2024 & 2032
- Figure 18: South America APAC Soy Protein Animal Feed Industry Volume Share (%), by Country 2024 & 2032
- Figure 19: Middle East and Africa APAC Soy Protein Animal Feed Industry Revenue (Million), by Country 2024 & 2032
- Figure 20: Middle East and Africa APAC Soy Protein Animal Feed Industry Volume (K Tons), by Country 2024 & 2032
- Figure 21: Middle East and Africa APAC Soy Protein Animal Feed Industry Revenue Share (%), by Country 2024 & 2032
- Figure 22: Middle East and Africa APAC Soy Protein Animal Feed Industry Volume Share (%), by Country 2024 & 2032
- Figure 23: North America APAC Soy Protein Animal Feed Industry Revenue (Million), by Form 2024 & 2032
- Figure 24: North America APAC Soy Protein Animal Feed Industry Volume (K Tons), by Form 2024 & 2032
- Figure 25: North America APAC Soy Protein Animal Feed Industry Revenue Share (%), by Form 2024 & 2032
- Figure 26: North America APAC Soy Protein Animal Feed Industry Volume Share (%), by Form 2024 & 2032
- Figure 27: North America APAC Soy Protein Animal Feed Industry Revenue (Million), by End User 2024 & 2032
- Figure 28: North America APAC Soy Protein Animal Feed Industry Volume (K Tons), by End User 2024 & 2032
- Figure 29: North America APAC Soy Protein Animal Feed Industry Revenue Share (%), by End User 2024 & 2032
- Figure 30: North America APAC Soy Protein Animal Feed Industry Volume Share (%), by End User 2024 & 2032
- Figure 31: North America APAC Soy Protein Animal Feed Industry Revenue (Million), by Country 2024 & 2032
- Figure 32: North America APAC Soy Protein Animal Feed Industry Volume (K Tons), by Country 2024 & 2032
- Figure 33: North America APAC Soy Protein Animal Feed Industry Revenue Share (%), by Country 2024 & 2032
- Figure 34: North America APAC Soy Protein Animal Feed Industry Volume Share (%), by Country 2024 & 2032
- Figure 35: South America APAC Soy Protein Animal Feed Industry Revenue (Million), by Form 2024 & 2032
- Figure 36: South America APAC Soy Protein Animal Feed Industry Volume (K Tons), by Form 2024 & 2032
- Figure 37: South America APAC Soy Protein Animal Feed Industry Revenue Share (%), by Form 2024 & 2032
- Figure 38: South America APAC Soy Protein Animal Feed Industry Volume Share (%), by Form 2024 & 2032
- Figure 39: South America APAC Soy Protein Animal Feed Industry Revenue (Million), by End User 2024 & 2032
- Figure 40: South America APAC Soy Protein Animal Feed Industry Volume (K Tons), by End User 2024 & 2032
- Figure 41: South America APAC Soy Protein Animal Feed Industry Revenue Share (%), by End User 2024 & 2032
- Figure 42: South America APAC Soy Protein Animal Feed Industry Volume Share (%), by End User 2024 & 2032
- Figure 43: South America APAC Soy Protein Animal Feed Industry Revenue (Million), by Country 2024 & 2032
- Figure 44: South America APAC Soy Protein Animal Feed Industry Volume (K Tons), by Country 2024 & 2032
- Figure 45: South America APAC Soy Protein Animal Feed Industry Revenue Share (%), by Country 2024 & 2032
- Figure 46: South America APAC Soy Protein Animal Feed Industry Volume Share (%), by Country 2024 & 2032
- Figure 47: Europe APAC Soy Protein Animal Feed Industry Revenue (Million), by Form 2024 & 2032
- Figure 48: Europe APAC Soy Protein Animal Feed Industry Volume (K Tons), by Form 2024 & 2032
- Figure 49: Europe APAC Soy Protein Animal Feed Industry Revenue Share (%), by Form 2024 & 2032
- Figure 50: Europe APAC Soy Protein Animal Feed Industry Volume Share (%), by Form 2024 & 2032
- Figure 51: Europe APAC Soy Protein Animal Feed Industry Revenue (Million), by End User 2024 & 2032
- Figure 52: Europe APAC Soy Protein Animal Feed Industry Volume (K Tons), by End User 2024 & 2032
- Figure 53: Europe APAC Soy Protein Animal Feed Industry Revenue Share (%), by End User 2024 & 2032
- Figure 54: Europe APAC Soy Protein Animal Feed Industry Volume Share (%), by End User 2024 & 2032
- Figure 55: Europe APAC Soy Protein Animal Feed Industry Revenue (Million), by Country 2024 & 2032
- Figure 56: Europe APAC Soy Protein Animal Feed Industry Volume (K Tons), by Country 2024 & 2032
- Figure 57: Europe APAC Soy Protein Animal Feed Industry Revenue Share (%), by Country 2024 & 2032
- Figure 58: Europe APAC Soy Protein Animal Feed Industry Volume Share (%), by Country 2024 & 2032
- Figure 59: Middle East & Africa APAC Soy Protein Animal Feed Industry Revenue (Million), by Form 2024 & 2032
- Figure 60: Middle East & Africa APAC Soy Protein Animal Feed Industry Volume (K Tons), by Form 2024 & 2032
- Figure 61: Middle East & Africa APAC Soy Protein Animal Feed Industry Revenue Share (%), by Form 2024 & 2032
- Figure 62: Middle East & Africa APAC Soy Protein Animal Feed Industry Volume Share (%), by Form 2024 & 2032
- Figure 63: Middle East & Africa APAC Soy Protein Animal Feed Industry Revenue (Million), by End User 2024 & 2032
- Figure 64: Middle East & Africa APAC Soy Protein Animal Feed Industry Volume (K Tons), by End User 2024 & 2032
- Figure 65: Middle East & Africa APAC Soy Protein Animal Feed Industry Revenue Share (%), by End User 2024 & 2032
- Figure 66: Middle East & Africa APAC Soy Protein Animal Feed Industry Volume Share (%), by End User 2024 & 2032
- Figure 67: Middle East & Africa APAC Soy Protein Animal Feed Industry Revenue (Million), by Country 2024 & 2032
- Figure 68: Middle East & Africa APAC Soy Protein Animal Feed Industry Volume (K Tons), by Country 2024 & 2032
- Figure 69: Middle East & Africa APAC Soy Protein Animal Feed Industry Revenue Share (%), by Country 2024 & 2032
- Figure 70: Middle East & Africa APAC Soy Protein Animal Feed Industry Volume Share (%), by Country 2024 & 2032
- Figure 71: Asia Pacific APAC Soy Protein Animal Feed Industry Revenue (Million), by Form 2024 & 2032
- Figure 72: Asia Pacific APAC Soy Protein Animal Feed Industry Volume (K Tons), by Form 2024 & 2032
- Figure 73: Asia Pacific APAC Soy Protein Animal Feed Industry Revenue Share (%), by Form 2024 & 2032
- Figure 74: Asia Pacific APAC Soy Protein Animal Feed Industry Volume Share (%), by Form 2024 & 2032
- Figure 75: Asia Pacific APAC Soy Protein Animal Feed Industry Revenue (Million), by End User 2024 & 2032
- Figure 76: Asia Pacific APAC Soy Protein Animal Feed Industry Volume (K Tons), by End User 2024 & 2032
- Figure 77: Asia Pacific APAC Soy Protein Animal Feed Industry Revenue Share (%), by End User 2024 & 2032
- Figure 78: Asia Pacific APAC Soy Protein Animal Feed Industry Volume Share (%), by End User 2024 & 2032
- Figure 79: Asia Pacific APAC Soy Protein Animal Feed Industry Revenue (Million), by Country 2024 & 2032
- Figure 80: Asia Pacific APAC Soy Protein Animal Feed Industry Volume (K Tons), by Country 2024 & 2032
- Figure 81: Asia Pacific APAC Soy Protein Animal Feed Industry Revenue Share (%), by Country 2024 & 2032
- Figure 82: Asia Pacific APAC Soy Protein Animal Feed Industry Volume Share (%), by Country 2024 & 2032
List of Tables
- Table 1: Global APAC Soy Protein Animal Feed Industry Revenue Million Forecast, by Region 2019 & 2032
- Table 2: Global APAC Soy Protein Animal Feed Industry Volume K Tons Forecast, by Region 2019 & 2032
- Table 3: Global APAC Soy Protein Animal Feed Industry Revenue Million Forecast, by Form 2019 & 2032
- Table 4: Global APAC Soy Protein Animal Feed Industry Volume K Tons Forecast, by Form 2019 & 2032
- Table 5: Global APAC Soy Protein Animal Feed Industry Revenue Million Forecast, by End User 2019 & 2032
- Table 6: Global APAC Soy Protein Animal Feed Industry Volume K Tons Forecast, by End User 2019 & 2032
- Table 7: Global APAC Soy Protein Animal Feed Industry Revenue Million Forecast, by Region 2019 & 2032
- Table 8: Global APAC Soy Protein Animal Feed Industry Volume K Tons Forecast, by Region 2019 & 2032
- Table 9: Global APAC Soy Protein Animal Feed Industry Revenue Million Forecast, by Country 2019 & 2032
- Table 10: Global APAC Soy Protein Animal Feed Industry Volume K Tons Forecast, by Country 2019 & 2032
- Table 11: United States APAC Soy Protein Animal Feed Industry Revenue (Million) Forecast, by Application 2019 & 2032
- Table 12: United States APAC Soy Protein Animal Feed Industry Volume (K Tons) Forecast, by Application 2019 & 2032
- Table 13: Canada APAC Soy Protein Animal Feed Industry Revenue (Million) Forecast, by Application 2019 & 2032
- Table 14: Canada APAC Soy Protein Animal Feed Industry Volume (K Tons) Forecast, by Application 2019 & 2032
- Table 15: Mexico APAC Soy Protein Animal Feed Industry Revenue (Million) Forecast, by Application 2019 & 2032
- Table 16: Mexico APAC Soy Protein Animal Feed Industry Volume (K Tons) Forecast, by Application 2019 & 2032
- Table 17: Rest of North America APAC Soy Protein Animal Feed Industry Revenue (Million) Forecast, by Application 2019 & 2032
- Table 18: Rest of North America APAC Soy Protein Animal Feed Industry Volume (K Tons) Forecast, by Application 2019 & 2032
- Table 19: Global APAC Soy Protein Animal Feed Industry Revenue Million Forecast, by Country 2019 & 2032
- Table 20: Global APAC Soy Protein Animal Feed Industry Volume K Tons Forecast, by Country 2019 & 2032
- Table 21: Germany APAC Soy Protein Animal Feed Industry Revenue (Million) Forecast, by Application 2019 & 2032
- Table 22: Germany APAC Soy Protein Animal Feed Industry Volume (K Tons) Forecast, by Application 2019 & 2032
- Table 23: United Kingdom APAC Soy Protein Animal Feed Industry Revenue (Million) Forecast, by Application 2019 & 2032
- Table 24: United Kingdom APAC Soy Protein Animal Feed Industry Volume (K Tons) Forecast, by Application 2019 & 2032
- Table 25: France APAC Soy Protein Animal Feed Industry Revenue (Million) Forecast, by Application 2019 & 2032
- Table 26: France APAC Soy Protein Animal Feed Industry Volume (K Tons) Forecast, by Application 2019 & 2032
- Table 27: Russia APAC Soy Protein Animal Feed Industry Revenue (Million) Forecast, by Application 2019 & 2032
- Table 28: Russia APAC Soy Protein Animal Feed Industry Volume (K Tons) Forecast, by Application 2019 & 2032
- Table 29: Spain APAC Soy Protein Animal Feed Industry Revenue (Million) Forecast, by Application 2019 & 2032
- Table 30: Spain APAC Soy Protein Animal Feed Industry Volume (K Tons) Forecast, by Application 2019 & 2032
- Table 31: Italy APAC Soy Protein Animal Feed Industry Revenue (Million) Forecast, by Application 2019 & 2032
- Table 32: Italy APAC Soy Protein Animal Feed Industry Volume (K Tons) Forecast, by Application 2019 & 2032
- Table 33: Rest of Europe APAC Soy Protein Animal Feed Industry Revenue (Million) Forecast, by Application 2019 & 2032
- Table 34: Rest of Europe APAC Soy Protein Animal Feed Industry Volume (K Tons) Forecast, by Application 2019 & 2032
- Table 35: Global APAC Soy Protein Animal Feed Industry Revenue Million Forecast, by Country 2019 & 2032
- Table 36: Global APAC Soy Protein Animal Feed Industry Volume K Tons Forecast, by Country 2019 & 2032
- Table 37: China APAC Soy Protein Animal Feed Industry Revenue (Million) Forecast, by Application 2019 & 2032
- Table 38: China APAC Soy Protein Animal Feed Industry Volume (K Tons) Forecast, by Application 2019 & 2032
- Table 39: Japan APAC Soy Protein Animal Feed Industry Revenue (Million) Forecast, by Application 2019 & 2032
- Table 40: Japan APAC Soy Protein Animal Feed Industry Volume (K Tons) Forecast, by Application 2019 & 2032
- Table 41: India APAC Soy Protein Animal Feed Industry Revenue (Million) Forecast, by Application 2019 & 2032
- Table 42: India APAC Soy Protein Animal Feed Industry Volume (K Tons) Forecast, by Application 2019 & 2032
- Table 43: Australia APAC Soy Protein Animal Feed Industry Revenue (Million) Forecast, by Application 2019 & 2032
- Table 44: Australia APAC Soy Protein Animal Feed Industry Volume (K Tons) Forecast, by Application 2019 & 2032
- Table 45: Rest of Asia Pacific APAC Soy Protein Animal Feed Industry Revenue (Million) Forecast, by Application 2019 & 2032
- Table 46: Rest of Asia Pacific APAC Soy Protein Animal Feed Industry Volume (K Tons) Forecast, by Application 2019 & 2032
- Table 47: Global APAC Soy Protein Animal Feed Industry Revenue Million Forecast, by Country 2019 & 2032
- Table 48: Global APAC Soy Protein Animal Feed Industry Volume K Tons Forecast, by Country 2019 & 2032
- Table 49: Brazil APAC Soy Protein Animal Feed Industry Revenue (Million) Forecast, by Application 2019 & 2032
- Table 50: Brazil APAC Soy Protein Animal Feed Industry Volume (K Tons) Forecast, by Application 2019 & 2032
- Table 51: Argentina APAC Soy Protein Animal Feed Industry Revenue (Million) Forecast, by Application 2019 & 2032
- Table 52: Argentina APAC Soy Protein Animal Feed Industry Volume (K Tons) Forecast, by Application 2019 & 2032
- Table 53: Rest of South America APAC Soy Protein Animal Feed Industry Revenue (Million) Forecast, by Application 2019 & 2032
- Table 54: Rest of South America APAC Soy Protein Animal Feed Industry Volume (K Tons) Forecast, by Application 2019 & 2032
- Table 55: Global APAC Soy Protein Animal Feed Industry Revenue Million Forecast, by Country 2019 & 2032
- Table 56: Global APAC Soy Protein Animal Feed Industry Volume K Tons Forecast, by Country 2019 & 2032
- Table 57: United Arab Emirates APAC Soy Protein Animal Feed Industry Revenue (Million) Forecast, by Application 2019 & 2032
- Table 58: United Arab Emirates APAC Soy Protein Animal Feed Industry Volume (K Tons) Forecast, by Application 2019 & 2032
- Table 59: South Africa APAC Soy Protein Animal Feed Industry Revenue (Million) Forecast, by Application 2019 & 2032
- Table 60: South Africa APAC Soy Protein Animal Feed Industry Volume (K Tons) Forecast, by Application 2019 & 2032
- Table 61: Rest of Middle East and Africa APAC Soy Protein Animal Feed Industry Revenue (Million) Forecast, by Application 2019 & 2032
- Table 62: Rest of Middle East and Africa APAC Soy Protein Animal Feed Industry Volume (K Tons) Forecast, by Application 2019 & 2032
- Table 63: Global APAC Soy Protein Animal Feed Industry Revenue Million Forecast, by Form 2019 & 2032
- Table 64: Global APAC Soy Protein Animal Feed Industry Volume K Tons Forecast, by Form 2019 & 2032
- Table 65: Global APAC Soy Protein Animal Feed Industry Revenue Million Forecast, by End User 2019 & 2032
- Table 66: Global APAC Soy Protein Animal Feed Industry Volume K Tons Forecast, by End User 2019 & 2032
- Table 67: Global APAC Soy Protein Animal Feed Industry Revenue Million Forecast, by Country 2019 & 2032
- Table 68: Global APAC Soy Protein Animal Feed Industry Volume K Tons Forecast, by Country 2019 & 2032
- Table 69: United States APAC Soy Protein Animal Feed Industry Revenue (Million) Forecast, by Application 2019 & 2032
- Table 70: United States APAC Soy Protein Animal Feed Industry Volume (K Tons) Forecast, by Application 2019 & 2032
- Table 71: Canada APAC Soy Protein Animal Feed Industry Revenue (Million) Forecast, by Application 2019 & 2032
- Table 72: Canada APAC Soy Protein Animal Feed Industry Volume (K Tons) Forecast, by Application 2019 & 2032
- Table 73: Mexico APAC Soy Protein Animal Feed Industry Revenue (Million) Forecast, by Application 2019 & 2032
- Table 74: Mexico APAC Soy Protein Animal Feed Industry Volume (K Tons) Forecast, by Application 2019 & 2032
- Table 75: Global APAC Soy Protein Animal Feed Industry Revenue Million Forecast, by Form 2019 & 2032
- Table 76: Global APAC Soy Protein Animal Feed Industry Volume K Tons Forecast, by Form 2019 & 2032
- Table 77: Global APAC Soy Protein Animal Feed Industry Revenue Million Forecast, by End User 2019 & 2032
- Table 78: Global APAC Soy Protein Animal Feed Industry Volume K Tons Forecast, by End User 2019 & 2032
- Table 79: Global APAC Soy Protein Animal Feed Industry Revenue Million Forecast, by Country 2019 & 2032
- Table 80: Global APAC Soy Protein Animal Feed Industry Volume K Tons Forecast, by Country 2019 & 2032
- Table 81: Brazil APAC Soy Protein Animal Feed Industry Revenue (Million) Forecast, by Application 2019 & 2032
- Table 82: Brazil APAC Soy Protein Animal Feed Industry Volume (K Tons) Forecast, by Application 2019 & 2032
- Table 83: Argentina APAC Soy Protein Animal Feed Industry Revenue (Million) Forecast, by Application 2019 & 2032
- Table 84: Argentina APAC Soy Protein Animal Feed Industry Volume (K Tons) Forecast, by Application 2019 & 2032
- Table 85: Rest of South America APAC Soy Protein Animal Feed Industry Revenue (Million) Forecast, by Application 2019 & 2032
- Table 86: Rest of South America APAC Soy Protein Animal Feed Industry Volume (K Tons) Forecast, by Application 2019 & 2032
- Table 87: Global APAC Soy Protein Animal Feed Industry Revenue Million Forecast, by Form 2019 & 2032
- Table 88: Global APAC Soy Protein Animal Feed Industry Volume K Tons Forecast, by Form 2019 & 2032
- Table 89: Global APAC Soy Protein Animal Feed Industry Revenue Million Forecast, by End User 2019 & 2032
- Table 90: Global APAC Soy Protein Animal Feed Industry Volume K Tons Forecast, by End User 2019 & 2032
- Table 91: Global APAC Soy Protein Animal Feed Industry Revenue Million Forecast, by Country 2019 & 2032
- Table 92: Global APAC Soy Protein Animal Feed Industry Volume K Tons Forecast, by Country 2019 & 2032
- Table 93: United Kingdom APAC Soy Protein Animal Feed Industry Revenue (Million) Forecast, by Application 2019 & 2032
- Table 94: United Kingdom APAC Soy Protein Animal Feed Industry Volume (K Tons) Forecast, by Application 2019 & 2032
- Table 95: Germany APAC Soy Protein Animal Feed Industry Revenue (Million) Forecast, by Application 2019 & 2032
- Table 96: Germany APAC Soy Protein Animal Feed Industry Volume (K Tons) Forecast, by Application 2019 & 2032
- Table 97: France APAC Soy Protein Animal Feed Industry Revenue (Million) Forecast, by Application 2019 & 2032
- Table 98: France APAC Soy Protein Animal Feed Industry Volume (K Tons) Forecast, by Application 2019 & 2032
- Table 99: Italy APAC Soy Protein Animal Feed Industry Revenue (Million) Forecast, by Application 2019 & 2032
- Table 100: Italy APAC Soy Protein Animal Feed Industry Volume (K Tons) Forecast, by Application 2019 & 2032
- Table 101: Spain APAC Soy Protein Animal Feed Industry Revenue (Million) Forecast, by Application 2019 & 2032
- Table 102: Spain APAC Soy Protein Animal Feed Industry Volume (K Tons) Forecast, by Application 2019 & 2032
- Table 103: Russia APAC Soy Protein Animal Feed Industry Revenue (Million) Forecast, by Application 2019 & 2032
- Table 104: Russia APAC Soy Protein Animal Feed Industry Volume (K Tons) Forecast, by Application 2019 & 2032
- Table 105: Benelux APAC Soy Protein Animal Feed Industry Revenue (Million) Forecast, by Application 2019 & 2032
- Table 106: Benelux APAC Soy Protein Animal Feed Industry Volume (K Tons) Forecast, by Application 2019 & 2032
- Table 107: Nordics APAC Soy Protein Animal Feed Industry Revenue (Million) Forecast, by Application 2019 & 2032
- Table 108: Nordics APAC Soy Protein Animal Feed Industry Volume (K Tons) Forecast, by Application 2019 & 2032
- Table 109: Rest of Europe APAC Soy Protein Animal Feed Industry Revenue (Million) Forecast, by Application 2019 & 2032
- Table 110: Rest of Europe APAC Soy Protein Animal Feed Industry Volume (K Tons) Forecast, by Application 2019 & 2032
- Table 111: Global APAC Soy Protein Animal Feed Industry Revenue Million Forecast, by Form 2019 & 2032
- Table 112: Global APAC Soy Protein Animal Feed Industry Volume K Tons Forecast, by Form 2019 & 2032
- Table 113: Global APAC Soy Protein Animal Feed Industry Revenue Million Forecast, by End User 2019 & 2032
- Table 114: Global APAC Soy Protein Animal Feed Industry Volume K Tons Forecast, by End User 2019 & 2032
- Table 115: Global APAC Soy Protein Animal Feed Industry Revenue Million Forecast, by Country 2019 & 2032
- Table 116: Global APAC Soy Protein Animal Feed Industry Volume K Tons Forecast, by Country 2019 & 2032
- Table 117: Turkey APAC Soy Protein Animal Feed Industry Revenue (Million) Forecast, by Application 2019 & 2032
- Table 118: Turkey APAC Soy Protein Animal Feed Industry Volume (K Tons) Forecast, by Application 2019 & 2032
- Table 119: Israel APAC Soy Protein Animal Feed Industry Revenue (Million) Forecast, by Application 2019 & 2032
- Table 120: Israel APAC Soy Protein Animal Feed Industry Volume (K Tons) Forecast, by Application 2019 & 2032
- Table 121: GCC APAC Soy Protein Animal Feed Industry Revenue (Million) Forecast, by Application 2019 & 2032
- Table 122: GCC APAC Soy Protein Animal Feed Industry Volume (K Tons) Forecast, by Application 2019 & 2032
- Table 123: North Africa APAC Soy Protein Animal Feed Industry Revenue (Million) Forecast, by Application 2019 & 2032
- Table 124: North Africa APAC Soy Protein Animal Feed Industry Volume (K Tons) Forecast, by Application 2019 & 2032
- Table 125: South Africa APAC Soy Protein Animal Feed Industry Revenue (Million) Forecast, by Application 2019 & 2032
- Table 126: South Africa APAC Soy Protein Animal Feed Industry Volume (K Tons) Forecast, by Application 2019 & 2032
- Table 127: Rest of Middle East & Africa APAC Soy Protein Animal Feed Industry Revenue (Million) Forecast, by Application 2019 & 2032
- Table 128: Rest of Middle East & Africa APAC Soy Protein Animal Feed Industry Volume (K Tons) Forecast, by Application 2019 & 2032
- Table 129: Global APAC Soy Protein Animal Feed Industry Revenue Million Forecast, by Form 2019 & 2032
- Table 130: Global APAC Soy Protein Animal Feed Industry Volume K Tons Forecast, by Form 2019 & 2032
- Table 131: Global APAC Soy Protein Animal Feed Industry Revenue Million Forecast, by End User 2019 & 2032
- Table 132: Global APAC Soy Protein Animal Feed Industry Volume K Tons Forecast, by End User 2019 & 2032
- Table 133: Global APAC Soy Protein Animal Feed Industry Revenue Million Forecast, by Country 2019 & 2032
- Table 134: Global APAC Soy Protein Animal Feed Industry Volume K Tons Forecast, by Country 2019 & 2032
- Table 135: China APAC Soy Protein Animal Feed Industry Revenue (Million) Forecast, by Application 2019 & 2032
- Table 136: China APAC Soy Protein Animal Feed Industry Volume (K Tons) Forecast, by Application 2019 & 2032
- Table 137: India APAC Soy Protein Animal Feed Industry Revenue (Million) Forecast, by Application 2019 & 2032
- Table 138: India APAC Soy Protein Animal Feed Industry Volume (K Tons) Forecast, by Application 2019 & 2032
- Table 139: Japan APAC Soy Protein Animal Feed Industry Revenue (Million) Forecast, by Application 2019 & 2032
- Table 140: Japan APAC Soy Protein Animal Feed Industry Volume (K Tons) Forecast, by Application 2019 & 2032
- Table 141: South Korea APAC Soy Protein Animal Feed Industry Revenue (Million) Forecast, by Application 2019 & 2032
- Table 142: South Korea APAC Soy Protein Animal Feed Industry Volume (K Tons) Forecast, by Application 2019 & 2032
- Table 143: ASEAN APAC Soy Protein Animal Feed Industry Revenue (Million) Forecast, by Application 2019 & 2032
- Table 144: ASEAN APAC Soy Protein Animal Feed Industry Volume (K Tons) Forecast, by Application 2019 & 2032
- Table 145: Oceania APAC Soy Protein Animal Feed Industry Revenue (Million) Forecast, by Application 2019 & 2032
- Table 146: Oceania APAC Soy Protein Animal Feed Industry Volume (K Tons) Forecast, by Application 2019 & 2032
- Table 147: Rest of Asia Pacific APAC Soy Protein Animal Feed Industry Revenue (Million) Forecast, by Application 2019 & 2032
- Table 148: Rest of Asia Pacific APAC Soy Protein Animal Feed Industry Volume (K Tons) Forecast, by Application 2019 & 2032
Frequently Asked Questions
1. What is the projected Compound Annual Growth Rate (CAGR) of the APAC Soy Protein Animal Feed Industry?
The projected CAGR is approximately 4.02%.
2. Which companies are prominent players in the APAC Soy Protein Animal Feed Industry?
Key companies in the market include CHS Inc, Shandong Yuwang Industrial Co Ltd, International Flavors & Fragrances Inc, Wilmar International Lt, Archer Daniels Midland Company, Bunge Limited, Fuji Oil Group, Kerry Group PLC, Foodchem International Corporation, Cargill Incorporated.
3. What are the main segments of the APAC Soy Protein Animal Feed Industry?
The market segments include Form, End User.
4. Can you provide details about the market size?
The market size is estimated to be USD XX Million as of 2022.
5. What are some drivers contributing to market growth?
Increasing awareness towards fitness among consumers; Demand for convenient fortified foods.
6. What are the notable trends driving market growth?
OTHER KEY INDUSTRY TRENDS COVERED IN THE REPORT.
7. Are there any restraints impacting market growth?
Prevalence of allergen intolerance among the consumers.
8. Can you provide examples of recent developments in the market?
July 2020: DuPont Nutrition & Biosciences (DuPont), a subsidiary of IFF, offers the industry's broadest assortment of ingredients for plant-based product development with the new Danisco Planit range. Danisco Planit is a global launch that includes services, expertise, and an unparalleled ingredient portfolio for plant-based food and beverages, including plant proteins, hydrocolloids, cultures, probiotics, fibers, food protection, antioxidants, natural extracts, emulsifiers, and enzymes, as well as tailor-made systems.March 2019: DuPont launched new soy-based Protein Nuggets under the brand SUPRO. The 90% protein nugget product range was aimed to broaden the company's range of plant protein options that drive high protein content and unique textures.January 2019: Fuji Oil Holdings Inc. constructed a new plant for soy processing food on the grounds of its Chiba Plant (located in the city of Chiba, Chiba Prefecture, Japan) with an investment of JPY 2.4 billion. With the new plant having a production capacity of 9,000 ton per year and a building floor of 1,456 square meters, the company plans to develop new markets for the future.
9. What pricing options are available for accessing the report?
Pricing options include single-user, multi-user, and enterprise licenses priced at USD 3800, USD 4500, and USD 5800 respectively.
10. Is the market size provided in terms of value or volume?
The market size is provided in terms of value, measured in Million and volume, measured in K Tons.
11. Are there any specific market keywords associated with the report?
Yes, the market keyword associated with the report is "APAC Soy Protein Animal Feed Industry," which aids in identifying and referencing the specific market segment covered.
12. How do I determine which pricing option suits my needs best?
The pricing options vary based on user requirements and access needs. Individual users may opt for single-user licenses, while businesses requiring broader access may choose multi-user or enterprise licenses for cost-effective access to the report.
13. Are there any additional resources or data provided in the APAC Soy Protein Animal Feed Industry report?
While the report offers comprehensive insights, it's advisable to review the specific contents or supplementary materials provided to ascertain if additional resources or data are available.
14. How can I stay updated on further developments or reports in the APAC Soy Protein Animal Feed Industry?
To stay informed about further developments, trends, and reports in the APAC Soy Protein Animal Feed Industry, consider subscribing to industry newsletters, following relevant companies and organizations, or regularly checking reputable industry news sources and publications.
Methodology
Step 1 - Identification of Relevant Samples Size from Population Database


Step 2 - Approaches for Defining Global Market Size (Value, Volume* & Price*)

Note*: In applicable scenarios
Step 3 - Data Sources
Primary Research
- Web Analytics
- Survey Reports
- Research Institute
- Latest Research Reports
- Opinion Leaders
Secondary Research
- Annual Reports
- White Paper
- Latest Press Release
- Industry Association
- Paid Database
- Investor Presentations

Step 4 - Data Triangulation
Involves using different sources of information in order to increase the validity of a study
These sources are likely to be stakeholders in a program - participants, other researchers, program staff, other community members, and so on.
Then we put all data in single framework & apply various statistical tools to find out the dynamic on the market.
During the analysis stage, feedback from the stakeholder groups would be compared to determine areas of agreement as well as areas of divergence


