
Key Insights
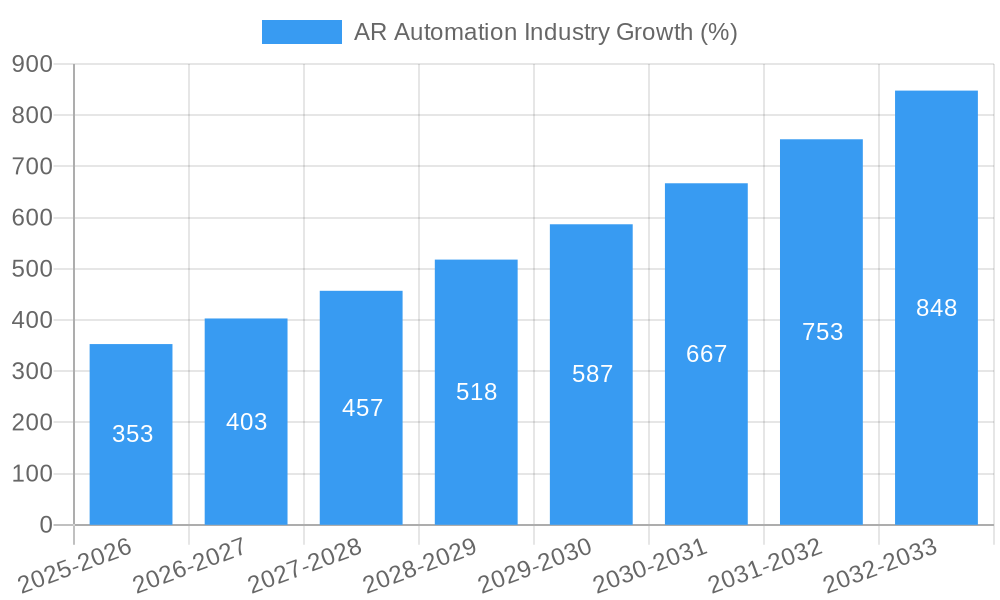
The Accounts Receivable (AR) automation market is experiencing robust growth, projected to reach $3.04 billion in 2025 and maintain a Compound Annual Growth Rate (CAGR) of 11.84% from 2025 to 2033. This expansion is driven by several key factors. Firstly, the increasing volume and complexity of invoices, coupled with the need for improved efficiency and reduced operational costs, are compelling businesses of all sizes to adopt AR automation solutions. Secondly, the growing adoption of cloud-based technologies offers scalable and cost-effective solutions, further fueling market growth. Furthermore, the rise of big data analytics within AR processes enables businesses to gain better insights into customer payment behavior, improving cash flow prediction and management. Finally, regulatory compliance mandates and the increasing pressure to mitigate fraud are significant drivers for AR automation adoption, especially within heavily regulated sectors like BFSI and healthcare.
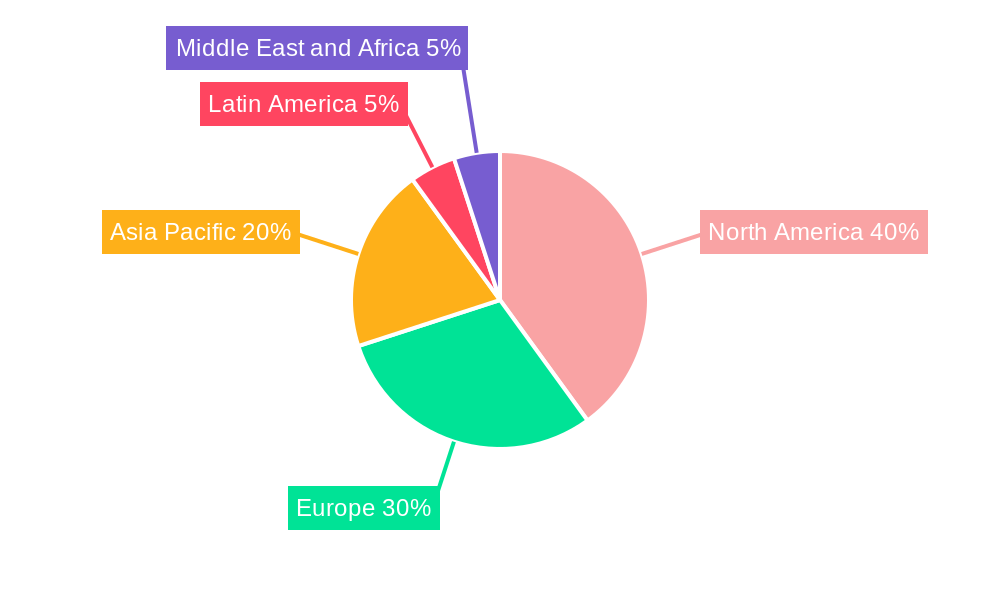
The market segmentation reveals a diverse landscape. Large enterprises currently represent a significant share, but the adoption rate among Small and Medium Enterprises (SMEs) is rapidly increasing, driven by the availability of affordable and user-friendly solutions. The BFSI, IT and Telecom, and Manufacturing sectors are currently leading in AR automation adoption, yet significant growth opportunities exist within Healthcare and Transportation and Logistics. The solution and service components both contribute substantially, with cloud-based deployment witnessing the fastest growth, reflecting the shift towards flexible and accessible solutions. Key players like Workday, Corcentric, HighRadius, and Bill.com are driving innovation, while companies like Kofax and Quadient contribute significantly through their specialized solutions. While North America currently holds a dominant market share, regions like Asia Pacific are projected to experience the highest growth rates in the coming years, driven by rapid digital transformation and increasing technological investments.

AR Automation Industry Market Report: 2019-2033
This comprehensive report provides a detailed analysis of the AR Automation Industry, projecting a market size of USD xx Million by 2033. It covers market structure, dynamics, key players, and future trends, offering actionable insights for industry professionals. The study period spans 2019-2033, with 2025 as the base and estimated year. The forecast period is 2025-2033, and the historical period is 2019-2024.
AR Automation Industry Market Structure & Innovation Trends
The AR Automation industry exhibits a moderately concentrated market structure, with several major players holding significant market share. However, the landscape is dynamic, with ongoing mergers and acquisitions (M&A) influencing market concentration. Innovation is driven by the need for enhanced efficiency, reduced operational costs, and improved accuracy in accounts receivable processes. Regulatory frameworks, particularly concerning data privacy and security, play a significant role in shaping industry practices. Product substitutes, such as manual processes, are gradually being replaced due to the cost-effectiveness and efficiency of automation solutions. The end-user demographic encompasses both small and medium enterprises (SMEs) and large enterprises across diverse sectors.
Key Metrics & Observations:
- Market Share: Top 5 players hold approximately xx% of the market share in 2025.
- M&A Activity: An estimated USD xx Million in M&A deals occurred in the period 2019-2024. (Note: Precise figures are not available publicly for all deals)
- Innovation Drivers: AI, machine learning, cloud computing, and process mining.
- Regulatory Impact: GDPR, CCPA, and other regional data protection laws influence software development and data handling practices.
AR Automation Industry Market Dynamics & Trends
The AR Automation industry is experiencing significant growth, driven by several key factors. The increasing adoption of cloud-based solutions is improving accessibility and scalability. The rising demand for automation in diverse industries, coupled with continuous technological advancements, is driving market expansion. Consumer preference shifts toward automated, streamlined financial processes, along with the need for improved data visibility and risk mitigation, boost market penetration. Competitive dynamics are characterized by ongoing innovation, strategic partnerships, and M&A activity, shaping market pricing and product differentiation.
Key Metrics & Observations:
- CAGR: The market is projected to exhibit a CAGR of xx% during the forecast period (2025-2033).
- Market Penetration: Cloud-based solutions are projected to have xx% market penetration by 2033.
- Technological Disruptions: AI-powered solutions and robotic process automation (RPA) are major disruptors.
Dominant Regions & Segments in AR Automation Industry
The North American region is currently the dominant market for AR automation, driven by factors such as robust IT infrastructure, high technological adoption, and the presence of numerous key players. However, the Asia-Pacific region is expected to witness significant growth due to increasing digitization and economic expansion.
Dominant Segments:
- Size of Organization: Large enterprises are the currently dominant segment due to higher budgets and complex AR processes. However, SMEs are expected to grow at a faster rate.
- End-user Industry: The BFSI (Banking, Financial Services, and Insurance) sector leads due to its high volume of transactions and stringent regulatory requirements.
- Component: Solutions segment is currently larger than the Services segment due to high demand for pre-built automation platforms.
- Deployment Mode: Cloud deployment is the dominant mode due to cost-effectiveness and scalability.
Key Drivers:
- North America: Strong IT infrastructure, high technological adoption rates, favorable regulatory environment, and presence of major vendors.
- Asia-Pacific: Rapid economic growth, increasing digitization, rising demand for automation across various industries, and government initiatives promoting technology adoption.
AR Automation Industry Product Innovations
Recent product innovations in the AR automation industry emphasize AI-powered features such as intelligent automation, predictive analytics, and machine learning algorithms, improving accuracy, efficiency, and decision-making capabilities. This integration enhances automated invoice processing, cash application, dispute resolution, and credit risk assessment. These solutions are designed to seamlessly integrate with existing ERP and accounting systems, offering flexible deployment options (on-premise and cloud-based) and improved user experiences, aligning with market demand for cost-effective and scalable solutions.
Report Scope & Segmentation Analysis
This report segments the AR Automation market by:
- Size of Organization: Small and Medium Enterprises (SMEs) and Large Enterprises. Large enterprises currently dominate, but SMEs are showing strong growth potential.
- End-user Industry: BFSI, IT and Telecom, Manufacturing, Healthcare, Transportation and Logistics, and Other End-user Industries. The BFSI segment currently holds the largest market share.
- Component: Solutions and Services. The Solutions segment currently holds a larger market share.
- Deployment Mode: On-premise and Cloud. Cloud deployment is experiencing faster growth and higher market share. Growth projections and competitive dynamics vary across each segment. Market sizes for each segment are provided within the full report.
Key Drivers of AR Automation Industry Growth
The AR automation market's growth is fueled by several factors: the increasing volume and complexity of financial transactions, the need for improved accuracy and efficiency in AR processes, rising labor costs, and stringent regulatory compliance requirements. Technological advancements in AI, machine learning, and cloud computing further accelerate market expansion. Government initiatives promoting digital transformation in various sectors also contribute significantly.
Challenges in the AR Automation Industry Sector
Key challenges include the high initial investment cost for implementing automation solutions, concerns about data security and privacy, the need for skilled professionals to manage and maintain these systems, and the complexity of integrating new technologies with legacy systems. Resistance to change from employees accustomed to manual processes, and the risk of integration failure can also impede growth. The competitive pressure from numerous vendors also creates challenges.
Emerging Opportunities in AR Automation Industry
The growing adoption of blockchain technology for secure and transparent transactions, the increasing use of predictive analytics for improved cash flow management, and the development of more intuitive and user-friendly AR automation solutions represent significant opportunities. Expansion into untapped markets, particularly in developing economies with growing digitization efforts, presents substantial growth potential.
Leading Players in the AR Automation Industry Market
- Workday Inc
- Corcentric LLC
- HighRadius Corporation
- Bill.com Holdings Inc
- Kofax Inc
- Qvalia AB
- Quadient (YayPay Inc)
- Esker Inc
- Oracle Corporation
- Comarch SA
- MHC Automation
- SK Global Software
- SAP SE
Key Developments in AR Automation Industry
- September 2022: Regate secured USD 20 Million in Series A funding to expand its SaaS platform for finance automation, targeting SMEs.
- March 2022: Esker partnered with Fujitsu Asia to expand its Procure-to-Pay and Order-to-Cash solutions in Singapore.
Future Outlook for AR Automation Industry Market
The AR automation market is poised for substantial growth over the next decade, driven by continued technological innovation, increasing demand for efficient and accurate AR processes, and expanding adoption across various industries and geographical regions. Strategic partnerships, acquisitions, and product enhancements will further fuel this growth, creating lucrative opportunities for market participants.
AR Automation Industry Segmentation
-
1. Component
- 1.1. Solutions
- 1.2. Services
-
2. Deployment Mode
- 2.1. On-premise
- 2.2. Cloud
-
3. Size of the Organization
- 3.1. Small and Medium Enterprises
- 3.2. Large Enterprises
-
4. End-user Industry
- 4.1. BFSI
- 4.2. IT and Telecom
- 4.3. Manufacturing
- 4.4. Healthcare
- 4.5. Transportation and Logistics
- 4.6. Other End-user Industries
AR Automation Industry Segmentation By Geography
- 1. North America
- 2. Europe
- 3. Asia
- 4. Australia and New Zealand
- 5. Latin America
- 6. Middle East and Africa
AR Automation Industry REPORT HIGHLIGHTS
| Aspects | Details |
|---|---|
| Study Period | 2019-2033 |
| Base Year | 2024 |
| Estimated Year | 2025 |
| Forecast Period | 2025-2033 |
| Historical Period | 2019-2024 |
| Growth Rate | CAGR of 11.84% from 2019-2033 |
| Segmentation |
|
Table of Contents
- 1. Introduction
- 1.1. Research Scope
- 1.2. Market Segmentation
- 1.3. Research Methodology
- 1.4. Definitions and Assumptions
- 2. Executive Summary
- 2.1. Introduction
- 3. Market Dynamics
- 3.1. Introduction
- 3.2. Market Drivers
- 3.2.1. Improve Business Efficiency by Improving Cash Flow and Reducing Costs and Accounting Cycle Time; Increasing Adoption of Technologies like Cloud Computing and AI
- 3.3. Market Restrains
- 3.3.1. Complex Procedure of Invoicing and Payment Management; Privacy and Security Concerns
- 3.4. Market Trends
- 3.4.1. Increasing Adoption of Technologies Such as Cloud Computing and AI
- 4. Market Factor Analysis
- 4.1. Porters Five Forces
- 4.2. Supply/Value Chain
- 4.3. PESTEL analysis
- 4.4. Market Entropy
- 4.5. Patent/Trademark Analysis
- 5. Global AR Automation Industry Analysis, Insights and Forecast, 2019-2031
- 5.1. Market Analysis, Insights and Forecast - by Component
- 5.1.1. Solutions
- 5.1.2. Services
- 5.2. Market Analysis, Insights and Forecast - by Deployment Mode
- 5.2.1. On-premise
- 5.2.2. Cloud
- 5.3. Market Analysis, Insights and Forecast - by Size of the Organization
- 5.3.1. Small and Medium Enterprises
- 5.3.2. Large Enterprises
- 5.4. Market Analysis, Insights and Forecast - by End-user Industry
- 5.4.1. BFSI
- 5.4.2. IT and Telecom
- 5.4.3. Manufacturing
- 5.4.4. Healthcare
- 5.4.5. Transportation and Logistics
- 5.4.6. Other End-user Industries
- 5.5. Market Analysis, Insights and Forecast - by Region
- 5.5.1. North America
- 5.5.2. Europe
- 5.5.3. Asia
- 5.5.4. Australia and New Zealand
- 5.5.5. Latin America
- 5.5.6. Middle East and Africa
- 5.1. Market Analysis, Insights and Forecast - by Component
- 6. North America AR Automation Industry Analysis, Insights and Forecast, 2019-2031
- 6.1. Market Analysis, Insights and Forecast - by Component
- 6.1.1. Solutions
- 6.1.2. Services
- 6.2. Market Analysis, Insights and Forecast - by Deployment Mode
- 6.2.1. On-premise
- 6.2.2. Cloud
- 6.3. Market Analysis, Insights and Forecast - by Size of the Organization
- 6.3.1. Small and Medium Enterprises
- 6.3.2. Large Enterprises
- 6.4. Market Analysis, Insights and Forecast - by End-user Industry
- 6.4.1. BFSI
- 6.4.2. IT and Telecom
- 6.4.3. Manufacturing
- 6.4.4. Healthcare
- 6.4.5. Transportation and Logistics
- 6.4.6. Other End-user Industries
- 6.1. Market Analysis, Insights and Forecast - by Component
- 7. Europe AR Automation Industry Analysis, Insights and Forecast, 2019-2031
- 7.1. Market Analysis, Insights and Forecast - by Component
- 7.1.1. Solutions
- 7.1.2. Services
- 7.2. Market Analysis, Insights and Forecast - by Deployment Mode
- 7.2.1. On-premise
- 7.2.2. Cloud
- 7.3. Market Analysis, Insights and Forecast - by Size of the Organization
- 7.3.1. Small and Medium Enterprises
- 7.3.2. Large Enterprises
- 7.4. Market Analysis, Insights and Forecast - by End-user Industry
- 7.4.1. BFSI
- 7.4.2. IT and Telecom
- 7.4.3. Manufacturing
- 7.4.4. Healthcare
- 7.4.5. Transportation and Logistics
- 7.4.6. Other End-user Industries
- 7.1. Market Analysis, Insights and Forecast - by Component
- 8. Asia AR Automation Industry Analysis, Insights and Forecast, 2019-2031
- 8.1. Market Analysis, Insights and Forecast - by Component
- 8.1.1. Solutions
- 8.1.2. Services
- 8.2. Market Analysis, Insights and Forecast - by Deployment Mode
- 8.2.1. On-premise
- 8.2.2. Cloud
- 8.3. Market Analysis, Insights and Forecast - by Size of the Organization
- 8.3.1. Small and Medium Enterprises
- 8.3.2. Large Enterprises
- 8.4. Market Analysis, Insights and Forecast - by End-user Industry
- 8.4.1. BFSI
- 8.4.2. IT and Telecom
- 8.4.3. Manufacturing
- 8.4.4. Healthcare
- 8.4.5. Transportation and Logistics
- 8.4.6. Other End-user Industries
- 8.1. Market Analysis, Insights and Forecast - by Component
- 9. Australia and New Zealand AR Automation Industry Analysis, Insights and Forecast, 2019-2031
- 9.1. Market Analysis, Insights and Forecast - by Component
- 9.1.1. Solutions
- 9.1.2. Services
- 9.2. Market Analysis, Insights and Forecast - by Deployment Mode
- 9.2.1. On-premise
- 9.2.2. Cloud
- 9.3. Market Analysis, Insights and Forecast - by Size of the Organization
- 9.3.1. Small and Medium Enterprises
- 9.3.2. Large Enterprises
- 9.4. Market Analysis, Insights and Forecast - by End-user Industry
- 9.4.1. BFSI
- 9.4.2. IT and Telecom
- 9.4.3. Manufacturing
- 9.4.4. Healthcare
- 9.4.5. Transportation and Logistics
- 9.4.6. Other End-user Industries
- 9.1. Market Analysis, Insights and Forecast - by Component
- 10. Latin America AR Automation Industry Analysis, Insights and Forecast, 2019-2031
- 10.1. Market Analysis, Insights and Forecast - by Component
- 10.1.1. Solutions
- 10.1.2. Services
- 10.2. Market Analysis, Insights and Forecast - by Deployment Mode
- 10.2.1. On-premise
- 10.2.2. Cloud
- 10.3. Market Analysis, Insights and Forecast - by Size of the Organization
- 10.3.1. Small and Medium Enterprises
- 10.3.2. Large Enterprises
- 10.4. Market Analysis, Insights and Forecast - by End-user Industry
- 10.4.1. BFSI
- 10.4.2. IT and Telecom
- 10.4.3. Manufacturing
- 10.4.4. Healthcare
- 10.4.5. Transportation and Logistics
- 10.4.6. Other End-user Industries
- 10.1. Market Analysis, Insights and Forecast - by Component
- 11. Middle East and Africa AR Automation Industry Analysis, Insights and Forecast, 2019-2031
- 11.1. Market Analysis, Insights and Forecast - by Component
- 11.1.1. Solutions
- 11.1.2. Services
- 11.2. Market Analysis, Insights and Forecast - by Deployment Mode
- 11.2.1. On-premise
- 11.2.2. Cloud
- 11.3. Market Analysis, Insights and Forecast - by Size of the Organization
- 11.3.1. Small and Medium Enterprises
- 11.3.2. Large Enterprises
- 11.4. Market Analysis, Insights and Forecast - by End-user Industry
- 11.4.1. BFSI
- 11.4.2. IT and Telecom
- 11.4.3. Manufacturing
- 11.4.4. Healthcare
- 11.4.5. Transportation and Logistics
- 11.4.6. Other End-user Industries
- 11.1. Market Analysis, Insights and Forecast - by Component
- 12. North America AR Automation Industry Analysis, Insights and Forecast, 2019-2031
- 12.1. Market Analysis, Insights and Forecast - By Country/Sub-region
- 12.1.1.
- 13. Europe AR Automation Industry Analysis, Insights and Forecast, 2019-2031
- 13.1. Market Analysis, Insights and Forecast - By Country/Sub-region
- 13.1.1.
- 14. Asia Pacific AR Automation Industry Analysis, Insights and Forecast, 2019-2031
- 14.1. Market Analysis, Insights and Forecast - By Country/Sub-region
- 14.1.1.
- 15. Latin America AR Automation Industry Analysis, Insights and Forecast, 2019-2031
- 15.1. Market Analysis, Insights and Forecast - By Country/Sub-region
- 15.1.1.
- 16. Middle East and Africa AR Automation Industry Analysis, Insights and Forecast, 2019-2031
- 16.1. Market Analysis, Insights and Forecast - By Country/Sub-region
- 16.1.1.
- 17. Competitive Analysis
- 17.1. Global Market Share Analysis 2024
- 17.2. Company Profiles
- 17.2.1 Workday Inc
- 17.2.1.1. Overview
- 17.2.1.2. Products
- 17.2.1.3. SWOT Analysis
- 17.2.1.4. Recent Developments
- 17.2.1.5. Financials (Based on Availability)
- 17.2.2 Corcentric LLC
- 17.2.2.1. Overview
- 17.2.2.2. Products
- 17.2.2.3. SWOT Analysis
- 17.2.2.4. Recent Developments
- 17.2.2.5. Financials (Based on Availability)
- 17.2.3 HighRadius Corporation
- 17.2.3.1. Overview
- 17.2.3.2. Products
- 17.2.3.3. SWOT Analysis
- 17.2.3.4. Recent Developments
- 17.2.3.5. Financials (Based on Availability)
- 17.2.4 Bill com Holdings Inc
- 17.2.4.1. Overview
- 17.2.4.2. Products
- 17.2.4.3. SWOT Analysis
- 17.2.4.4. Recent Developments
- 17.2.4.5. Financials (Based on Availability)
- 17.2.5 Kofax Inc
- 17.2.5.1. Overview
- 17.2.5.2. Products
- 17.2.5.3. SWOT Analysis
- 17.2.5.4. Recent Developments
- 17.2.5.5. Financials (Based on Availability)
- 17.2.6 Qvalia AB
- 17.2.6.1. Overview
- 17.2.6.2. Products
- 17.2.6.3. SWOT Analysis
- 17.2.6.4. Recent Developments
- 17.2.6.5. Financials (Based on Availability)
- 17.2.7 Quadient (YayPay Inc )
- 17.2.7.1. Overview
- 17.2.7.2. Products
- 17.2.7.3. SWOT Analysis
- 17.2.7.4. Recent Developments
- 17.2.7.5. Financials (Based on Availability)
- 17.2.8 Esker Inc *List Not Exhaustive
- 17.2.8.1. Overview
- 17.2.8.2. Products
- 17.2.8.3. SWOT Analysis
- 17.2.8.4. Recent Developments
- 17.2.8.5. Financials (Based on Availability)
- 17.2.9 Oracle Corporation
- 17.2.9.1. Overview
- 17.2.9.2. Products
- 17.2.9.3. SWOT Analysis
- 17.2.9.4. Recent Developments
- 17.2.9.5. Financials (Based on Availability)
- 17.2.10 Comarch SA
- 17.2.10.1. Overview
- 17.2.10.2. Products
- 17.2.10.3. SWOT Analysis
- 17.2.10.4. Recent Developments
- 17.2.10.5. Financials (Based on Availability)
- 17.2.11 MHC Automation
- 17.2.11.1. Overview
- 17.2.11.2. Products
- 17.2.11.3. SWOT Analysis
- 17.2.11.4. Recent Developments
- 17.2.11.5. Financials (Based on Availability)
- 17.2.12 SK Global Software
- 17.2.12.1. Overview
- 17.2.12.2. Products
- 17.2.12.3. SWOT Analysis
- 17.2.12.4. Recent Developments
- 17.2.12.5. Financials (Based on Availability)
- 17.2.13 SAP SE
- 17.2.13.1. Overview
- 17.2.13.2. Products
- 17.2.13.3. SWOT Analysis
- 17.2.13.4. Recent Developments
- 17.2.13.5. Financials (Based on Availability)
- 17.2.1 Workday Inc
List of Figures
- Figure 1: Global AR Automation Industry Revenue Breakdown (Million, %) by Region 2024 & 2032
- Figure 2: North America AR Automation Industry Revenue (Million), by Country 2024 & 2032
- Figure 3: North America AR Automation Industry Revenue Share (%), by Country 2024 & 2032
- Figure 4: Europe AR Automation Industry Revenue (Million), by Country 2024 & 2032
- Figure 5: Europe AR Automation Industry Revenue Share (%), by Country 2024 & 2032
- Figure 6: Asia Pacific AR Automation Industry Revenue (Million), by Country 2024 & 2032
- Figure 7: Asia Pacific AR Automation Industry Revenue Share (%), by Country 2024 & 2032
- Figure 8: Latin America AR Automation Industry Revenue (Million), by Country 2024 & 2032
- Figure 9: Latin America AR Automation Industry Revenue Share (%), by Country 2024 & 2032
- Figure 10: Middle East and Africa AR Automation Industry Revenue (Million), by Country 2024 & 2032
- Figure 11: Middle East and Africa AR Automation Industry Revenue Share (%), by Country 2024 & 2032
- Figure 12: North America AR Automation Industry Revenue (Million), by Component 2024 & 2032
- Figure 13: North America AR Automation Industry Revenue Share (%), by Component 2024 & 2032
- Figure 14: North America AR Automation Industry Revenue (Million), by Deployment Mode 2024 & 2032
- Figure 15: North America AR Automation Industry Revenue Share (%), by Deployment Mode 2024 & 2032
- Figure 16: North America AR Automation Industry Revenue (Million), by Size of the Organization 2024 & 2032
- Figure 17: North America AR Automation Industry Revenue Share (%), by Size of the Organization 2024 & 2032
- Figure 18: North America AR Automation Industry Revenue (Million), by End-user Industry 2024 & 2032
- Figure 19: North America AR Automation Industry Revenue Share (%), by End-user Industry 2024 & 2032
- Figure 20: North America AR Automation Industry Revenue (Million), by Country 2024 & 2032
- Figure 21: North America AR Automation Industry Revenue Share (%), by Country 2024 & 2032
- Figure 22: Europe AR Automation Industry Revenue (Million), by Component 2024 & 2032
- Figure 23: Europe AR Automation Industry Revenue Share (%), by Component 2024 & 2032
- Figure 24: Europe AR Automation Industry Revenue (Million), by Deployment Mode 2024 & 2032
- Figure 25: Europe AR Automation Industry Revenue Share (%), by Deployment Mode 2024 & 2032
- Figure 26: Europe AR Automation Industry Revenue (Million), by Size of the Organization 2024 & 2032
- Figure 27: Europe AR Automation Industry Revenue Share (%), by Size of the Organization 2024 & 2032
- Figure 28: Europe AR Automation Industry Revenue (Million), by End-user Industry 2024 & 2032
- Figure 29: Europe AR Automation Industry Revenue Share (%), by End-user Industry 2024 & 2032
- Figure 30: Europe AR Automation Industry Revenue (Million), by Country 2024 & 2032
- Figure 31: Europe AR Automation Industry Revenue Share (%), by Country 2024 & 2032
- Figure 32: Asia AR Automation Industry Revenue (Million), by Component 2024 & 2032
- Figure 33: Asia AR Automation Industry Revenue Share (%), by Component 2024 & 2032
- Figure 34: Asia AR Automation Industry Revenue (Million), by Deployment Mode 2024 & 2032
- Figure 35: Asia AR Automation Industry Revenue Share (%), by Deployment Mode 2024 & 2032
- Figure 36: Asia AR Automation Industry Revenue (Million), by Size of the Organization 2024 & 2032
- Figure 37: Asia AR Automation Industry Revenue Share (%), by Size of the Organization 2024 & 2032
- Figure 38: Asia AR Automation Industry Revenue (Million), by End-user Industry 2024 & 2032
- Figure 39: Asia AR Automation Industry Revenue Share (%), by End-user Industry 2024 & 2032
- Figure 40: Asia AR Automation Industry Revenue (Million), by Country 2024 & 2032
- Figure 41: Asia AR Automation Industry Revenue Share (%), by Country 2024 & 2032
- Figure 42: Australia and New Zealand AR Automation Industry Revenue (Million), by Component 2024 & 2032
- Figure 43: Australia and New Zealand AR Automation Industry Revenue Share (%), by Component 2024 & 2032
- Figure 44: Australia and New Zealand AR Automation Industry Revenue (Million), by Deployment Mode 2024 & 2032
- Figure 45: Australia and New Zealand AR Automation Industry Revenue Share (%), by Deployment Mode 2024 & 2032
- Figure 46: Australia and New Zealand AR Automation Industry Revenue (Million), by Size of the Organization 2024 & 2032
- Figure 47: Australia and New Zealand AR Automation Industry Revenue Share (%), by Size of the Organization 2024 & 2032
- Figure 48: Australia and New Zealand AR Automation Industry Revenue (Million), by End-user Industry 2024 & 2032
- Figure 49: Australia and New Zealand AR Automation Industry Revenue Share (%), by End-user Industry 2024 & 2032
- Figure 50: Australia and New Zealand AR Automation Industry Revenue (Million), by Country 2024 & 2032
- Figure 51: Australia and New Zealand AR Automation Industry Revenue Share (%), by Country 2024 & 2032
- Figure 52: Latin America AR Automation Industry Revenue (Million), by Component 2024 & 2032
- Figure 53: Latin America AR Automation Industry Revenue Share (%), by Component 2024 & 2032
- Figure 54: Latin America AR Automation Industry Revenue (Million), by Deployment Mode 2024 & 2032
- Figure 55: Latin America AR Automation Industry Revenue Share (%), by Deployment Mode 2024 & 2032
- Figure 56: Latin America AR Automation Industry Revenue (Million), by Size of the Organization 2024 & 2032
- Figure 57: Latin America AR Automation Industry Revenue Share (%), by Size of the Organization 2024 & 2032
- Figure 58: Latin America AR Automation Industry Revenue (Million), by End-user Industry 2024 & 2032
- Figure 59: Latin America AR Automation Industry Revenue Share (%), by End-user Industry 2024 & 2032
- Figure 60: Latin America AR Automation Industry Revenue (Million), by Country 2024 & 2032
- Figure 61: Latin America AR Automation Industry Revenue Share (%), by Country 2024 & 2032
- Figure 62: Middle East and Africa AR Automation Industry Revenue (Million), by Component 2024 & 2032
- Figure 63: Middle East and Africa AR Automation Industry Revenue Share (%), by Component 2024 & 2032
- Figure 64: Middle East and Africa AR Automation Industry Revenue (Million), by Deployment Mode 2024 & 2032
- Figure 65: Middle East and Africa AR Automation Industry Revenue Share (%), by Deployment Mode 2024 & 2032
- Figure 66: Middle East and Africa AR Automation Industry Revenue (Million), by Size of the Organization 2024 & 2032
- Figure 67: Middle East and Africa AR Automation Industry Revenue Share (%), by Size of the Organization 2024 & 2032
- Figure 68: Middle East and Africa AR Automation Industry Revenue (Million), by End-user Industry 2024 & 2032
- Figure 69: Middle East and Africa AR Automation Industry Revenue Share (%), by End-user Industry 2024 & 2032
- Figure 70: Middle East and Africa AR Automation Industry Revenue (Million), by Country 2024 & 2032
- Figure 71: Middle East and Africa AR Automation Industry Revenue Share (%), by Country 2024 & 2032
List of Tables
- Table 1: Global AR Automation Industry Revenue Million Forecast, by Region 2019 & 2032
- Table 2: Global AR Automation Industry Revenue Million Forecast, by Component 2019 & 2032
- Table 3: Global AR Automation Industry Revenue Million Forecast, by Deployment Mode 2019 & 2032
- Table 4: Global AR Automation Industry Revenue Million Forecast, by Size of the Organization 2019 & 2032
- Table 5: Global AR Automation Industry Revenue Million Forecast, by End-user Industry 2019 & 2032
- Table 6: Global AR Automation Industry Revenue Million Forecast, by Region 2019 & 2032
- Table 7: Global AR Automation Industry Revenue Million Forecast, by Country 2019 & 2032
- Table 8: AR Automation Industry Revenue (Million) Forecast, by Application 2019 & 2032
- Table 9: Global AR Automation Industry Revenue Million Forecast, by Country 2019 & 2032
- Table 10: AR Automation Industry Revenue (Million) Forecast, by Application 2019 & 2032
- Table 11: Global AR Automation Industry Revenue Million Forecast, by Country 2019 & 2032
- Table 12: AR Automation Industry Revenue (Million) Forecast, by Application 2019 & 2032
- Table 13: Global AR Automation Industry Revenue Million Forecast, by Country 2019 & 2032
- Table 14: AR Automation Industry Revenue (Million) Forecast, by Application 2019 & 2032
- Table 15: Global AR Automation Industry Revenue Million Forecast, by Country 2019 & 2032
- Table 16: AR Automation Industry Revenue (Million) Forecast, by Application 2019 & 2032
- Table 17: Global AR Automation Industry Revenue Million Forecast, by Component 2019 & 2032
- Table 18: Global AR Automation Industry Revenue Million Forecast, by Deployment Mode 2019 & 2032
- Table 19: Global AR Automation Industry Revenue Million Forecast, by Size of the Organization 2019 & 2032
- Table 20: Global AR Automation Industry Revenue Million Forecast, by End-user Industry 2019 & 2032
- Table 21: Global AR Automation Industry Revenue Million Forecast, by Country 2019 & 2032
- Table 22: Global AR Automation Industry Revenue Million Forecast, by Component 2019 & 2032
- Table 23: Global AR Automation Industry Revenue Million Forecast, by Deployment Mode 2019 & 2032
- Table 24: Global AR Automation Industry Revenue Million Forecast, by Size of the Organization 2019 & 2032
- Table 25: Global AR Automation Industry Revenue Million Forecast, by End-user Industry 2019 & 2032
- Table 26: Global AR Automation Industry Revenue Million Forecast, by Country 2019 & 2032
- Table 27: Global AR Automation Industry Revenue Million Forecast, by Component 2019 & 2032
- Table 28: Global AR Automation Industry Revenue Million Forecast, by Deployment Mode 2019 & 2032
- Table 29: Global AR Automation Industry Revenue Million Forecast, by Size of the Organization 2019 & 2032
- Table 30: Global AR Automation Industry Revenue Million Forecast, by End-user Industry 2019 & 2032
- Table 31: Global AR Automation Industry Revenue Million Forecast, by Country 2019 & 2032
- Table 32: Global AR Automation Industry Revenue Million Forecast, by Component 2019 & 2032
- Table 33: Global AR Automation Industry Revenue Million Forecast, by Deployment Mode 2019 & 2032
- Table 34: Global AR Automation Industry Revenue Million Forecast, by Size of the Organization 2019 & 2032
- Table 35: Global AR Automation Industry Revenue Million Forecast, by End-user Industry 2019 & 2032
- Table 36: Global AR Automation Industry Revenue Million Forecast, by Country 2019 & 2032
- Table 37: Global AR Automation Industry Revenue Million Forecast, by Component 2019 & 2032
- Table 38: Global AR Automation Industry Revenue Million Forecast, by Deployment Mode 2019 & 2032
- Table 39: Global AR Automation Industry Revenue Million Forecast, by Size of the Organization 2019 & 2032
- Table 40: Global AR Automation Industry Revenue Million Forecast, by End-user Industry 2019 & 2032
- Table 41: Global AR Automation Industry Revenue Million Forecast, by Country 2019 & 2032
- Table 42: Global AR Automation Industry Revenue Million Forecast, by Component 2019 & 2032
- Table 43: Global AR Automation Industry Revenue Million Forecast, by Deployment Mode 2019 & 2032
- Table 44: Global AR Automation Industry Revenue Million Forecast, by Size of the Organization 2019 & 2032
- Table 45: Global AR Automation Industry Revenue Million Forecast, by End-user Industry 2019 & 2032
- Table 46: Global AR Automation Industry Revenue Million Forecast, by Country 2019 & 2032
Frequently Asked Questions
1. What is the projected Compound Annual Growth Rate (CAGR) of the AR Automation Industry?
The projected CAGR is approximately 11.84%.
2. Which companies are prominent players in the AR Automation Industry?
Key companies in the market include Workday Inc, Corcentric LLC, HighRadius Corporation, Bill com Holdings Inc, Kofax Inc, Qvalia AB, Quadient (YayPay Inc ), Esker Inc *List Not Exhaustive, Oracle Corporation, Comarch SA, MHC Automation, SK Global Software, SAP SE.
3. What are the main segments of the AR Automation Industry?
The market segments include Component, Deployment Mode, Size of the Organization, End-user Industry.
4. Can you provide details about the market size?
The market size is estimated to be USD 3.04 Million as of 2022.
5. What are some drivers contributing to market growth?
Improve Business Efficiency by Improving Cash Flow and Reducing Costs and Accounting Cycle Time; Increasing Adoption of Technologies like Cloud Computing and AI.
6. What are the notable trends driving market growth?
Increasing Adoption of Technologies Such as Cloud Computing and AI.
7. Are there any restraints impacting market growth?
Complex Procedure of Invoicing and Payment Management; Privacy and Security Concerns.
8. Can you provide examples of recent developments in the market?
September 2022 - Regate, a Paris-based Software-as-a-Service (SaaS) platform for finance automation, secured a USD 20 million Series A funding round led by Valar Ventures. By automating repetitive operations, compiling financial data onto a single platform, and enhancing team communication, Regate assists accounting firms and finance departments in saving time. The platform used by Regate offers features including virtual and physical bank cards, payments, reconciliation, accounts payable and receivable, and budget and purchase requests. The company would use this money to expand its business further by developing software for small and medium enterprises.
9. What pricing options are available for accessing the report?
Pricing options include single-user, multi-user, and enterprise licenses priced at USD 4750, USD 5250, and USD 8750 respectively.
10. Is the market size provided in terms of value or volume?
The market size is provided in terms of value, measured in Million.
11. Are there any specific market keywords associated with the report?
Yes, the market keyword associated with the report is "AR Automation Industry," which aids in identifying and referencing the specific market segment covered.
12. How do I determine which pricing option suits my needs best?
The pricing options vary based on user requirements and access needs. Individual users may opt for single-user licenses, while businesses requiring broader access may choose multi-user or enterprise licenses for cost-effective access to the report.
13. Are there any additional resources or data provided in the AR Automation Industry report?
While the report offers comprehensive insights, it's advisable to review the specific contents or supplementary materials provided to ascertain if additional resources or data are available.
14. How can I stay updated on further developments or reports in the AR Automation Industry?
To stay informed about further developments, trends, and reports in the AR Automation Industry, consider subscribing to industry newsletters, following relevant companies and organizations, or regularly checking reputable industry news sources and publications.
Methodology
Step 1 - Identification of Relevant Samples Size from Population Database


Step 2 - Approaches for Defining Global Market Size (Value, Volume* & Price*)

Note*: In applicable scenarios
Step 3 - Data Sources
Primary Research
- Web Analytics
- Survey Reports
- Research Institute
- Latest Research Reports
- Opinion Leaders
Secondary Research
- Annual Reports
- White Paper
- Latest Press Release
- Industry Association
- Paid Database
- Investor Presentations

Step 4 - Data Triangulation
Involves using different sources of information in order to increase the validity of a study
These sources are likely to be stakeholders in a program - participants, other researchers, program staff, other community members, and so on.
Then we put all data in single framework & apply various statistical tools to find out the dynamic on the market.
During the analysis stage, feedback from the stakeholder groups would be compared to determine areas of agreement as well as areas of divergence


