
Key Insights
The Asia-Pacific low-calorie sweeteners market is experiencing robust growth, driven by increasing health consciousness and the rising prevalence of diabetes and obesity across the region. The market's expansion is fueled by the escalating demand for healthier food and beverage options, particularly in rapidly developing economies like India and China. Consumers are increasingly opting for low-calorie alternatives to sugar, leading to heightened demand for sweeteners such as stevia, sucralose, and aspartame. The diverse product portfolio, including various natural and artificial sweeteners, caters to a wide range of consumer preferences and dietary needs. Furthermore, the burgeoning food and beverage industry, coupled with the increasing adoption of low-calorie sweeteners in pharmaceutical and other applications, is significantly contributing to market expansion. The preference for natural sweeteners like stevia is growing steadily due to increasing awareness of the potential health benefits and perceived safety compared to artificial counterparts. However, consumer concerns regarding the long-term effects of certain artificial sweeteners and fluctuating raw material prices present challenges to market growth.
Despite these challenges, the market is expected to maintain a strong trajectory, with substantial growth opportunities arising from product innovation, expansion into emerging markets within the Asia-Pacific region, and strategic partnerships between manufacturers and food and beverage companies. Key players are focusing on developing innovative products with improved taste and functionality to address consumer preferences and overcome potential limitations of existing offerings. The Asia-Pacific region’s significant population size and the increasing disposable incomes, particularly in urban areas, further enhance the market's future potential. A proactive approach to addressing regulatory hurdles and consumer perception regarding artificial sweeteners is crucial for sustained market growth. Continued research and development focused on creating healthier and more palatable options will significantly impact future market trends. While precise market segmentation data for all sub-categories is unavailable, the provided information indicates that the food and beverage sector forms a dominant application segment.
Asia-Pacific Low-Calorie Sweeteners Market Report: A Comprehensive Analysis (2019-2033)
This comprehensive report provides an in-depth analysis of the Asia-Pacific low-calorie sweeteners market, offering invaluable insights for industry professionals, investors, and strategic decision-makers. Covering the period from 2019 to 2033, with a focus on 2025, this report meticulously examines market dynamics, segmentation, key players, and future growth prospects. The report leverages extensive data analysis to forecast market trends, identify emerging opportunities, and highlight potential challenges.
Asia-Pacific Low-Calorie Sweeteners Market Structure & Innovation Trends
This section analyzes the competitive landscape, encompassing market concentration, innovation drivers, regulatory frameworks, product substitutes, end-user demographics, and mergers and acquisitions (M&A) activities within the Asia-Pacific low-calorie sweeteners market. The market is moderately concentrated, with key players holding significant shares. However, the emergence of smaller, innovative companies is challenging the established players.
Market Concentration: The top five players hold approximately xx% of the market share in 2025, indicating a moderately concentrated market. Further analysis reveals that market share varies significantly across different segments.
Innovation Drivers: Growing consumer health consciousness, coupled with increasing demand for healthier food and beverage options, is a major driver of innovation. The development of novel sweeteners with improved taste profiles and functional properties is crucial for market growth. Regulatory changes and evolving consumer preferences are also influencing innovation strategies.
Regulatory Frameworks: Varying regulatory frameworks across different countries in the Asia-Pacific region impact market dynamics. Stringent regulations regarding the use of artificial sweeteners are influencing the market share of natural sweeteners.
Product Substitutes: The market faces competition from traditional caloric sweeteners like sugar, although the growing awareness of health risks associated with high sugar intake is driving the shift towards low-calorie alternatives.
End-User Demographics: The rising middle class and increasing disposable incomes in several Asia-Pacific countries contribute significantly to the growing demand for low-calorie sweeteners. The target demographic is broad, encompassing individuals concerned about weight management, health, and dietary restrictions.
M&A Activities: The Asia-Pacific low-calorie sweeteners market has witnessed several mergers and acquisitions in recent years, with deal values reaching approximately xx Million in 2024. These strategic moves reflect the consolidation and competitive intensity within the market. Examples include [mention specific M&A deals if available, and their estimated values].
Asia-Pacific Low-Calorie Sweeteners Market Dynamics & Trends
This section delves into the key market dynamics shaping the Asia-Pacific low-calorie sweeteners market. The market is experiencing robust growth, driven by factors such as the increasing prevalence of obesity and diabetes, the rising consumer preference for healthier food and beverage options, and advancements in sweetener technology.
The market exhibits a Compound Annual Growth Rate (CAGR) of approximately xx% during the forecast period (2025-2033). Market penetration is highest in urban areas and amongst health-conscious consumers. Technological advancements, such as the development of novel sweeteners with improved taste and functionality, are further boosting market growth. However, fluctuating raw material prices and consumer concerns about the safety and long-term health effects of certain artificial sweeteners pose challenges to the market's growth trajectory. Competitive dynamics are characterized by intense rivalry among established players and the emergence of new entrants with innovative products. The market is also influenced by changing consumer preferences, which are increasingly towards natural and sustainably sourced sweeteners.
Dominant Regions & Segments in Asia-Pacific Low-Calorie Sweeteners Market
This section identifies the leading regions and segments within the Asia-Pacific low-calorie sweeteners market.
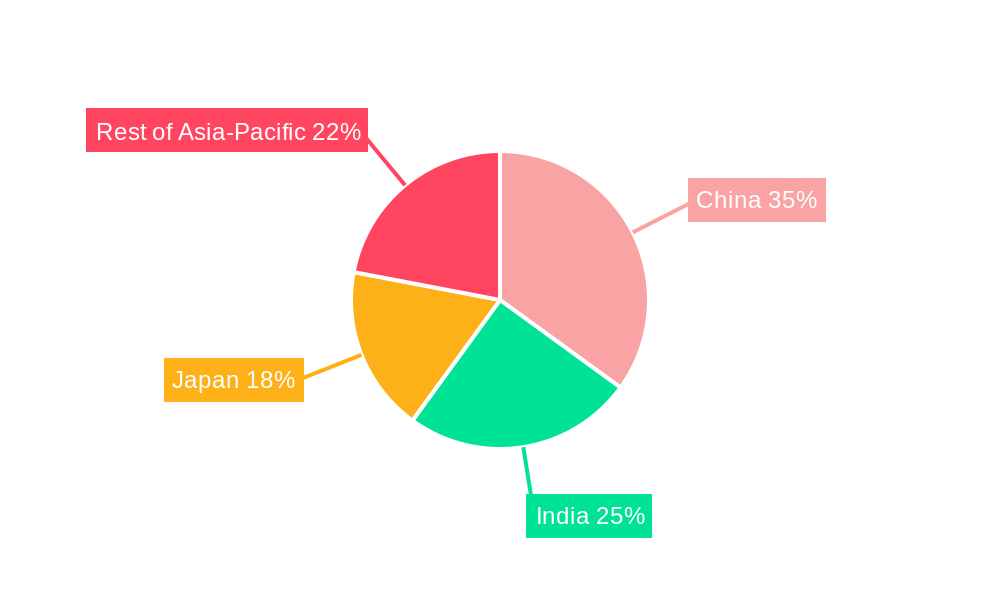
By Country: China and India are the dominant markets, driven by their large populations, rising incomes, and increasing awareness of health and wellness. Japan, with its mature market and sophisticated consumer base, also holds a significant market share. Australia demonstrates relatively high per capita consumption.
By Source Type: The natural sweetener segment is experiencing faster growth compared to the artificial sweetener segment due to increased consumer preference for natural and healthier alternatives.
By Product Type: Stevia holds a leading position among various product types due to its natural origin and growing popularity. Sucralose, saccharin, and aspartame also maintain significant market share.
By Application: The food and beverage industry remains the primary application segment, with a high share of low-calorie sweeteners used in processed foods, beverages, and confectionery products.
Key Drivers:
China and India: Rapid economic growth, rising disposable incomes, and expanding middle class.
Japan: Sophisticated consumer base with high demand for high-quality and functional foods.
Australia: High per capita consumption and adoption of healthy lifestyles.
Natural Sweeteners: Growing consumer awareness of health benefits and preference for natural ingredients.
Asia-Pacific Low-Calorie Sweeteners Market Product Innovations
Recent product innovations focus on improving the taste and functionality of low-calorie sweeteners. This includes developing sweeteners with enhanced sweetness profiles, reduced aftertaste, and improved stability in various food and beverage applications. Technological advancements like enzyme engineering and fermentation processes are being employed to enhance sweetener production efficiency and sustainability. Innovations emphasize meeting evolving consumer preferences and addressing regulatory requirements. Companies are launching new products and formulations to cater to the specific needs of different consumer segments.
Report Scope & Segmentation Analysis
This report offers a comprehensive analysis of the Asia-Pacific low-calorie sweeteners market, segmented by source type (natural, artificial), product type (sucralose, saccharin, aspartame, neotame, advantame, acesulfame potassium, stevia, others), application (food, beverage, pharmaceuticals, others), and country (India, China, Japan, Australia, Rest of Asia-Pacific). Each segment's growth projections, market sizes, and competitive dynamics are analyzed to provide a thorough understanding of the market landscape. The report covers the historical period (2019-2024), the base year (2025), and the forecast period (2025-2033). Market size values are provided in Million.
Key Drivers of Asia-Pacific Low-Calorie Sweeteners Market Growth
The Asia-Pacific low-calorie sweeteners market is experiencing substantial growth due to several factors. The rising prevalence of lifestyle diseases like obesity and diabetes fuels the demand for healthier alternatives to traditional sugar. The expanding middle class and increasing disposable incomes in several countries contribute to higher consumption of processed foods and beverages, which often contain low-calorie sweeteners. Government regulations promoting healthier food choices also influence market growth. Technological advancements lead to better-tasting and more functional sweeteners, expanding market applications.
Challenges in the Asia-Pacific Low-Calorie Sweeteners Market Sector
Despite its growth potential, the Asia-Pacific low-calorie sweeteners market faces certain challenges. Varying regulatory landscapes across countries necessitate compliance with different standards, increasing costs for manufacturers. Fluctuations in the prices of raw materials used in sweetener production affect profitability. Concerns regarding the long-term health effects of certain artificial sweeteners impact consumer perception and acceptance. Intense competition from established players and new entrants creates a challenging environment.
Emerging Opportunities in Asia-Pacific Low-Calorie Sweeteners Market
The Asia-Pacific low-calorie sweeteners market presents several emerging opportunities. The growing demand for natural sweeteners opens avenues for innovative products derived from natural sources. The expansion of the food and beverage industry in developing economies offers significant market potential. Advancements in sweetener technology lead to novel sweeteners with enhanced functional properties. Increasing consumer awareness of health and wellness creates demand for healthier and more functional food options, including those sweetened with low-calorie alternatives.
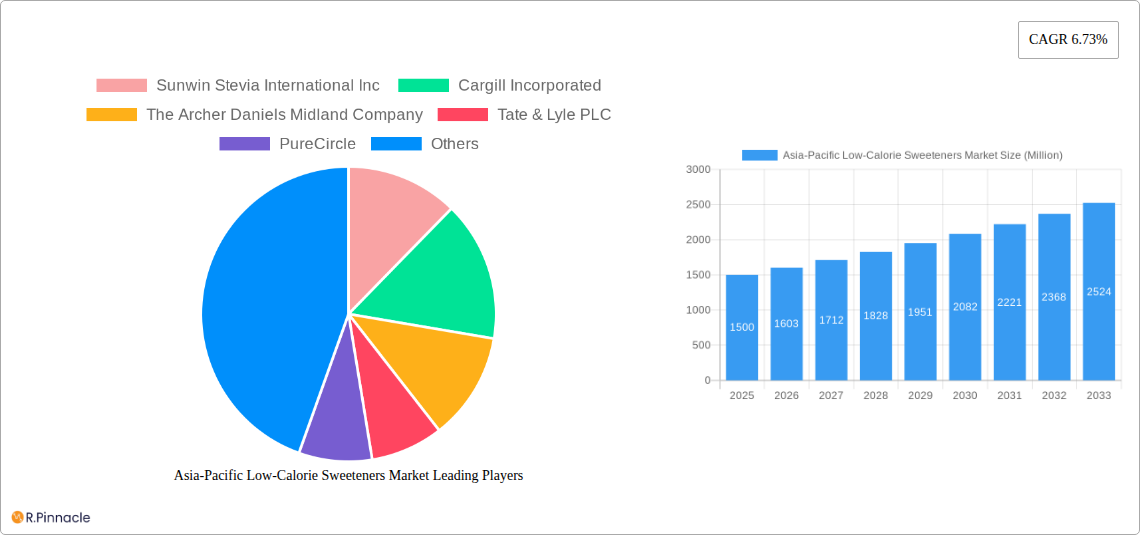
Leading Players in the Asia-Pacific Low-Calorie Sweeteners Market Market
- Sunwin Stevia International Inc
- Cargill Incorporated
- The Archer Daniels Midland Company
- Tate & Lyle PLC
- PureCircle
- Ingredion Incorporated
- Biolotus Technology Lasa Inc
- Roquette Freres
Key Developments in Asia-Pacific Low-Calorie Sweeteners Market Industry
- [Month, Year]: [Company Name] launches a new stevia-based sweetener with improved taste.
- [Month, Year]: [Company Name] acquires a smaller competitor, expanding its market share.
- [Month, Year]: New regulations regarding artificial sweeteners are implemented in [Country].
- [Month, Year]: [Company Name] invests in a new production facility to increase capacity.
Future Outlook for Asia-Pacific Low-Calorie Sweeteners Market Market
The Asia-Pacific low-calorie sweeteners market is poised for continued growth, driven by a confluence of factors, including the increasing prevalence of lifestyle-related diseases, evolving consumer preferences, and technological advancements in sweetener production. The focus on natural and sustainable sweeteners will continue to drive innovation, while strategic partnerships and mergers and acquisitions will reshape the competitive landscape. The market's future hinges on adapting to evolving consumer needs and regulatory requirements, with opportunities arising in novel sweetener technologies and expanding market penetration in untapped regions.
Asia-Pacific Low-Calorie Sweeteners Market Segmentation
-
1. Source Type
- 1.1. Natural
- 1.2. Artificial
-
2. Product Type
- 2.1. Sucralose
- 2.2. Saccharin
- 2.3. Aspartame
- 2.4. Neotame
- 2.5. Advantame
- 2.6. Acesulfame Potassium
- 2.7. Stevia
- 2.8. Others
-
3. Application
-
3.1. Food
- 3.1.1. Dairy and Frozen Foods
- 3.1.2. Confectionery
- 3.1.3. Bakery
- 3.1.4. Others
- 3.2. Beverage
- 3.3. Pharmaceuticals
-
3.1. Food
Asia-Pacific Low-Calorie Sweeteners Market Segmentation By Geography
-
1. Asia Pacific
- 1.1. China
- 1.2. Japan
- 1.3. South Korea
- 1.4. India
- 1.5. Australia
- 1.6. New Zealand
- 1.7. Indonesia
- 1.8. Malaysia
- 1.9. Singapore
- 1.10. Thailand
- 1.11. Vietnam
- 1.12. Philippines
Asia-Pacific Low-Calorie Sweeteners Market REPORT HIGHLIGHTS
| Aspects | Details |
|---|---|
| Study Period | 2019-2033 |
| Base Year | 2024 |
| Estimated Year | 2025 |
| Forecast Period | 2025-2033 |
| Historical Period | 2019-2024 |
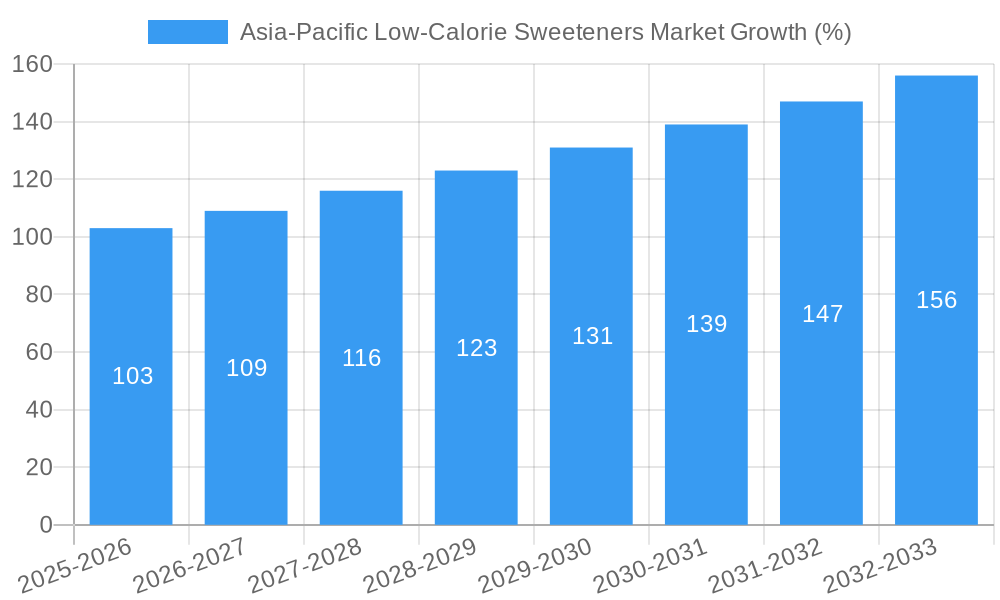
| Growth Rate | CAGR of 6.73% from 2019-2033 |
| Segmentation |
|
Table of Contents
- 1. Introduction
- 1.1. Research Scope
- 1.2. Market Segmentation
- 1.3. Research Methodology
- 1.4. Definitions and Assumptions
- 2. Executive Summary
- 2.1. Introduction
- 3. Market Dynamics
- 3.1. Introduction
- 3.2. Market Drivers
- 3.2.1. Rising Application in Dietary Supplements
- 3.3. Market Restrains
- 3.3.1. Increasing prevalence of hydroglycemia
- 3.4. Market Trends
- 3.4.1. Growing Application of Stevia by the Beverage Manufacturers
- 4. Market Factor Analysis
- 4.1. Porters Five Forces
- 4.2. Supply/Value Chain
- 4.3. PESTEL analysis
- 4.4. Market Entropy
- 4.5. Patent/Trademark Analysis
- 5. Asia-Pacific Low-Calorie Sweeteners Market Analysis, Insights and Forecast, 2019-2031
- 5.1. Market Analysis, Insights and Forecast - by Source Type
- 5.1.1. Natural
- 5.1.2. Artificial
- 5.2. Market Analysis, Insights and Forecast - by Product Type
- 5.2.1. Sucralose
- 5.2.2. Saccharin
- 5.2.3. Aspartame
- 5.2.4. Neotame
- 5.2.5. Advantame
- 5.2.6. Acesulfame Potassium
- 5.2.7. Stevia
- 5.2.8. Others
- 5.3. Market Analysis, Insights and Forecast - by Application
- 5.3.1. Food
- 5.3.1.1. Dairy and Frozen Foods
- 5.3.1.2. Confectionery
- 5.3.1.3. Bakery
- 5.3.1.4. Others
- 5.3.2. Beverage
- 5.3.3. Pharmaceuticals
- 5.3.1. Food
- 5.4. Market Analysis, Insights and Forecast - by Region
- 5.4.1. Asia Pacific
- 5.1. Market Analysis, Insights and Forecast - by Source Type
- 6. China Asia-Pacific Low-Calorie Sweeteners Market Analysis, Insights and Forecast, 2019-2031
- 7. Japan Asia-Pacific Low-Calorie Sweeteners Market Analysis, Insights and Forecast, 2019-2031
- 8. India Asia-Pacific Low-Calorie Sweeteners Market Analysis, Insights and Forecast, 2019-2031
- 9. South Korea Asia-Pacific Low-Calorie Sweeteners Market Analysis, Insights and Forecast, 2019-2031
- 10. Taiwan Asia-Pacific Low-Calorie Sweeteners Market Analysis, Insights and Forecast, 2019-2031
- 11. Australia Asia-Pacific Low-Calorie Sweeteners Market Analysis, Insights and Forecast, 2019-2031
- 12. Rest of Asia-Pacific Asia-Pacific Low-Calorie Sweeteners Market Analysis, Insights and Forecast, 2019-2031
- 13. Competitive Analysis
- 13.1. Market Share Analysis 2024
- 13.2. Company Profiles
- 13.2.1 Sunwin Stevia International Inc
- 13.2.1.1. Overview
- 13.2.1.2. Products
- 13.2.1.3. SWOT Analysis
- 13.2.1.4. Recent Developments
- 13.2.1.5. Financials (Based on Availability)
- 13.2.2 Cargill Incorporated
- 13.2.2.1. Overview
- 13.2.2.2. Products
- 13.2.2.3. SWOT Analysis
- 13.2.2.4. Recent Developments
- 13.2.2.5. Financials (Based on Availability)
- 13.2.3 The Archer Daniels Midland Company
- 13.2.3.1. Overview
- 13.2.3.2. Products
- 13.2.3.3. SWOT Analysis
- 13.2.3.4. Recent Developments
- 13.2.3.5. Financials (Based on Availability)
- 13.2.4 Tate & Lyle PLC
- 13.2.4.1. Overview
- 13.2.4.2. Products
- 13.2.4.3. SWOT Analysis
- 13.2.4.4. Recent Developments
- 13.2.4.5. Financials (Based on Availability)
- 13.2.5 PureCircle
- 13.2.5.1. Overview
- 13.2.5.2. Products
- 13.2.5.3. SWOT Analysis
- 13.2.5.4. Recent Developments
- 13.2.5.5. Financials (Based on Availability)
- 13.2.6 Ingredion Incorporated
- 13.2.6.1. Overview
- 13.2.6.2. Products
- 13.2.6.3. SWOT Analysis
- 13.2.6.4. Recent Developments
- 13.2.6.5. Financials (Based on Availability)
- 13.2.7 Biolotus Technology Lasa Inc
- 13.2.7.1. Overview
- 13.2.7.2. Products
- 13.2.7.3. SWOT Analysis
- 13.2.7.4. Recent Developments
- 13.2.7.5. Financials (Based on Availability)
- 13.2.8 Roquette Freres
- 13.2.8.1. Overview
- 13.2.8.2. Products
- 13.2.8.3. SWOT Analysis
- 13.2.8.4. Recent Developments
- 13.2.8.5. Financials (Based on Availability)
- 13.2.1 Sunwin Stevia International Inc
List of Figures
- Figure 1: Asia-Pacific Low-Calorie Sweeteners Market Revenue Breakdown (Million, %) by Product 2024 & 2032
- Figure 2: Asia-Pacific Low-Calorie Sweeteners Market Share (%) by Company 2024
List of Tables
- Table 1: Asia-Pacific Low-Calorie Sweeteners Market Revenue Million Forecast, by Region 2019 & 2032
- Table 2: Asia-Pacific Low-Calorie Sweeteners Market Volume K Tons Forecast, by Region 2019 & 2032
- Table 3: Asia-Pacific Low-Calorie Sweeteners Market Revenue Million Forecast, by Source Type 2019 & 2032
- Table 4: Asia-Pacific Low-Calorie Sweeteners Market Volume K Tons Forecast, by Source Type 2019 & 2032
- Table 5: Asia-Pacific Low-Calorie Sweeteners Market Revenue Million Forecast, by Product Type 2019 & 2032
- Table 6: Asia-Pacific Low-Calorie Sweeteners Market Volume K Tons Forecast, by Product Type 2019 & 2032
- Table 7: Asia-Pacific Low-Calorie Sweeteners Market Revenue Million Forecast, by Application 2019 & 2032
- Table 8: Asia-Pacific Low-Calorie Sweeteners Market Volume K Tons Forecast, by Application 2019 & 2032
- Table 9: Asia-Pacific Low-Calorie Sweeteners Market Revenue Million Forecast, by Region 2019 & 2032
- Table 10: Asia-Pacific Low-Calorie Sweeteners Market Volume K Tons Forecast, by Region 2019 & 2032
- Table 11: Asia-Pacific Low-Calorie Sweeteners Market Revenue Million Forecast, by Country 2019 & 2032
- Table 12: Asia-Pacific Low-Calorie Sweeteners Market Volume K Tons Forecast, by Country 2019 & 2032
- Table 13: China Asia-Pacific Low-Calorie Sweeteners Market Revenue (Million) Forecast, by Application 2019 & 2032
- Table 14: China Asia-Pacific Low-Calorie Sweeteners Market Volume (K Tons) Forecast, by Application 2019 & 2032
- Table 15: Japan Asia-Pacific Low-Calorie Sweeteners Market Revenue (Million) Forecast, by Application 2019 & 2032
- Table 16: Japan Asia-Pacific Low-Calorie Sweeteners Market Volume (K Tons) Forecast, by Application 2019 & 2032
- Table 17: India Asia-Pacific Low-Calorie Sweeteners Market Revenue (Million) Forecast, by Application 2019 & 2032
- Table 18: India Asia-Pacific Low-Calorie Sweeteners Market Volume (K Tons) Forecast, by Application 2019 & 2032
- Table 19: South Korea Asia-Pacific Low-Calorie Sweeteners Market Revenue (Million) Forecast, by Application 2019 & 2032
- Table 20: South Korea Asia-Pacific Low-Calorie Sweeteners Market Volume (K Tons) Forecast, by Application 2019 & 2032
- Table 21: Taiwan Asia-Pacific Low-Calorie Sweeteners Market Revenue (Million) Forecast, by Application 2019 & 2032
- Table 22: Taiwan Asia-Pacific Low-Calorie Sweeteners Market Volume (K Tons) Forecast, by Application 2019 & 2032
- Table 23: Australia Asia-Pacific Low-Calorie Sweeteners Market Revenue (Million) Forecast, by Application 2019 & 2032
- Table 24: Australia Asia-Pacific Low-Calorie Sweeteners Market Volume (K Tons) Forecast, by Application 2019 & 2032
- Table 25: Rest of Asia-Pacific Asia-Pacific Low-Calorie Sweeteners Market Revenue (Million) Forecast, by Application 2019 & 2032
- Table 26: Rest of Asia-Pacific Asia-Pacific Low-Calorie Sweeteners Market Volume (K Tons) Forecast, by Application 2019 & 2032
- Table 27: Asia-Pacific Low-Calorie Sweeteners Market Revenue Million Forecast, by Source Type 2019 & 2032
- Table 28: Asia-Pacific Low-Calorie Sweeteners Market Volume K Tons Forecast, by Source Type 2019 & 2032
- Table 29: Asia-Pacific Low-Calorie Sweeteners Market Revenue Million Forecast, by Product Type 2019 & 2032
- Table 30: Asia-Pacific Low-Calorie Sweeteners Market Volume K Tons Forecast, by Product Type 2019 & 2032
- Table 31: Asia-Pacific Low-Calorie Sweeteners Market Revenue Million Forecast, by Application 2019 & 2032
- Table 32: Asia-Pacific Low-Calorie Sweeteners Market Volume K Tons Forecast, by Application 2019 & 2032
- Table 33: Asia-Pacific Low-Calorie Sweeteners Market Revenue Million Forecast, by Country 2019 & 2032
- Table 34: Asia-Pacific Low-Calorie Sweeteners Market Volume K Tons Forecast, by Country 2019 & 2032
- Table 35: China Asia-Pacific Low-Calorie Sweeteners Market Revenue (Million) Forecast, by Application 2019 & 2032
- Table 36: China Asia-Pacific Low-Calorie Sweeteners Market Volume (K Tons) Forecast, by Application 2019 & 2032
- Table 37: Japan Asia-Pacific Low-Calorie Sweeteners Market Revenue (Million) Forecast, by Application 2019 & 2032
- Table 38: Japan Asia-Pacific Low-Calorie Sweeteners Market Volume (K Tons) Forecast, by Application 2019 & 2032
- Table 39: South Korea Asia-Pacific Low-Calorie Sweeteners Market Revenue (Million) Forecast, by Application 2019 & 2032
- Table 40: South Korea Asia-Pacific Low-Calorie Sweeteners Market Volume (K Tons) Forecast, by Application 2019 & 2032
- Table 41: India Asia-Pacific Low-Calorie Sweeteners Market Revenue (Million) Forecast, by Application 2019 & 2032
- Table 42: India Asia-Pacific Low-Calorie Sweeteners Market Volume (K Tons) Forecast, by Application 2019 & 2032
- Table 43: Australia Asia-Pacific Low-Calorie Sweeteners Market Revenue (Million) Forecast, by Application 2019 & 2032
- Table 44: Australia Asia-Pacific Low-Calorie Sweeteners Market Volume (K Tons) Forecast, by Application 2019 & 2032
- Table 45: New Zealand Asia-Pacific Low-Calorie Sweeteners Market Revenue (Million) Forecast, by Application 2019 & 2032
- Table 46: New Zealand Asia-Pacific Low-Calorie Sweeteners Market Volume (K Tons) Forecast, by Application 2019 & 2032
- Table 47: Indonesia Asia-Pacific Low-Calorie Sweeteners Market Revenue (Million) Forecast, by Application 2019 & 2032
- Table 48: Indonesia Asia-Pacific Low-Calorie Sweeteners Market Volume (K Tons) Forecast, by Application 2019 & 2032
- Table 49: Malaysia Asia-Pacific Low-Calorie Sweeteners Market Revenue (Million) Forecast, by Application 2019 & 2032
- Table 50: Malaysia Asia-Pacific Low-Calorie Sweeteners Market Volume (K Tons) Forecast, by Application 2019 & 2032
- Table 51: Singapore Asia-Pacific Low-Calorie Sweeteners Market Revenue (Million) Forecast, by Application 2019 & 2032
- Table 52: Singapore Asia-Pacific Low-Calorie Sweeteners Market Volume (K Tons) Forecast, by Application 2019 & 2032
- Table 53: Thailand Asia-Pacific Low-Calorie Sweeteners Market Revenue (Million) Forecast, by Application 2019 & 2032
- Table 54: Thailand Asia-Pacific Low-Calorie Sweeteners Market Volume (K Tons) Forecast, by Application 2019 & 2032
- Table 55: Vietnam Asia-Pacific Low-Calorie Sweeteners Market Revenue (Million) Forecast, by Application 2019 & 2032
- Table 56: Vietnam Asia-Pacific Low-Calorie Sweeteners Market Volume (K Tons) Forecast, by Application 2019 & 2032
- Table 57: Philippines Asia-Pacific Low-Calorie Sweeteners Market Revenue (Million) Forecast, by Application 2019 & 2032
- Table 58: Philippines Asia-Pacific Low-Calorie Sweeteners Market Volume (K Tons) Forecast, by Application 2019 & 2032
Frequently Asked Questions
1. What is the projected Compound Annual Growth Rate (CAGR) of the Asia-Pacific Low-Calorie Sweeteners Market?
The projected CAGR is approximately 6.73%.
2. Which companies are prominent players in the Asia-Pacific Low-Calorie Sweeteners Market?
Key companies in the market include Sunwin Stevia International Inc , Cargill Incorporated, The Archer Daniels Midland Company, Tate & Lyle PLC, PureCircle, Ingredion Incorporated, Biolotus Technology Lasa Inc, Roquette Freres.
3. What are the main segments of the Asia-Pacific Low-Calorie Sweeteners Market?
The market segments include Source Type, Product Type, Application.
4. Can you provide details about the market size?
The market size is estimated to be USD XX Million as of 2022.
5. What are some drivers contributing to market growth?
Rising Application in Dietary Supplements.
6. What are the notable trends driving market growth?
Growing Application of Stevia by the Beverage Manufacturers.
7. Are there any restraints impacting market growth?
Increasing prevalence of hydroglycemia.
8. Can you provide examples of recent developments in the market?
N/A
9. What pricing options are available for accessing the report?
Pricing options include single-user, multi-user, and enterprise licenses priced at USD 4750, USD 5250, and USD 8750 respectively.
10. Is the market size provided in terms of value or volume?
The market size is provided in terms of value, measured in Million and volume, measured in K Tons.
11. Are there any specific market keywords associated with the report?
Yes, the market keyword associated with the report is "Asia-Pacific Low-Calorie Sweeteners Market," which aids in identifying and referencing the specific market segment covered.
12. How do I determine which pricing option suits my needs best?
The pricing options vary based on user requirements and access needs. Individual users may opt for single-user licenses, while businesses requiring broader access may choose multi-user or enterprise licenses for cost-effective access to the report.
13. Are there any additional resources or data provided in the Asia-Pacific Low-Calorie Sweeteners Market report?
While the report offers comprehensive insights, it's advisable to review the specific contents or supplementary materials provided to ascertain if additional resources or data are available.
14. How can I stay updated on further developments or reports in the Asia-Pacific Low-Calorie Sweeteners Market?
To stay informed about further developments, trends, and reports in the Asia-Pacific Low-Calorie Sweeteners Market, consider subscribing to industry newsletters, following relevant companies and organizations, or regularly checking reputable industry news sources and publications.
Methodology
Step 1 - Identification of Relevant Samples Size from Population Database


Step 2 - Approaches for Defining Global Market Size (Value, Volume* & Price*)

Note*: In applicable scenarios
Step 3 - Data Sources
Primary Research
- Web Analytics
- Survey Reports
- Research Institute
- Latest Research Reports
- Opinion Leaders
Secondary Research
- Annual Reports
- White Paper
- Latest Press Release
- Industry Association
- Paid Database
- Investor Presentations

Step 4 - Data Triangulation
Involves using different sources of information in order to increase the validity of a study
These sources are likely to be stakeholders in a program - participants, other researchers, program staff, other community members, and so on.
Then we put all data in single framework & apply various statistical tools to find out the dynamic on the market.
During the analysis stage, feedback from the stakeholder groups would be compared to determine areas of agreement as well as areas of divergence


