
Key Insights
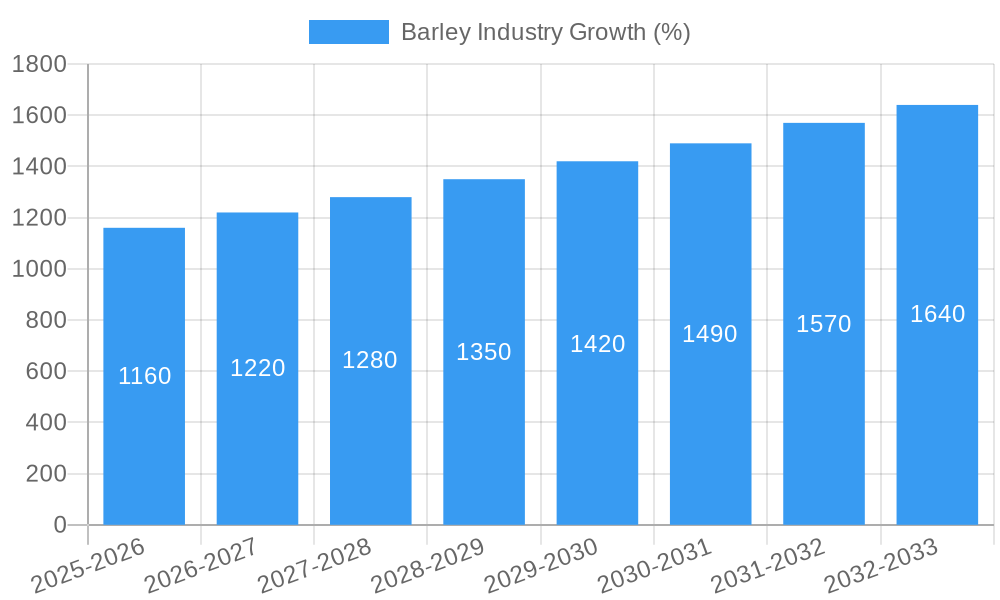
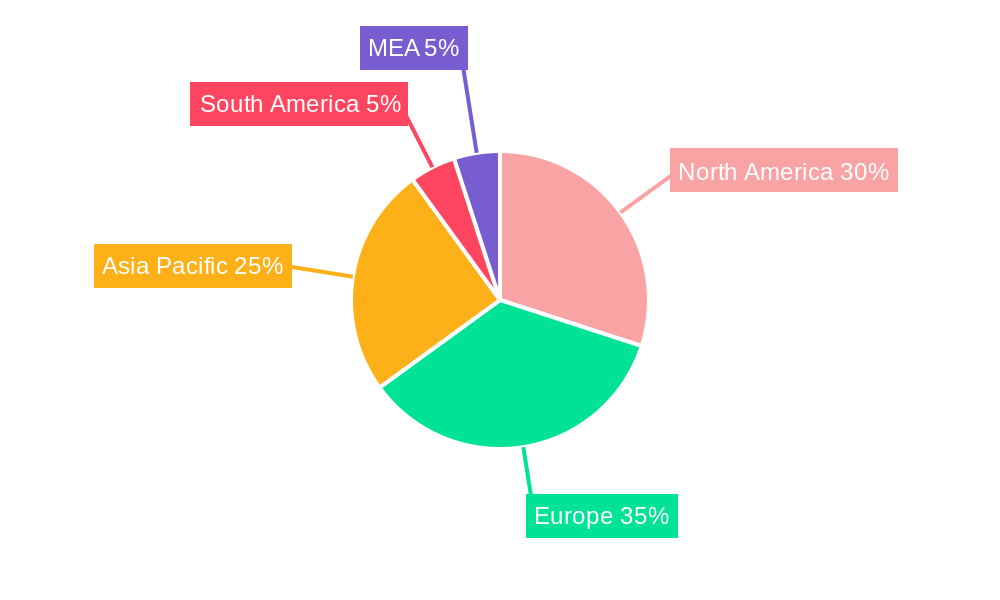
The global barley market, valued at $24.62 billion in 2025, is projected to experience robust growth, driven primarily by increasing demand from the food and beverage, feed, and brewing industries. A compound annual growth rate (CAGR) of 4.73% from 2025 to 2033 indicates a significant market expansion. The rising global population and the consequent surge in demand for food and animal feed are key contributors to this growth. Furthermore, the growing preference for barley-based products due to their nutritional value and health benefits fuels market expansion. The malting barley segment holds a substantial market share, owing to its extensive use in brewing and distilling alcoholic beverages. Geographically, North America and Europe currently dominate the market, but the Asia-Pacific region is expected to witness substantial growth due to increasing consumption and expanding agricultural practices. However, factors like fluctuating barley prices, susceptibility to climate change affecting crop yields, and the emergence of substitute grains pose potential challenges to market growth. The competitive landscape is characterized by large multinational companies and regional players, with competition primarily focused on pricing, quality, and supply chain efficiency. Strategic partnerships and investments in research and development to improve barley varieties and processing techniques are expected to shape the industry's future.
The segmentation of the barley market by application (food and beverage, feed, seed) and product type (malting barley, feed barley, food barley, seed barley) allows for a nuanced understanding of market dynamics. The food and beverage segment's growth is linked to the increasing popularity of barley-based foods and beverages, such as beer, malt extracts, and barley flour. The feed segment's growth is driven by the rising demand for animal feed, especially for livestock and poultry. Within product types, malting barley commands a significant share due to the brewing industry's reliance on high-quality malting barley. Regional variations in demand and production influence the market's geographic distribution. While North America and Europe remain key players, the Asia-Pacific region is anticipated to become a significant growth driver due to rising disposable incomes, increased urbanization, and changes in dietary habits.

Barley Industry Market Report: 2019-2033
This comprehensive report provides an in-depth analysis of the global barley industry, offering invaluable insights for industry professionals, investors, and stakeholders. Covering the period from 2019 to 2033, with a focus on 2025, this report meticulously examines market dynamics, segmentation, key players, and future trends. The global barley market is projected to reach xx Million by 2033, presenting significant growth opportunities.
Barley Industry Market Structure & Innovation Trends
This section analyzes the competitive landscape of the barley industry, encompassing market concentration, innovation drivers, regulatory frameworks, and M&A activities. The market is characterized by a mix of large multinational corporations and smaller regional players. Major players like Cargill, Malteurop, Soufflet Group, Boortmalt, and Rahr Malting hold significant market share, estimated at xx Million in 2025.
- Market Concentration: The industry exhibits moderate concentration, with the top five players controlling approximately xx% of the global market.
- Innovation Drivers: Technological advancements in breeding techniques, precision agriculture, and malting processes are key innovation drivers. These innovations aim to improve yield, quality, and sustainability.
- Regulatory Frameworks: Government policies regarding agricultural subsidies, trade regulations, and environmental standards significantly influence market dynamics. The European Commission's new Common Agricultural Policy (CAP) is a prime example, aiming for sustainable agricultural practices.
- Product Substitutes: Other grains like wheat, oats, and corn compete with barley, particularly in the feed segment.
- M&A Activities: Consolidation through mergers and acquisitions is expected to continue, driven by economies of scale and expansion into new markets. Total M&A deal value in the historical period (2019-2024) is estimated at xx Million.
Barley Industry Market Dynamics & Trends
This section explores the key factors driving market growth, including technological advancements, evolving consumer preferences, and competitive dynamics. The global barley market is anticipated to experience a Compound Annual Growth Rate (CAGR) of xx% during the forecast period (2025-2033).
Market growth is fueled by increasing demand from the food and beverage, feed, and brewing industries. Technological disruptions, such as precision agriculture and improved breeding techniques, enhance yield and quality, contributing to market expansion. Consumer preferences for healthier and more sustainable food products are also driving demand for barley-based products. The competitive landscape is dynamic, with companies constantly innovating to gain market share. Market penetration of malting barley in the food and beverage sector is expected to reach xx% by 2033.
Dominant Regions & Segments in Barley Industry
This section identifies leading regions and segments within the barley market. While precise data is unavailable to declare a single dominant region or segment, analysis suggests that Europe and North America are significant players, driven by established agricultural practices and strong demand.
By Application:
- Food and Beverage: This segment dominates, driven by the widespread use of barley in brewing, food processing, and the growing popularity of barley-based health foods.
- Feed: This segment shows consistent growth, driven by increasing livestock production globally.
- Seed: This segment is smaller but crucial for maintaining barley production.
By Product Type:
- Malting Barley: This segment holds a significant share, driven by the demand from the brewing industry.
- Feed Barley: This is a major segment due to its use as animal feed.
- Food Barley: Growing demand for barley in food processing contributes to this segment's growth.
- Seed Barley: This segment is crucial for maintaining future barley production.
Key Drivers: Strong agricultural infrastructure, supportive government policies, and access to advanced technologies contribute significantly to regional dominance.
Barley Industry Product Innovations
Recent product innovations focus on developing barley varieties with improved yield, disease resistance, and nutritional content. Technological advancements in malting processes are improving efficiency and quality. The focus on sustainability is driving innovations in water and fertilizer management within barley production. These innovations are enhancing the competitiveness of barley in various applications.
Report Scope & Segmentation Analysis
This report segments the barley market by application (Food and Beverage, Feed, Seed) and product type (Malting Barley, Feed Barley, Food Barley, Seed Barley). Each segment's market size, growth projections, and competitive dynamics are analyzed. The food and beverage segment is projected to grow at a CAGR of xx% during the forecast period, while the feed segment is expected to grow at xx%. Competitive dynamics vary across segments, with intense competition in the malting barley segment.
Key Drivers of Barley Industry Growth
Several factors drive the growth of the barley industry, including increasing demand from the food and beverage and feed industries, technological advancements in breeding and farming, favorable government policies promoting sustainable agriculture, and the growing global population. The rising preference for healthier and more sustainable food choices further boosts demand for barley-based products.
Challenges in the Barley Industry Sector
Challenges include price volatility due to weather patterns and global market fluctuations, supply chain disruptions, and competition from other grains. Regulatory hurdles related to environmental sustainability and trade policies also pose challenges. These factors can impact profitability and overall market growth. For example, adverse weather conditions in 2024 resulted in a xx% reduction in barley yields in certain regions, impacting supply and prices.
Emerging Opportunities in Barley Industry
Emerging opportunities lie in developing new barley-based products for the food and beverage sector, exploiting the growing demand for functional foods and beverages. Further innovation in breeding and farming technologies will enhance sustainability and yield, while exploring new markets and partnerships will broaden market reach. Furthermore, the potential to utilize barley in biofuel production represents a significant future opportunity.
Leading Players in the Barley Industry Market
Key Developments in Barley Industry
- April 2021: Intergrain's collaboration with Australian universities to enhance barley yield stability showcases commitment to innovation and climate resilience. This development could significantly improve productivity and profitability for barley farmers in the long term.
- January 2023: The European Commission's new CAP aims to support sustainable farming practices and enhance the resilience of the European agricultural sector. This policy change will impact European barley production significantly, influencing farming practices and overall sustainability.
Future Outlook for Barley Industry Market
The barley industry is poised for continued growth driven by increasing global demand, technological advancements enhancing productivity and sustainability, and government policies promoting agricultural development. Strategic partnerships and expansion into new markets will further fuel market expansion and create new opportunities for growth in the coming years. The market's focus on sustainability and the development of high-value barley products will also play a pivotal role in its future success.
Barley Industry Segmentation
- 1. Production Analysis
- 2. Consumption Analysis
- 3. Import Market Analysis (Value & Volume)
- 4. Export Market Analysis (Value & Volume)
- 5. Price Trend Analysis
Barley Industry Segmentation By Geography
-
1. North America
- 1.1. United States
-
2. Europe
- 2.1. Germany
-
3. Asia Pacific
- 3.1. China
-
4. South America
- 4.1. Argentina
- 5. Middle East
- 6. Saudi Arabia
Barley Industry REPORT HIGHLIGHTS
| Aspects | Details |
|---|---|
| Study Period | 2019-2033 |
| Base Year | 2024 |
| Estimated Year | 2025 |
| Forecast Period | 2025-2033 |
| Historical Period | 2019-2024 |
| Growth Rate | CAGR of 4.73% from 2019-2033 |
| Segmentation |
|
Table of Contents
- 1. Introduction
- 1.1. Research Scope
- 1.2. Market Segmentation
- 1.3. Research Methodology
- 1.4. Definitions and Assumptions
- 2. Executive Summary
- 2.1. Introduction
- 3. Market Dynamics
- 3.1. Introduction
- 3.2. Market Drivers
- 3.2.1. Increasing Berry Consumption for Health Benefits; Increasing Adoption of High-Technology Farm Practices; Growing Usage of Berries in the Food and Beverage Industries
- 3.3. Market Restrains
- 3.3.1. High Production Cost Involved in Berry Production; Increasing Disease and Pest Infestations
- 3.4. Market Trends
- 3.4.1. Emerging Applications is Various Industries Led to Growth in Exports
- 4. Market Factor Analysis
- 4.1. Porters Five Forces
- 4.2. Supply/Value Chain
- 4.3. PESTEL analysis
- 4.4. Market Entropy
- 4.5. Patent/Trademark Analysis
- 5. Global Barley Industry Analysis, Insights and Forecast, 2019-2031
- 5.1. Market Analysis, Insights and Forecast - by Production Analysis
- 5.2. Market Analysis, Insights and Forecast - by Consumption Analysis
- 5.3. Market Analysis, Insights and Forecast - by Import Market Analysis (Value & Volume)
- 5.4. Market Analysis, Insights and Forecast - by Export Market Analysis (Value & Volume)
- 5.5. Market Analysis, Insights and Forecast - by Price Trend Analysis
- 5.6. Market Analysis, Insights and Forecast - by Region
- 5.6.1. North America
- 5.6.2. Europe
- 5.6.3. Asia Pacific
- 5.6.4. South America
- 5.6.5. Middle East
- 5.6.6. Saudi Arabia
- 5.1. Market Analysis, Insights and Forecast - by Production Analysis
- 6. North America Barley Industry Analysis, Insights and Forecast, 2019-2031
- 6.1. Market Analysis, Insights and Forecast - by Production Analysis
- 6.2. Market Analysis, Insights and Forecast - by Consumption Analysis
- 6.3. Market Analysis, Insights and Forecast - by Import Market Analysis (Value & Volume)
- 6.4. Market Analysis, Insights and Forecast - by Export Market Analysis (Value & Volume)
- 6.5. Market Analysis, Insights and Forecast - by Price Trend Analysis
- 6.1. Market Analysis, Insights and Forecast - by Production Analysis
- 7. Europe Barley Industry Analysis, Insights and Forecast, 2019-2031
- 7.1. Market Analysis, Insights and Forecast - by Production Analysis
- 7.2. Market Analysis, Insights and Forecast - by Consumption Analysis
- 7.3. Market Analysis, Insights and Forecast - by Import Market Analysis (Value & Volume)
- 7.4. Market Analysis, Insights and Forecast - by Export Market Analysis (Value & Volume)
- 7.5. Market Analysis, Insights and Forecast - by Price Trend Analysis
- 7.1. Market Analysis, Insights and Forecast - by Production Analysis
- 8. Asia Pacific Barley Industry Analysis, Insights and Forecast, 2019-2031
- 8.1. Market Analysis, Insights and Forecast - by Production Analysis
- 8.2. Market Analysis, Insights and Forecast - by Consumption Analysis
- 8.3. Market Analysis, Insights and Forecast - by Import Market Analysis (Value & Volume)
- 8.4. Market Analysis, Insights and Forecast - by Export Market Analysis (Value & Volume)
- 8.5. Market Analysis, Insights and Forecast - by Price Trend Analysis
- 8.1. Market Analysis, Insights and Forecast - by Production Analysis
- 9. South America Barley Industry Analysis, Insights and Forecast, 2019-2031
- 9.1. Market Analysis, Insights and Forecast - by Production Analysis
- 9.2. Market Analysis, Insights and Forecast - by Consumption Analysis
- 9.3. Market Analysis, Insights and Forecast - by Import Market Analysis (Value & Volume)
- 9.4. Market Analysis, Insights and Forecast - by Export Market Analysis (Value & Volume)
- 9.5. Market Analysis, Insights and Forecast - by Price Trend Analysis
- 9.1. Market Analysis, Insights and Forecast - by Production Analysis
- 10. Middle East Barley Industry Analysis, Insights and Forecast, 2019-2031
- 10.1. Market Analysis, Insights and Forecast - by Production Analysis
- 10.2. Market Analysis, Insights and Forecast - by Consumption Analysis
- 10.3. Market Analysis, Insights and Forecast - by Import Market Analysis (Value & Volume)
- 10.4. Market Analysis, Insights and Forecast - by Export Market Analysis (Value & Volume)
- 10.5. Market Analysis, Insights and Forecast - by Price Trend Analysis
- 10.1. Market Analysis, Insights and Forecast - by Production Analysis
- 11. Saudi Arabia Barley Industry Analysis, Insights and Forecast, 2019-2031
- 11.1. Market Analysis, Insights and Forecast - by Production Analysis
- 11.2. Market Analysis, Insights and Forecast - by Consumption Analysis
- 11.3. Market Analysis, Insights and Forecast - by Import Market Analysis (Value & Volume)
- 11.4. Market Analysis, Insights and Forecast - by Export Market Analysis (Value & Volume)
- 11.5. Market Analysis, Insights and Forecast - by Price Trend Analysis
- 11.1. Market Analysis, Insights and Forecast - by Production Analysis
- 12. North America Barley Industry Analysis, Insights and Forecast, 2019-2031
- 12.1. Market Analysis, Insights and Forecast - By Country/Sub-region
- 12.1.1 United States
- 12.1.2 Canada
- 12.1.3 Mexico
- 13. Europe Barley Industry Analysis, Insights and Forecast, 2019-2031
- 13.1. Market Analysis, Insights and Forecast - By Country/Sub-region
- 13.1.1 Germany
- 13.1.2 United Kingdom
- 13.1.3 France
- 13.1.4 Spain
- 13.1.5 Italy
- 13.1.6 Spain
- 13.1.7 Belgium
- 13.1.8 Netherland
- 13.1.9 Nordics
- 13.1.10 Rest of Europe
- 14. Asia Pacific Barley Industry Analysis, Insights and Forecast, 2019-2031
- 14.1. Market Analysis, Insights and Forecast - By Country/Sub-region
- 14.1.1 China
- 14.1.2 Japan
- 14.1.3 India
- 14.1.4 South Korea
- 14.1.5 Southeast Asia
- 14.1.6 Australia
- 14.1.7 Indonesia
- 14.1.8 Phillipes
- 14.1.9 Singapore
- 14.1.10 Thailandc
- 14.1.11 Rest of Asia Pacific
- 15. South America Barley Industry Analysis, Insights and Forecast, 2019-2031
- 15.1. Market Analysis, Insights and Forecast - By Country/Sub-region
- 15.1.1 Brazil
- 15.1.2 Argentina
- 15.1.3 Peru
- 15.1.4 Chile
- 15.1.5 Colombia
- 15.1.6 Ecuador
- 15.1.7 Venezuela
- 15.1.8 Rest of South America
- 16. MEA Barley Industry Analysis, Insights and Forecast, 2019-2031
- 16.1. Market Analysis, Insights and Forecast - By Country/Sub-region
- 16.1.1 United Arab Emirates
- 16.1.2 Saudi Arabia
- 16.1.3 South Africa
- 16.1.4 Rest of Middle East and Africa
- 17. Competitive Analysis
- 17.1. Global Market Share Analysis 2024
- 17.2. Company Profiles
- 17.2.1 Malteurop
- 17.2.1.1. Overview
- 17.2.1.2. Products
- 17.2.1.3. SWOT Analysis
- 17.2.1.4. Recent Developments
- 17.2.1.5. Financials (Based on Availability)
- 17.2.2 Rahr Malting
- 17.2.2.1. Overview
- 17.2.2.2. Products
- 17.2.2.3. SWOT Analysis
- 17.2.2.4. Recent Developments
- 17.2.2.5. Financials (Based on Availability)
- 17.2.3 Soufflet Group
- 17.2.3.1. Overview
- 17.2.3.2. Products
- 17.2.3.3. SWOT Analysis
- 17.2.3.4. Recent Developments
- 17.2.3.5. Financials (Based on Availability)
- 17.2.4 Cargill
- 17.2.4.1. Overview
- 17.2.4.2. Products
- 17.2.4.3. SWOT Analysis
- 17.2.4.4. Recent Developments
- 17.2.4.5. Financials (Based on Availability)
- 17.2.5 Boortmalt
- 17.2.5.1. Overview
- 17.2.5.2. Products
- 17.2.5.3. SWOT Analysis
- 17.2.5.4. Recent Developments
- 17.2.5.5. Financials (Based on Availability)
- 17.2.1 Malteurop
List of Figures
- Figure 1: Global Barley Industry Revenue Breakdown (Million, %) by Region 2024 & 2032
- Figure 2: North America Barley Industry Revenue (Million), by Country 2024 & 2032
- Figure 3: North America Barley Industry Revenue Share (%), by Country 2024 & 2032
- Figure 4: Europe Barley Industry Revenue (Million), by Country 2024 & 2032
- Figure 5: Europe Barley Industry Revenue Share (%), by Country 2024 & 2032
- Figure 6: Asia Pacific Barley Industry Revenue (Million), by Country 2024 & 2032
- Figure 7: Asia Pacific Barley Industry Revenue Share (%), by Country 2024 & 2032
- Figure 8: South America Barley Industry Revenue (Million), by Country 2024 & 2032
- Figure 9: South America Barley Industry Revenue Share (%), by Country 2024 & 2032
- Figure 10: MEA Barley Industry Revenue (Million), by Country 2024 & 2032
- Figure 11: MEA Barley Industry Revenue Share (%), by Country 2024 & 2032
- Figure 12: North America Barley Industry Revenue (Million), by Production Analysis 2024 & 2032
- Figure 13: North America Barley Industry Revenue Share (%), by Production Analysis 2024 & 2032
- Figure 14: North America Barley Industry Revenue (Million), by Consumption Analysis 2024 & 2032
- Figure 15: North America Barley Industry Revenue Share (%), by Consumption Analysis 2024 & 2032
- Figure 16: North America Barley Industry Revenue (Million), by Import Market Analysis (Value & Volume) 2024 & 2032
- Figure 17: North America Barley Industry Revenue Share (%), by Import Market Analysis (Value & Volume) 2024 & 2032
- Figure 18: North America Barley Industry Revenue (Million), by Export Market Analysis (Value & Volume) 2024 & 2032
- Figure 19: North America Barley Industry Revenue Share (%), by Export Market Analysis (Value & Volume) 2024 & 2032
- Figure 20: North America Barley Industry Revenue (Million), by Price Trend Analysis 2024 & 2032
- Figure 21: North America Barley Industry Revenue Share (%), by Price Trend Analysis 2024 & 2032
- Figure 22: North America Barley Industry Revenue (Million), by Country 2024 & 2032
- Figure 23: North America Barley Industry Revenue Share (%), by Country 2024 & 2032
- Figure 24: Europe Barley Industry Revenue (Million), by Production Analysis 2024 & 2032
- Figure 25: Europe Barley Industry Revenue Share (%), by Production Analysis 2024 & 2032
- Figure 26: Europe Barley Industry Revenue (Million), by Consumption Analysis 2024 & 2032
- Figure 27: Europe Barley Industry Revenue Share (%), by Consumption Analysis 2024 & 2032
- Figure 28: Europe Barley Industry Revenue (Million), by Import Market Analysis (Value & Volume) 2024 & 2032
- Figure 29: Europe Barley Industry Revenue Share (%), by Import Market Analysis (Value & Volume) 2024 & 2032
- Figure 30: Europe Barley Industry Revenue (Million), by Export Market Analysis (Value & Volume) 2024 & 2032
- Figure 31: Europe Barley Industry Revenue Share (%), by Export Market Analysis (Value & Volume) 2024 & 2032
- Figure 32: Europe Barley Industry Revenue (Million), by Price Trend Analysis 2024 & 2032
- Figure 33: Europe Barley Industry Revenue Share (%), by Price Trend Analysis 2024 & 2032
- Figure 34: Europe Barley Industry Revenue (Million), by Country 2024 & 2032
- Figure 35: Europe Barley Industry Revenue Share (%), by Country 2024 & 2032
- Figure 36: Asia Pacific Barley Industry Revenue (Million), by Production Analysis 2024 & 2032
- Figure 37: Asia Pacific Barley Industry Revenue Share (%), by Production Analysis 2024 & 2032
- Figure 38: Asia Pacific Barley Industry Revenue (Million), by Consumption Analysis 2024 & 2032
- Figure 39: Asia Pacific Barley Industry Revenue Share (%), by Consumption Analysis 2024 & 2032
- Figure 40: Asia Pacific Barley Industry Revenue (Million), by Import Market Analysis (Value & Volume) 2024 & 2032
- Figure 41: Asia Pacific Barley Industry Revenue Share (%), by Import Market Analysis (Value & Volume) 2024 & 2032
- Figure 42: Asia Pacific Barley Industry Revenue (Million), by Export Market Analysis (Value & Volume) 2024 & 2032
- Figure 43: Asia Pacific Barley Industry Revenue Share (%), by Export Market Analysis (Value & Volume) 2024 & 2032
- Figure 44: Asia Pacific Barley Industry Revenue (Million), by Price Trend Analysis 2024 & 2032
- Figure 45: Asia Pacific Barley Industry Revenue Share (%), by Price Trend Analysis 2024 & 2032
- Figure 46: Asia Pacific Barley Industry Revenue (Million), by Country 2024 & 2032
- Figure 47: Asia Pacific Barley Industry Revenue Share (%), by Country 2024 & 2032
- Figure 48: South America Barley Industry Revenue (Million), by Production Analysis 2024 & 2032
- Figure 49: South America Barley Industry Revenue Share (%), by Production Analysis 2024 & 2032
- Figure 50: South America Barley Industry Revenue (Million), by Consumption Analysis 2024 & 2032
- Figure 51: South America Barley Industry Revenue Share (%), by Consumption Analysis 2024 & 2032
- Figure 52: South America Barley Industry Revenue (Million), by Import Market Analysis (Value & Volume) 2024 & 2032
- Figure 53: South America Barley Industry Revenue Share (%), by Import Market Analysis (Value & Volume) 2024 & 2032
- Figure 54: South America Barley Industry Revenue (Million), by Export Market Analysis (Value & Volume) 2024 & 2032
- Figure 55: South America Barley Industry Revenue Share (%), by Export Market Analysis (Value & Volume) 2024 & 2032
- Figure 56: South America Barley Industry Revenue (Million), by Price Trend Analysis 2024 & 2032
- Figure 57: South America Barley Industry Revenue Share (%), by Price Trend Analysis 2024 & 2032
- Figure 58: South America Barley Industry Revenue (Million), by Country 2024 & 2032
- Figure 59: South America Barley Industry Revenue Share (%), by Country 2024 & 2032
- Figure 60: Middle East Barley Industry Revenue (Million), by Production Analysis 2024 & 2032
- Figure 61: Middle East Barley Industry Revenue Share (%), by Production Analysis 2024 & 2032
- Figure 62: Middle East Barley Industry Revenue (Million), by Consumption Analysis 2024 & 2032
- Figure 63: Middle East Barley Industry Revenue Share (%), by Consumption Analysis 2024 & 2032
- Figure 64: Middle East Barley Industry Revenue (Million), by Import Market Analysis (Value & Volume) 2024 & 2032
- Figure 65: Middle East Barley Industry Revenue Share (%), by Import Market Analysis (Value & Volume) 2024 & 2032
- Figure 66: Middle East Barley Industry Revenue (Million), by Export Market Analysis (Value & Volume) 2024 & 2032
- Figure 67: Middle East Barley Industry Revenue Share (%), by Export Market Analysis (Value & Volume) 2024 & 2032
- Figure 68: Middle East Barley Industry Revenue (Million), by Price Trend Analysis 2024 & 2032
- Figure 69: Middle East Barley Industry Revenue Share (%), by Price Trend Analysis 2024 & 2032
- Figure 70: Middle East Barley Industry Revenue (Million), by Country 2024 & 2032
- Figure 71: Middle East Barley Industry Revenue Share (%), by Country 2024 & 2032
- Figure 72: Saudi Arabia Barley Industry Revenue (Million), by Production Analysis 2024 & 2032
- Figure 73: Saudi Arabia Barley Industry Revenue Share (%), by Production Analysis 2024 & 2032
- Figure 74: Saudi Arabia Barley Industry Revenue (Million), by Consumption Analysis 2024 & 2032
- Figure 75: Saudi Arabia Barley Industry Revenue Share (%), by Consumption Analysis 2024 & 2032
- Figure 76: Saudi Arabia Barley Industry Revenue (Million), by Import Market Analysis (Value & Volume) 2024 & 2032
- Figure 77: Saudi Arabia Barley Industry Revenue Share (%), by Import Market Analysis (Value & Volume) 2024 & 2032
- Figure 78: Saudi Arabia Barley Industry Revenue (Million), by Export Market Analysis (Value & Volume) 2024 & 2032
- Figure 79: Saudi Arabia Barley Industry Revenue Share (%), by Export Market Analysis (Value & Volume) 2024 & 2032
- Figure 80: Saudi Arabia Barley Industry Revenue (Million), by Price Trend Analysis 2024 & 2032
- Figure 81: Saudi Arabia Barley Industry Revenue Share (%), by Price Trend Analysis 2024 & 2032
- Figure 82: Saudi Arabia Barley Industry Revenue (Million), by Country 2024 & 2032
- Figure 83: Saudi Arabia Barley Industry Revenue Share (%), by Country 2024 & 2032
List of Tables
- Table 1: Global Barley Industry Revenue Million Forecast, by Region 2019 & 2032
- Table 2: Global Barley Industry Revenue Million Forecast, by Production Analysis 2019 & 2032
- Table 3: Global Barley Industry Revenue Million Forecast, by Consumption Analysis 2019 & 2032
- Table 4: Global Barley Industry Revenue Million Forecast, by Import Market Analysis (Value & Volume) 2019 & 2032
- Table 5: Global Barley Industry Revenue Million Forecast, by Export Market Analysis (Value & Volume) 2019 & 2032
- Table 6: Global Barley Industry Revenue Million Forecast, by Price Trend Analysis 2019 & 2032
- Table 7: Global Barley Industry Revenue Million Forecast, by Region 2019 & 2032
- Table 8: Global Barley Industry Revenue Million Forecast, by Country 2019 & 2032
- Table 9: United States Barley Industry Revenue (Million) Forecast, by Application 2019 & 2032
- Table 10: Canada Barley Industry Revenue (Million) Forecast, by Application 2019 & 2032
- Table 11: Mexico Barley Industry Revenue (Million) Forecast, by Application 2019 & 2032
- Table 12: Global Barley Industry Revenue Million Forecast, by Country 2019 & 2032
- Table 13: Germany Barley Industry Revenue (Million) Forecast, by Application 2019 & 2032
- Table 14: United Kingdom Barley Industry Revenue (Million) Forecast, by Application 2019 & 2032
- Table 15: France Barley Industry Revenue (Million) Forecast, by Application 2019 & 2032
- Table 16: Spain Barley Industry Revenue (Million) Forecast, by Application 2019 & 2032
- Table 17: Italy Barley Industry Revenue (Million) Forecast, by Application 2019 & 2032
- Table 18: Spain Barley Industry Revenue (Million) Forecast, by Application 2019 & 2032
- Table 19: Belgium Barley Industry Revenue (Million) Forecast, by Application 2019 & 2032
- Table 20: Netherland Barley Industry Revenue (Million) Forecast, by Application 2019 & 2032
- Table 21: Nordics Barley Industry Revenue (Million) Forecast, by Application 2019 & 2032
- Table 22: Rest of Europe Barley Industry Revenue (Million) Forecast, by Application 2019 & 2032
- Table 23: Global Barley Industry Revenue Million Forecast, by Country 2019 & 2032
- Table 24: China Barley Industry Revenue (Million) Forecast, by Application 2019 & 2032
- Table 25: Japan Barley Industry Revenue (Million) Forecast, by Application 2019 & 2032
- Table 26: India Barley Industry Revenue (Million) Forecast, by Application 2019 & 2032
- Table 27: South Korea Barley Industry Revenue (Million) Forecast, by Application 2019 & 2032
- Table 28: Southeast Asia Barley Industry Revenue (Million) Forecast, by Application 2019 & 2032
- Table 29: Australia Barley Industry Revenue (Million) Forecast, by Application 2019 & 2032
- Table 30: Indonesia Barley Industry Revenue (Million) Forecast, by Application 2019 & 2032
- Table 31: Phillipes Barley Industry Revenue (Million) Forecast, by Application 2019 & 2032
- Table 32: Singapore Barley Industry Revenue (Million) Forecast, by Application 2019 & 2032
- Table 33: Thailandc Barley Industry Revenue (Million) Forecast, by Application 2019 & 2032
- Table 34: Rest of Asia Pacific Barley Industry Revenue (Million) Forecast, by Application 2019 & 2032
- Table 35: Global Barley Industry Revenue Million Forecast, by Country 2019 & 2032
- Table 36: Brazil Barley Industry Revenue (Million) Forecast, by Application 2019 & 2032
- Table 37: Argentina Barley Industry Revenue (Million) Forecast, by Application 2019 & 2032
- Table 38: Peru Barley Industry Revenue (Million) Forecast, by Application 2019 & 2032
- Table 39: Chile Barley Industry Revenue (Million) Forecast, by Application 2019 & 2032
- Table 40: Colombia Barley Industry Revenue (Million) Forecast, by Application 2019 & 2032
- Table 41: Ecuador Barley Industry Revenue (Million) Forecast, by Application 2019 & 2032
- Table 42: Venezuela Barley Industry Revenue (Million) Forecast, by Application 2019 & 2032
- Table 43: Rest of South America Barley Industry Revenue (Million) Forecast, by Application 2019 & 2032
- Table 44: Global Barley Industry Revenue Million Forecast, by Country 2019 & 2032
- Table 45: United Arab Emirates Barley Industry Revenue (Million) Forecast, by Application 2019 & 2032
- Table 46: Saudi Arabia Barley Industry Revenue (Million) Forecast, by Application 2019 & 2032
- Table 47: South Africa Barley Industry Revenue (Million) Forecast, by Application 2019 & 2032
- Table 48: Rest of Middle East and Africa Barley Industry Revenue (Million) Forecast, by Application 2019 & 2032
- Table 49: Global Barley Industry Revenue Million Forecast, by Production Analysis 2019 & 2032
- Table 50: Global Barley Industry Revenue Million Forecast, by Consumption Analysis 2019 & 2032
- Table 51: Global Barley Industry Revenue Million Forecast, by Import Market Analysis (Value & Volume) 2019 & 2032
- Table 52: Global Barley Industry Revenue Million Forecast, by Export Market Analysis (Value & Volume) 2019 & 2032
- Table 53: Global Barley Industry Revenue Million Forecast, by Price Trend Analysis 2019 & 2032
- Table 54: Global Barley Industry Revenue Million Forecast, by Country 2019 & 2032
- Table 55: United States Barley Industry Revenue (Million) Forecast, by Application 2019 & 2032
- Table 56: Global Barley Industry Revenue Million Forecast, by Production Analysis 2019 & 2032
- Table 57: Global Barley Industry Revenue Million Forecast, by Consumption Analysis 2019 & 2032
- Table 58: Global Barley Industry Revenue Million Forecast, by Import Market Analysis (Value & Volume) 2019 & 2032
- Table 59: Global Barley Industry Revenue Million Forecast, by Export Market Analysis (Value & Volume) 2019 & 2032
- Table 60: Global Barley Industry Revenue Million Forecast, by Price Trend Analysis 2019 & 2032
- Table 61: Global Barley Industry Revenue Million Forecast, by Country 2019 & 2032
- Table 62: Germany Barley Industry Revenue (Million) Forecast, by Application 2019 & 2032
- Table 63: Global Barley Industry Revenue Million Forecast, by Production Analysis 2019 & 2032
- Table 64: Global Barley Industry Revenue Million Forecast, by Consumption Analysis 2019 & 2032
- Table 65: Global Barley Industry Revenue Million Forecast, by Import Market Analysis (Value & Volume) 2019 & 2032
- Table 66: Global Barley Industry Revenue Million Forecast, by Export Market Analysis (Value & Volume) 2019 & 2032
- Table 67: Global Barley Industry Revenue Million Forecast, by Price Trend Analysis 2019 & 2032
- Table 68: Global Barley Industry Revenue Million Forecast, by Country 2019 & 2032
- Table 69: China Barley Industry Revenue (Million) Forecast, by Application 2019 & 2032
- Table 70: Global Barley Industry Revenue Million Forecast, by Production Analysis 2019 & 2032
- Table 71: Global Barley Industry Revenue Million Forecast, by Consumption Analysis 2019 & 2032
- Table 72: Global Barley Industry Revenue Million Forecast, by Import Market Analysis (Value & Volume) 2019 & 2032
- Table 73: Global Barley Industry Revenue Million Forecast, by Export Market Analysis (Value & Volume) 2019 & 2032
- Table 74: Global Barley Industry Revenue Million Forecast, by Price Trend Analysis 2019 & 2032
- Table 75: Global Barley Industry Revenue Million Forecast, by Country 2019 & 2032
- Table 76: Argentina Barley Industry Revenue (Million) Forecast, by Application 2019 & 2032
- Table 77: Global Barley Industry Revenue Million Forecast, by Production Analysis 2019 & 2032
- Table 78: Global Barley Industry Revenue Million Forecast, by Consumption Analysis 2019 & 2032
- Table 79: Global Barley Industry Revenue Million Forecast, by Import Market Analysis (Value & Volume) 2019 & 2032
- Table 80: Global Barley Industry Revenue Million Forecast, by Export Market Analysis (Value & Volume) 2019 & 2032
- Table 81: Global Barley Industry Revenue Million Forecast, by Price Trend Analysis 2019 & 2032
- Table 82: Global Barley Industry Revenue Million Forecast, by Country 2019 & 2032
- Table 83: Global Barley Industry Revenue Million Forecast, by Production Analysis 2019 & 2032
- Table 84: Global Barley Industry Revenue Million Forecast, by Consumption Analysis 2019 & 2032
- Table 85: Global Barley Industry Revenue Million Forecast, by Import Market Analysis (Value & Volume) 2019 & 2032
- Table 86: Global Barley Industry Revenue Million Forecast, by Export Market Analysis (Value & Volume) 2019 & 2032
- Table 87: Global Barley Industry Revenue Million Forecast, by Price Trend Analysis 2019 & 2032
- Table 88: Global Barley Industry Revenue Million Forecast, by Country 2019 & 2032
Frequently Asked Questions
1. What is the projected Compound Annual Growth Rate (CAGR) of the Barley Industry?
The projected CAGR is approximately 4.73%.
2. Which companies are prominent players in the Barley Industry?
Key companies in the market include Malteurop , Rahr Malting , Soufflet Group , Cargill, Boortmalt .
3. What are the main segments of the Barley Industry?
The market segments include Production Analysis, Consumption Analysis, Import Market Analysis (Value & Volume), Export Market Analysis (Value & Volume), Price Trend Analysis.
4. Can you provide details about the market size?
The market size is estimated to be USD 24.62 Million as of 2022.
5. What are some drivers contributing to market growth?
Increasing Berry Consumption for Health Benefits; Increasing Adoption of High-Technology Farm Practices; Growing Usage of Berries in the Food and Beverage Industries.
6. What are the notable trends driving market growth?
Emerging Applications is Various Industries Led to Growth in Exports.
7. Are there any restraints impacting market growth?
High Production Cost Involved in Berry Production; Increasing Disease and Pest Infestations.
8. Can you provide examples of recent developments in the market?
January 2023: The European Commission's new Common Agricultural Policy aims to support European farmers in transitioning to a more sustainable and resilient agricultural industry and preserving the diversity of rural communities.
9. What pricing options are available for accessing the report?
Pricing options include single-user, multi-user, and enterprise licenses priced at USD 4750, USD 5250, and USD 8750 respectively.
10. Is the market size provided in terms of value or volume?
The market size is provided in terms of value, measured in Million.
11. Are there any specific market keywords associated with the report?
Yes, the market keyword associated with the report is "Barley Industry," which aids in identifying and referencing the specific market segment covered.
12. How do I determine which pricing option suits my needs best?
The pricing options vary based on user requirements and access needs. Individual users may opt for single-user licenses, while businesses requiring broader access may choose multi-user or enterprise licenses for cost-effective access to the report.
13. Are there any additional resources or data provided in the Barley Industry report?
While the report offers comprehensive insights, it's advisable to review the specific contents or supplementary materials provided to ascertain if additional resources or data are available.
14. How can I stay updated on further developments or reports in the Barley Industry?
To stay informed about further developments, trends, and reports in the Barley Industry, consider subscribing to industry newsletters, following relevant companies and organizations, or regularly checking reputable industry news sources and publications.
Methodology
Step 1 - Identification of Relevant Samples Size from Population Database


Step 2 - Approaches for Defining Global Market Size (Value, Volume* & Price*)

Note*: In applicable scenarios
Step 3 - Data Sources
Primary Research
- Web Analytics
- Survey Reports
- Research Institute
- Latest Research Reports
- Opinion Leaders
Secondary Research
- Annual Reports
- White Paper
- Latest Press Release
- Industry Association
- Paid Database
- Investor Presentations

Step 4 - Data Triangulation
Involves using different sources of information in order to increase the validity of a study
These sources are likely to be stakeholders in a program - participants, other researchers, program staff, other community members, and so on.
Then we put all data in single framework & apply various statistical tools to find out the dynamic on the market.
During the analysis stage, feedback from the stakeholder groups would be compared to determine areas of agreement as well as areas of divergence


