
Key Insights
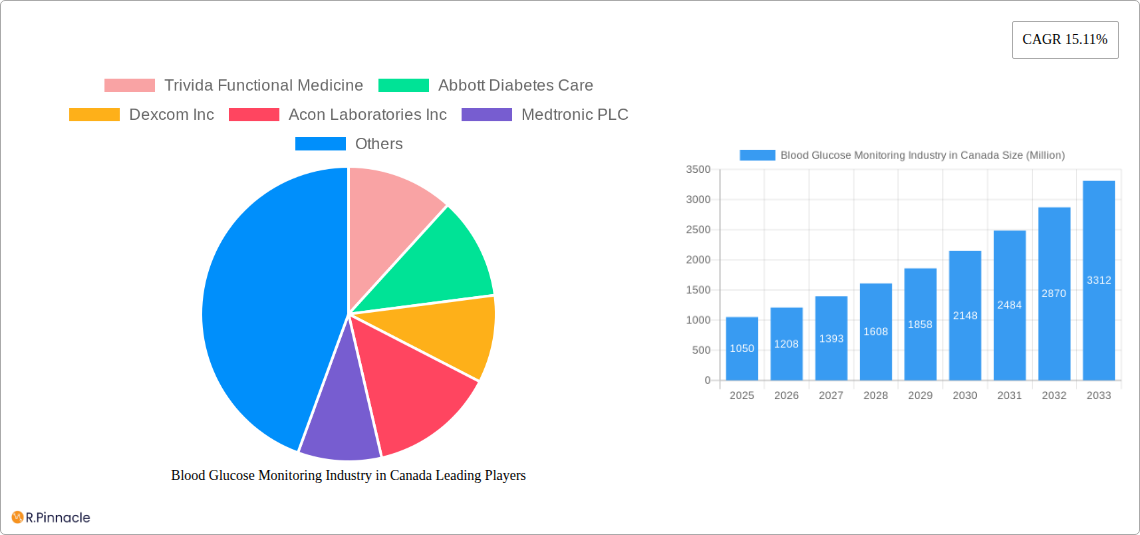
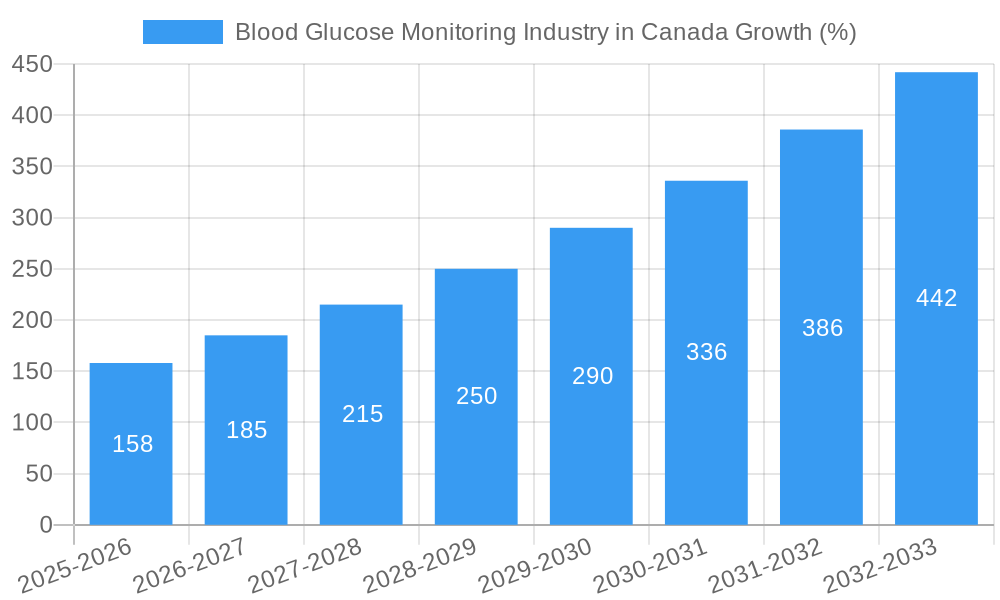
The Canadian blood glucose monitoring (BGM) market, valued at $1.05 billion in 2025, is experiencing robust growth, projected to expand at a Compound Annual Growth Rate (CAGR) of 15.11% from 2025 to 2033. This significant expansion is driven by several key factors. The rising prevalence of diabetes, particularly type 2 diabetes, among the Canadian population fuels demand for both self-monitoring blood glucose (SMBG) devices and continuous glucose monitoring (CGM) systems. Technological advancements, including the development of more accurate, user-friendly, and minimally invasive CGM devices, are further stimulating market growth. Increased awareness of the importance of proactive diabetes management, coupled with improved healthcare infrastructure and insurance coverage, are also contributing to market expansion. Furthermore, the growing adoption of telehealth and remote patient monitoring solutions is facilitating better diabetes care and increasing the demand for BGM devices.
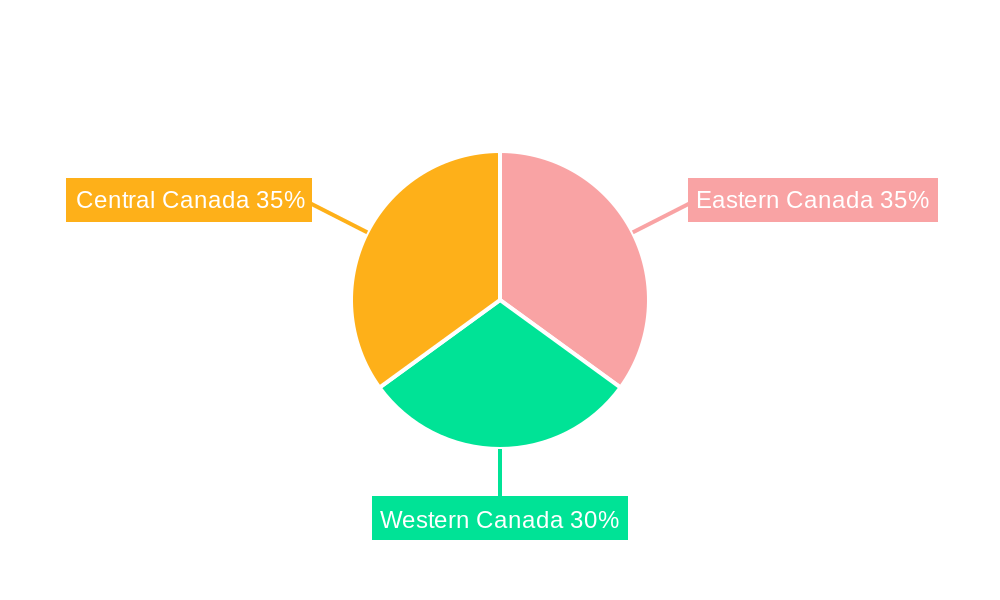
The Canadian BGM market is segmented into SMBG devices (including glucometers, test strips, and lancets) and CGM devices (comprising sensors, receivers, and transmitters). While SMBG devices currently hold a larger market share, the CGM segment is projected to experience faster growth due to its superior features, including real-time glucose data and alerts. Regional variations within Canada exist, with population density and access to healthcare services influencing market penetration. While precise regional data for Eastern, Western, and Central Canada is not provided, market projections indicate that provinces with higher diabetic prevalence and better healthcare infrastructure will witness stronger market performance. Competitive forces within the market are strong, with key players like Abbott Diabetes Care, Dexcom Inc., Medtronic PLC, and Roche Holding AG vying for market share through product innovation, strategic partnerships, and robust distribution networks. However, factors like the high cost of CGM systems and potential challenges related to device accuracy and reliability present some market restraints.
Blood Glucose Monitoring Industry in Canada: 2019-2033 Market Report
This comprehensive report provides an in-depth analysis of the Blood Glucose Monitoring (BGM) industry in Canada, covering the period 2019-2033. It offers invaluable insights into market dynamics, competitive landscapes, and future growth prospects for industry professionals, investors, and stakeholders. The report leverages extensive market research and data analysis to deliver actionable intelligence, enabling informed strategic decision-making. With a focus on key segments like Self-Monitoring Blood Glucose Devices (SMBGD) and Continuous Glucose Monitoring (CGM) devices, this report provides a detailed overview of the Canadian BGM market.
Blood Glucose Monitoring Industry in Canada Market Structure & Innovation Trends
This section analyzes the Canadian blood glucose monitoring market structure, highlighting key trends and innovations from 2019 to 2024. The market is characterized by a mix of large multinational corporations and smaller specialized players. While precise market share figures for each company require proprietary data, Abbott Diabetes Care, Medtronic PLC, and Roche Holding AG are major players with significant market presence. The industry exhibits moderate concentration, with several key players competing alongside smaller niche players like Trivida Functional Medicine and Agamatrix Inc. Innovation is driven by advancements in CGM technology, miniaturization of devices, improved accuracy, and integration with mobile applications. Regulatory frameworks, primarily overseen by Health Canada, play a crucial role in market access and product approvals. The market experiences substitution primarily through technological advancements within the CGM segment and the ongoing improvement of SMBGD accuracy and user-friendliness. The end-user demographics are largely driven by the prevalence of diabetes within various age groups and health conditions across Canada. M&A activity in the Canadian BGM market has been moderate, with deal values estimated to be in the range of xx Million over the past five years.
- Market Concentration: Moderate, with several key players and smaller niche companies.
- Innovation Drivers: Technological advancements in CGM, miniaturization, improved accuracy, mobile app integration.
- Regulatory Landscape: Health Canada regulations significantly impact market access.
- Product Substitutes: Technological advancements within CGM and SMBGD segments.
- End-User Demographics: Primarily driven by diabetes prevalence across age groups.
- M&A Activity: Moderate activity with estimated deal values in the range of xx Million (2019-2024).
Blood Glucose Monitoring Industry in Canada Market Dynamics & Trends
The Canadian blood glucose monitoring market exhibits robust growth, driven by several key factors. The rising prevalence of diabetes, particularly type 2 diabetes, is a significant driver, fueling demand for both SMBGD and CGM systems. Technological advancements, including the introduction of more accurate, user-friendly, and integrated devices, have significantly impacted market penetration. Consumer preference is shifting towards CGM systems due to their continuous monitoring capabilities and improved convenience. The competitive dynamics are marked by both intense competition amongst established players and the emergence of new entrants offering innovative solutions. The compound annual growth rate (CAGR) for the Canadian BGM market during the historical period (2019-2024) was approximately xx%, while market penetration of CGM systems is estimated at xx% in 2024, projecting an increase to xx% by 2033. The forecast period (2025-2033) projects continued strong growth driven by technological advancements and increased diabetes prevalence.
Dominant Regions & Segments in Blood Glucose Monitoring Industry in Canada
The Canadian BGM market demonstrates relatively even distribution across provinces and territories, with higher concentration in urban areas with larger populations. However, significant regional variations exist, primarily due to differences in diabetes prevalence and access to healthcare resources. Within the product segments, CGM devices are witnessing significantly faster growth than SMBGD.
Self-Monitoring Blood Glucose Devices:
- Glucometer Devices: Market dominance is shared among key players. Growth is moderate, driven by ongoing improvements in accuracy and ease of use.
- Test Strips: High volume market; growth closely tied to Glucometer device sales. Competitive pricing and supply chain efficiency are key.
- Lancets: Similar dynamics to test strips, with growth closely linked to SMBGD sales.
Continuous Blood Glucose Monitoring Devices:
- Sensors: The fastest-growing segment; technological advancements and improved accuracy drive market expansion.
- Durables (Receivers and Transmitters): Growth is directly linked to sensor sales; technological improvements and miniaturization are key factors.
Key Drivers for Dominance:
- Economic Policies: Government healthcare programs and insurance coverage significantly influence market access and affordability.
- Healthcare Infrastructure: Access to healthcare professionals and specialized facilities impacts market penetration, especially in rural areas.
Blood Glucose Monitoring Industry in Canada Product Innovations
Recent years have seen significant product innovation in the Canadian BGM market. Key advancements include the introduction of smaller, more accurate, and user-friendly CGM systems with integrated mobile applications. This has led to improved patient adherence and better diabetes management. Companies are focusing on developing integrated solutions that combine CGM data with other health metrics, providing a more holistic view of patient health. The market is witnessing a shift towards non-invasive glucose monitoring technologies, although these are still in early stages of development. The success of new products hinges on their accuracy, ease of use, affordability, and integration with existing healthcare systems.
Report Scope & Segmentation Analysis
This report segments the Canadian BGM market into two main categories: Self-Monitoring Blood Glucose Devices (SMBGD) and Continuous Glucose Monitoring (CGM) devices.
Self-Monitoring Blood Glucose Devices (SMBGD): This segment is further divided into Glucometer Devices, Test Strips, and Lancets. The market size for SMBGD in 2024 is estimated at xx Million, with projected growth to xx Million by 2033. The market is characterized by intense competition, driven by pricing and product features.
Continuous Glucose Monitoring (CGM) Devices: This segment is divided into Sensors and Durables (Receivers and Transmitters). The market size for CGM in 2024 is estimated at xx Million, projected to grow significantly to xx Million by 2033. CGM is the fastest-growing segment, fueled by technological advancements and increasing consumer preference.
Key Drivers of Blood Glucose Monitoring Industry in Canada Growth
The growth of the Canadian BGM market is primarily driven by several factors:
- Rising Prevalence of Diabetes: The increasing number of individuals diagnosed with diabetes significantly boosts demand for BGM devices.
- Technological Advancements: Innovations in CGM technology, improving accuracy and ease of use, are major drivers.
- Government Initiatives: Government programs supporting diabetes management and improved healthcare access contribute to market growth.
Challenges in the Blood Glucose Monitoring Industry in Canada Sector
The Canadian BGM market faces several challenges:
- High Cost of Devices: The cost of CGM systems can be prohibitive for some patients, limiting market penetration.
- Reimbursement Policies: Variations in insurance coverage across provinces create challenges for market access.
- Competition: Intense competition among established players and emerging companies pressures profitability and innovation.
Emerging Opportunities in Blood Glucose Monitoring Industry in Canada
Several emerging opportunities exist within the Canadian BGM market:
- Expansion of CGM Use: Increased adoption of CGM systems represents a significant growth opportunity.
- Development of Integrated Solutions: Combining BGM data with other health metrics offers potential for improved patient management.
- Non-Invasive Glucose Monitoring: The development of non-invasive technologies could revolutionize the market.
Leading Players in the Blood Glucose Monitoring Industry in Canada Market
- Abbott Diabetes Care
- Dexcom Inc
- Medtronic PLC
- Acon Laboratories Inc
- Agamatrix Inc
- Senseonics
- Self-monitoring Blood Glucose Devices
- Bionime Corporation
- LifeScan
- Roche Holding AG
- Arkray Inc
- Ascensia Diabetes Care
- Trivida Functional Medicine
Key Developments in Blood Glucose Monitoring Industry in Canada Industry
- July 2023: The Dexcom G7 CGM system receives Health Canada authorization for use in individuals aged two and older with any form of diabetes. This significantly expands market access for Dexcom.
- March 2022: Dexcom's G7 CGM system receives CE Mark approval in Europe, enhancing its global market position and paving the way for Canadian approval.
Future Outlook for Blood Glucose Monitoring Industry in Canada Market
The future outlook for the Canadian BGM market is positive, driven by continuous technological advancements, increased diabetes prevalence, and growing awareness of the importance of blood glucose monitoring. The market is poised for significant growth, particularly within the CGM segment. Strategic opportunities exist for companies focusing on innovation, affordability, and integration with existing healthcare systems. The market is expected to witness consolidation through mergers and acquisitions, as larger players seek to expand their market share and product portfolios.
Blood Glucose Monitoring Industry in Canada Segmentation
-
1. Self-monitoring blood glucose devices
- 1.1. Glucometer Devices
- 1.2. Test Strips
- 1.3. Lancets
-
2. Continuous blood glucose monitoring devices
- 2.1. Sensors
- 2.2. Durables (Receivers and Transmitters)
Blood Glucose Monitoring Industry in Canada Segmentation By Geography
-
1. North America
- 1.1. United States
- 1.2. Canada
- 1.3. Mexico
-
2. South America
- 2.1. Brazil
- 2.2. Argentina
- 2.3. Rest of South America
-
3. Europe
- 3.1. United Kingdom
- 3.2. Germany
- 3.3. France
- 3.4. Italy
- 3.5. Spain
- 3.6. Russia
- 3.7. Benelux
- 3.8. Nordics
- 3.9. Rest of Europe
-
4. Middle East & Africa
- 4.1. Turkey
- 4.2. Israel
- 4.3. GCC
- 4.4. North Africa
- 4.5. South Africa
- 4.6. Rest of Middle East & Africa
-
5. Asia Pacific
- 5.1. China
- 5.2. India
- 5.3. Japan
- 5.4. South Korea
- 5.5. ASEAN
- 5.6. Oceania
- 5.7. Rest of Asia Pacific
Blood Glucose Monitoring Industry in Canada REPORT HIGHLIGHTS
| Aspects | Details |
|---|---|
| Study Period | 2019-2033 |
| Base Year | 2024 |
| Estimated Year | 2025 |
| Forecast Period | 2025-2033 |
| Historical Period | 2019-2024 |
| Growth Rate | CAGR of 15.11% from 2019-2033 |
| Segmentation |
|
Table of Contents
- 1. Introduction
- 1.1. Research Scope
- 1.2. Market Segmentation
- 1.3. Research Methodology
- 1.4. Definitions and Assumptions
- 2. Executive Summary
- 2.1. Introduction
- 3. Market Dynamics
- 3.1. Introduction
- 3.2. Market Drivers
- 3.2.1. Rising Prevalence of Cancer Worldwide; Technological Advancements in Diagnostic Testing; Increasing Demand for Point-of-care Treatment
- 3.3. Market Restrains
- 3.3.1. High Cost of Molecular Diagnostic Tests; Lack of Skilled Workforce and Stringent Regulatory Framework
- 3.4. Market Trends
- 3.4.1. Increasing Type-1 diabetes population across Canada
- 4. Market Factor Analysis
- 4.1. Porters Five Forces
- 4.2. Supply/Value Chain
- 4.3. PESTEL analysis
- 4.4. Market Entropy
- 4.5. Patent/Trademark Analysis
- 5. Global Blood Glucose Monitoring Industry in Canada Analysis, Insights and Forecast, 2019-2031
- 5.1. Market Analysis, Insights and Forecast - by Self-monitoring blood glucose devices
- 5.1.1. Glucometer Devices
- 5.1.2. Test Strips
- 5.1.3. Lancets
- 5.2. Market Analysis, Insights and Forecast - by Continuous blood glucose monitoring devices
- 5.2.1. Sensors
- 5.2.2. Durables (Receivers and Transmitters)
- 5.3. Market Analysis, Insights and Forecast - by Region
- 5.3.1. North America
- 5.3.2. South America
- 5.3.3. Europe
- 5.3.4. Middle East & Africa
- 5.3.5. Asia Pacific
- 5.1. Market Analysis, Insights and Forecast - by Self-monitoring blood glucose devices
- 6. North America Blood Glucose Monitoring Industry in Canada Analysis, Insights and Forecast, 2019-2031
- 6.1. Market Analysis, Insights and Forecast - by Self-monitoring blood glucose devices
- 6.1.1. Glucometer Devices
- 6.1.2. Test Strips
- 6.1.3. Lancets
- 6.2. Market Analysis, Insights and Forecast - by Continuous blood glucose monitoring devices
- 6.2.1. Sensors
- 6.2.2. Durables (Receivers and Transmitters)
- 6.1. Market Analysis, Insights and Forecast - by Self-monitoring blood glucose devices
- 7. South America Blood Glucose Monitoring Industry in Canada Analysis, Insights and Forecast, 2019-2031
- 7.1. Market Analysis, Insights and Forecast - by Self-monitoring blood glucose devices
- 7.1.1. Glucometer Devices
- 7.1.2. Test Strips
- 7.1.3. Lancets
- 7.2. Market Analysis, Insights and Forecast - by Continuous blood glucose monitoring devices
- 7.2.1. Sensors
- 7.2.2. Durables (Receivers and Transmitters)
- 7.1. Market Analysis, Insights and Forecast - by Self-monitoring blood glucose devices
- 8. Europe Blood Glucose Monitoring Industry in Canada Analysis, Insights and Forecast, 2019-2031
- 8.1. Market Analysis, Insights and Forecast - by Self-monitoring blood glucose devices
- 8.1.1. Glucometer Devices
- 8.1.2. Test Strips
- 8.1.3. Lancets
- 8.2. Market Analysis, Insights and Forecast - by Continuous blood glucose monitoring devices
- 8.2.1. Sensors
- 8.2.2. Durables (Receivers and Transmitters)
- 8.1. Market Analysis, Insights and Forecast - by Self-monitoring blood glucose devices
- 9. Middle East & Africa Blood Glucose Monitoring Industry in Canada Analysis, Insights and Forecast, 2019-2031
- 9.1. Market Analysis, Insights and Forecast - by Self-monitoring blood glucose devices
- 9.1.1. Glucometer Devices
- 9.1.2. Test Strips
- 9.1.3. Lancets
- 9.2. Market Analysis, Insights and Forecast - by Continuous blood glucose monitoring devices
- 9.2.1. Sensors
- 9.2.2. Durables (Receivers and Transmitters)
- 9.1. Market Analysis, Insights and Forecast - by Self-monitoring blood glucose devices
- 10. Asia Pacific Blood Glucose Monitoring Industry in Canada Analysis, Insights and Forecast, 2019-2031
- 10.1. Market Analysis, Insights and Forecast - by Self-monitoring blood glucose devices
- 10.1.1. Glucometer Devices
- 10.1.2. Test Strips
- 10.1.3. Lancets
- 10.2. Market Analysis, Insights and Forecast - by Continuous blood glucose monitoring devices
- 10.2.1. Sensors
- 10.2.2. Durables (Receivers and Transmitters)
- 10.1. Market Analysis, Insights and Forecast - by Self-monitoring blood glucose devices
- 11. Eastern Canada Blood Glucose Monitoring Industry in Canada Analysis, Insights and Forecast, 2019-2031
- 12. Western Canada Blood Glucose Monitoring Industry in Canada Analysis, Insights and Forecast, 2019-2031
- 13. Central Canada Blood Glucose Monitoring Industry in Canada Analysis, Insights and Forecast, 2019-2031
- 14. Competitive Analysis
- 14.1. Global Market Share Analysis 2024
- 14.2. Company Profiles
- 14.2.1 Trivida Functional Medicine
- 14.2.1.1. Overview
- 14.2.1.2. Products
- 14.2.1.3. SWOT Analysis
- 14.2.1.4. Recent Developments
- 14.2.1.5. Financials (Based on Availability)
- 14.2.2 Abbott Diabetes Care
- 14.2.2.1. Overview
- 14.2.2.2. Products
- 14.2.2.3. SWOT Analysis
- 14.2.2.4. Recent Developments
- 14.2.2.5. Financials (Based on Availability)
- 14.2.3 Dexcom Inc
- 14.2.3.1. Overview
- 14.2.3.2. Products
- 14.2.3.3. SWOT Analysis
- 14.2.3.4. Recent Developments
- 14.2.3.5. Financials (Based on Availability)
- 14.2.4 Acon Laboratories Inc
- 14.2.4.1. Overview
- 14.2.4.2. Products
- 14.2.4.3. SWOT Analysis
- 14.2.4.4. Recent Developments
- 14.2.4.5. Financials (Based on Availability)
- 14.2.5 Medtronic PLC
- 14.2.5.1. Overview
- 14.2.5.2. Products
- 14.2.5.3. SWOT Analysis
- 14.2.5.4. Recent Developments
- 14.2.5.5. Financials (Based on Availability)
- 14.2.6 Agamatrix Inc
- 14.2.6.1. Overview
- 14.2.6.2. Products
- 14.2.6.3. SWOT Analysis
- 14.2.6.4. Recent Developments
- 14.2.6.5. Financials (Based on Availability)
- 14.2.7 Senseonics
- 14.2.7.1. Overview
- 14.2.7.2. Products
- 14.2.7.3. SWOT Analysis
- 14.2.7.4. Recent Developments
- 14.2.7.5. Financials (Based on Availability)
- 14.2.8 Self-monitoring Blood Glucose Devices
- 14.2.8.1. Overview
- 14.2.8.2. Products
- 14.2.8.3. SWOT Analysis
- 14.2.8.4. Recent Developments
- 14.2.8.5. Financials (Based on Availability)
- 14.2.9 Bionime Corporation
- 14.2.9.1. Overview
- 14.2.9.2. Products
- 14.2.9.3. SWOT Analysis
- 14.2.9.4. Recent Developments
- 14.2.9.5. Financials (Based on Availability)
- 14.2.10 LifeScan
- 14.2.10.1. Overview
- 14.2.10.2. Products
- 14.2.10.3. SWOT Analysis
- 14.2.10.4. Recent Developments
- 14.2.10.5. Financials (Based on Availability)
- 14.2.11 Roche Holding AG
- 14.2.11.1. Overview
- 14.2.11.2. Products
- 14.2.11.3. SWOT Analysis
- 14.2.11.4. Recent Developments
- 14.2.11.5. Financials (Based on Availability)
- 14.2.12 Arkray Inc
- 14.2.12.1. Overview
- 14.2.12.2. Products
- 14.2.12.3. SWOT Analysis
- 14.2.12.4. Recent Developments
- 14.2.12.5. Financials (Based on Availability)
- 14.2.13 Ascensia Diabetes Care
- 14.2.13.1. Overview
- 14.2.13.2. Products
- 14.2.13.3. SWOT Analysis
- 14.2.13.4. Recent Developments
- 14.2.13.5. Financials (Based on Availability)
- 14.2.1 Trivida Functional Medicine
List of Figures
- Figure 1: Global Blood Glucose Monitoring Industry in Canada Revenue Breakdown (Million, %) by Region 2024 & 2032
- Figure 2: Global Blood Glucose Monitoring Industry in Canada Volume Breakdown (K Unit, %) by Region 2024 & 2032
- Figure 3: Canada Blood Glucose Monitoring Industry in Canada Revenue (Million), by Country 2024 & 2032
- Figure 4: Canada Blood Glucose Monitoring Industry in Canada Volume (K Unit), by Country 2024 & 2032
- Figure 5: Canada Blood Glucose Monitoring Industry in Canada Revenue Share (%), by Country 2024 & 2032
- Figure 6: Canada Blood Glucose Monitoring Industry in Canada Volume Share (%), by Country 2024 & 2032
- Figure 7: North America Blood Glucose Monitoring Industry in Canada Revenue (Million), by Self-monitoring blood glucose devices 2024 & 2032
- Figure 8: North America Blood Glucose Monitoring Industry in Canada Volume (K Unit), by Self-monitoring blood glucose devices 2024 & 2032
- Figure 9: North America Blood Glucose Monitoring Industry in Canada Revenue Share (%), by Self-monitoring blood glucose devices 2024 & 2032
- Figure 10: North America Blood Glucose Monitoring Industry in Canada Volume Share (%), by Self-monitoring blood glucose devices 2024 & 2032
- Figure 11: North America Blood Glucose Monitoring Industry in Canada Revenue (Million), by Continuous blood glucose monitoring devices 2024 & 2032
- Figure 12: North America Blood Glucose Monitoring Industry in Canada Volume (K Unit), by Continuous blood glucose monitoring devices 2024 & 2032
- Figure 13: North America Blood Glucose Monitoring Industry in Canada Revenue Share (%), by Continuous blood glucose monitoring devices 2024 & 2032
- Figure 14: North America Blood Glucose Monitoring Industry in Canada Volume Share (%), by Continuous blood glucose monitoring devices 2024 & 2032
- Figure 15: North America Blood Glucose Monitoring Industry in Canada Revenue (Million), by Country 2024 & 2032
- Figure 16: North America Blood Glucose Monitoring Industry in Canada Volume (K Unit), by Country 2024 & 2032
- Figure 17: North America Blood Glucose Monitoring Industry in Canada Revenue Share (%), by Country 2024 & 2032
- Figure 18: North America Blood Glucose Monitoring Industry in Canada Volume Share (%), by Country 2024 & 2032
- Figure 19: South America Blood Glucose Monitoring Industry in Canada Revenue (Million), by Self-monitoring blood glucose devices 2024 & 2032
- Figure 20: South America Blood Glucose Monitoring Industry in Canada Volume (K Unit), by Self-monitoring blood glucose devices 2024 & 2032
- Figure 21: South America Blood Glucose Monitoring Industry in Canada Revenue Share (%), by Self-monitoring blood glucose devices 2024 & 2032
- Figure 22: South America Blood Glucose Monitoring Industry in Canada Volume Share (%), by Self-monitoring blood glucose devices 2024 & 2032
- Figure 23: South America Blood Glucose Monitoring Industry in Canada Revenue (Million), by Continuous blood glucose monitoring devices 2024 & 2032
- Figure 24: South America Blood Glucose Monitoring Industry in Canada Volume (K Unit), by Continuous blood glucose monitoring devices 2024 & 2032
- Figure 25: South America Blood Glucose Monitoring Industry in Canada Revenue Share (%), by Continuous blood glucose monitoring devices 2024 & 2032
- Figure 26: South America Blood Glucose Monitoring Industry in Canada Volume Share (%), by Continuous blood glucose monitoring devices 2024 & 2032
- Figure 27: South America Blood Glucose Monitoring Industry in Canada Revenue (Million), by Country 2024 & 2032
- Figure 28: South America Blood Glucose Monitoring Industry in Canada Volume (K Unit), by Country 2024 & 2032
- Figure 29: South America Blood Glucose Monitoring Industry in Canada Revenue Share (%), by Country 2024 & 2032
- Figure 30: South America Blood Glucose Monitoring Industry in Canada Volume Share (%), by Country 2024 & 2032
- Figure 31: Europe Blood Glucose Monitoring Industry in Canada Revenue (Million), by Self-monitoring blood glucose devices 2024 & 2032
- Figure 32: Europe Blood Glucose Monitoring Industry in Canada Volume (K Unit), by Self-monitoring blood glucose devices 2024 & 2032
- Figure 33: Europe Blood Glucose Monitoring Industry in Canada Revenue Share (%), by Self-monitoring blood glucose devices 2024 & 2032
- Figure 34: Europe Blood Glucose Monitoring Industry in Canada Volume Share (%), by Self-monitoring blood glucose devices 2024 & 2032
- Figure 35: Europe Blood Glucose Monitoring Industry in Canada Revenue (Million), by Continuous blood glucose monitoring devices 2024 & 2032
- Figure 36: Europe Blood Glucose Monitoring Industry in Canada Volume (K Unit), by Continuous blood glucose monitoring devices 2024 & 2032
- Figure 37: Europe Blood Glucose Monitoring Industry in Canada Revenue Share (%), by Continuous blood glucose monitoring devices 2024 & 2032
- Figure 38: Europe Blood Glucose Monitoring Industry in Canada Volume Share (%), by Continuous blood glucose monitoring devices 2024 & 2032
- Figure 39: Europe Blood Glucose Monitoring Industry in Canada Revenue (Million), by Country 2024 & 2032
- Figure 40: Europe Blood Glucose Monitoring Industry in Canada Volume (K Unit), by Country 2024 & 2032
- Figure 41: Europe Blood Glucose Monitoring Industry in Canada Revenue Share (%), by Country 2024 & 2032
- Figure 42: Europe Blood Glucose Monitoring Industry in Canada Volume Share (%), by Country 2024 & 2032
- Figure 43: Middle East & Africa Blood Glucose Monitoring Industry in Canada Revenue (Million), by Self-monitoring blood glucose devices 2024 & 2032
- Figure 44: Middle East & Africa Blood Glucose Monitoring Industry in Canada Volume (K Unit), by Self-monitoring blood glucose devices 2024 & 2032
- Figure 45: Middle East & Africa Blood Glucose Monitoring Industry in Canada Revenue Share (%), by Self-monitoring blood glucose devices 2024 & 2032
- Figure 46: Middle East & Africa Blood Glucose Monitoring Industry in Canada Volume Share (%), by Self-monitoring blood glucose devices 2024 & 2032
- Figure 47: Middle East & Africa Blood Glucose Monitoring Industry in Canada Revenue (Million), by Continuous blood glucose monitoring devices 2024 & 2032
- Figure 48: Middle East & Africa Blood Glucose Monitoring Industry in Canada Volume (K Unit), by Continuous blood glucose monitoring devices 2024 & 2032
- Figure 49: Middle East & Africa Blood Glucose Monitoring Industry in Canada Revenue Share (%), by Continuous blood glucose monitoring devices 2024 & 2032
- Figure 50: Middle East & Africa Blood Glucose Monitoring Industry in Canada Volume Share (%), by Continuous blood glucose monitoring devices 2024 & 2032
- Figure 51: Middle East & Africa Blood Glucose Monitoring Industry in Canada Revenue (Million), by Country 2024 & 2032
- Figure 52: Middle East & Africa Blood Glucose Monitoring Industry in Canada Volume (K Unit), by Country 2024 & 2032
- Figure 53: Middle East & Africa Blood Glucose Monitoring Industry in Canada Revenue Share (%), by Country 2024 & 2032
- Figure 54: Middle East & Africa Blood Glucose Monitoring Industry in Canada Volume Share (%), by Country 2024 & 2032
- Figure 55: Asia Pacific Blood Glucose Monitoring Industry in Canada Revenue (Million), by Self-monitoring blood glucose devices 2024 & 2032
- Figure 56: Asia Pacific Blood Glucose Monitoring Industry in Canada Volume (K Unit), by Self-monitoring blood glucose devices 2024 & 2032
- Figure 57: Asia Pacific Blood Glucose Monitoring Industry in Canada Revenue Share (%), by Self-monitoring blood glucose devices 2024 & 2032
- Figure 58: Asia Pacific Blood Glucose Monitoring Industry in Canada Volume Share (%), by Self-monitoring blood glucose devices 2024 & 2032
- Figure 59: Asia Pacific Blood Glucose Monitoring Industry in Canada Revenue (Million), by Continuous blood glucose monitoring devices 2024 & 2032
- Figure 60: Asia Pacific Blood Glucose Monitoring Industry in Canada Volume (K Unit), by Continuous blood glucose monitoring devices 2024 & 2032
- Figure 61: Asia Pacific Blood Glucose Monitoring Industry in Canada Revenue Share (%), by Continuous blood glucose monitoring devices 2024 & 2032
- Figure 62: Asia Pacific Blood Glucose Monitoring Industry in Canada Volume Share (%), by Continuous blood glucose monitoring devices 2024 & 2032
- Figure 63: Asia Pacific Blood Glucose Monitoring Industry in Canada Revenue (Million), by Country 2024 & 2032
- Figure 64: Asia Pacific Blood Glucose Monitoring Industry in Canada Volume (K Unit), by Country 2024 & 2032
- Figure 65: Asia Pacific Blood Glucose Monitoring Industry in Canada Revenue Share (%), by Country 2024 & 2032
- Figure 66: Asia Pacific Blood Glucose Monitoring Industry in Canada Volume Share (%), by Country 2024 & 2032
List of Tables
- Table 1: Global Blood Glucose Monitoring Industry in Canada Revenue Million Forecast, by Region 2019 & 2032
- Table 2: Global Blood Glucose Monitoring Industry in Canada Volume K Unit Forecast, by Region 2019 & 2032
- Table 3: Global Blood Glucose Monitoring Industry in Canada Revenue Million Forecast, by Self-monitoring blood glucose devices 2019 & 2032
- Table 4: Global Blood Glucose Monitoring Industry in Canada Volume K Unit Forecast, by Self-monitoring blood glucose devices 2019 & 2032
- Table 5: Global Blood Glucose Monitoring Industry in Canada Revenue Million Forecast, by Continuous blood glucose monitoring devices 2019 & 2032
- Table 6: Global Blood Glucose Monitoring Industry in Canada Volume K Unit Forecast, by Continuous blood glucose monitoring devices 2019 & 2032
- Table 7: Global Blood Glucose Monitoring Industry in Canada Revenue Million Forecast, by Region 2019 & 2032
- Table 8: Global Blood Glucose Monitoring Industry in Canada Volume K Unit Forecast, by Region 2019 & 2032
- Table 9: Global Blood Glucose Monitoring Industry in Canada Revenue Million Forecast, by Country 2019 & 2032
- Table 10: Global Blood Glucose Monitoring Industry in Canada Volume K Unit Forecast, by Country 2019 & 2032
- Table 11: Eastern Canada Blood Glucose Monitoring Industry in Canada Revenue (Million) Forecast, by Application 2019 & 2032
- Table 12: Eastern Canada Blood Glucose Monitoring Industry in Canada Volume (K Unit) Forecast, by Application 2019 & 2032
- Table 13: Western Canada Blood Glucose Monitoring Industry in Canada Revenue (Million) Forecast, by Application 2019 & 2032
- Table 14: Western Canada Blood Glucose Monitoring Industry in Canada Volume (K Unit) Forecast, by Application 2019 & 2032
- Table 15: Central Canada Blood Glucose Monitoring Industry in Canada Revenue (Million) Forecast, by Application 2019 & 2032
- Table 16: Central Canada Blood Glucose Monitoring Industry in Canada Volume (K Unit) Forecast, by Application 2019 & 2032
- Table 17: Global Blood Glucose Monitoring Industry in Canada Revenue Million Forecast, by Self-monitoring blood glucose devices 2019 & 2032
- Table 18: Global Blood Glucose Monitoring Industry in Canada Volume K Unit Forecast, by Self-monitoring blood glucose devices 2019 & 2032
- Table 19: Global Blood Glucose Monitoring Industry in Canada Revenue Million Forecast, by Continuous blood glucose monitoring devices 2019 & 2032
- Table 20: Global Blood Glucose Monitoring Industry in Canada Volume K Unit Forecast, by Continuous blood glucose monitoring devices 2019 & 2032
- Table 21: Global Blood Glucose Monitoring Industry in Canada Revenue Million Forecast, by Country 2019 & 2032
- Table 22: Global Blood Glucose Monitoring Industry in Canada Volume K Unit Forecast, by Country 2019 & 2032
- Table 23: United States Blood Glucose Monitoring Industry in Canada Revenue (Million) Forecast, by Application 2019 & 2032
- Table 24: United States Blood Glucose Monitoring Industry in Canada Volume (K Unit) Forecast, by Application 2019 & 2032
- Table 25: Canada Blood Glucose Monitoring Industry in Canada Revenue (Million) Forecast, by Application 2019 & 2032
- Table 26: Canada Blood Glucose Monitoring Industry in Canada Volume (K Unit) Forecast, by Application 2019 & 2032
- Table 27: Mexico Blood Glucose Monitoring Industry in Canada Revenue (Million) Forecast, by Application 2019 & 2032
- Table 28: Mexico Blood Glucose Monitoring Industry in Canada Volume (K Unit) Forecast, by Application 2019 & 2032
- Table 29: Global Blood Glucose Monitoring Industry in Canada Revenue Million Forecast, by Self-monitoring blood glucose devices 2019 & 2032
- Table 30: Global Blood Glucose Monitoring Industry in Canada Volume K Unit Forecast, by Self-monitoring blood glucose devices 2019 & 2032
- Table 31: Global Blood Glucose Monitoring Industry in Canada Revenue Million Forecast, by Continuous blood glucose monitoring devices 2019 & 2032
- Table 32: Global Blood Glucose Monitoring Industry in Canada Volume K Unit Forecast, by Continuous blood glucose monitoring devices 2019 & 2032
- Table 33: Global Blood Glucose Monitoring Industry in Canada Revenue Million Forecast, by Country 2019 & 2032
- Table 34: Global Blood Glucose Monitoring Industry in Canada Volume K Unit Forecast, by Country 2019 & 2032
- Table 35: Brazil Blood Glucose Monitoring Industry in Canada Revenue (Million) Forecast, by Application 2019 & 2032
- Table 36: Brazil Blood Glucose Monitoring Industry in Canada Volume (K Unit) Forecast, by Application 2019 & 2032
- Table 37: Argentina Blood Glucose Monitoring Industry in Canada Revenue (Million) Forecast, by Application 2019 & 2032
- Table 38: Argentina Blood Glucose Monitoring Industry in Canada Volume (K Unit) Forecast, by Application 2019 & 2032
- Table 39: Rest of South America Blood Glucose Monitoring Industry in Canada Revenue (Million) Forecast, by Application 2019 & 2032
- Table 40: Rest of South America Blood Glucose Monitoring Industry in Canada Volume (K Unit) Forecast, by Application 2019 & 2032
- Table 41: Global Blood Glucose Monitoring Industry in Canada Revenue Million Forecast, by Self-monitoring blood glucose devices 2019 & 2032
- Table 42: Global Blood Glucose Monitoring Industry in Canada Volume K Unit Forecast, by Self-monitoring blood glucose devices 2019 & 2032
- Table 43: Global Blood Glucose Monitoring Industry in Canada Revenue Million Forecast, by Continuous blood glucose monitoring devices 2019 & 2032
- Table 44: Global Blood Glucose Monitoring Industry in Canada Volume K Unit Forecast, by Continuous blood glucose monitoring devices 2019 & 2032
- Table 45: Global Blood Glucose Monitoring Industry in Canada Revenue Million Forecast, by Country 2019 & 2032
- Table 46: Global Blood Glucose Monitoring Industry in Canada Volume K Unit Forecast, by Country 2019 & 2032
- Table 47: United Kingdom Blood Glucose Monitoring Industry in Canada Revenue (Million) Forecast, by Application 2019 & 2032
- Table 48: United Kingdom Blood Glucose Monitoring Industry in Canada Volume (K Unit) Forecast, by Application 2019 & 2032
- Table 49: Germany Blood Glucose Monitoring Industry in Canada Revenue (Million) Forecast, by Application 2019 & 2032
- Table 50: Germany Blood Glucose Monitoring Industry in Canada Volume (K Unit) Forecast, by Application 2019 & 2032
- Table 51: France Blood Glucose Monitoring Industry in Canada Revenue (Million) Forecast, by Application 2019 & 2032
- Table 52: France Blood Glucose Monitoring Industry in Canada Volume (K Unit) Forecast, by Application 2019 & 2032
- Table 53: Italy Blood Glucose Monitoring Industry in Canada Revenue (Million) Forecast, by Application 2019 & 2032
- Table 54: Italy Blood Glucose Monitoring Industry in Canada Volume (K Unit) Forecast, by Application 2019 & 2032
- Table 55: Spain Blood Glucose Monitoring Industry in Canada Revenue (Million) Forecast, by Application 2019 & 2032
- Table 56: Spain Blood Glucose Monitoring Industry in Canada Volume (K Unit) Forecast, by Application 2019 & 2032
- Table 57: Russia Blood Glucose Monitoring Industry in Canada Revenue (Million) Forecast, by Application 2019 & 2032
- Table 58: Russia Blood Glucose Monitoring Industry in Canada Volume (K Unit) Forecast, by Application 2019 & 2032
- Table 59: Benelux Blood Glucose Monitoring Industry in Canada Revenue (Million) Forecast, by Application 2019 & 2032
- Table 60: Benelux Blood Glucose Monitoring Industry in Canada Volume (K Unit) Forecast, by Application 2019 & 2032
- Table 61: Nordics Blood Glucose Monitoring Industry in Canada Revenue (Million) Forecast, by Application 2019 & 2032
- Table 62: Nordics Blood Glucose Monitoring Industry in Canada Volume (K Unit) Forecast, by Application 2019 & 2032
- Table 63: Rest of Europe Blood Glucose Monitoring Industry in Canada Revenue (Million) Forecast, by Application 2019 & 2032
- Table 64: Rest of Europe Blood Glucose Monitoring Industry in Canada Volume (K Unit) Forecast, by Application 2019 & 2032
- Table 65: Global Blood Glucose Monitoring Industry in Canada Revenue Million Forecast, by Self-monitoring blood glucose devices 2019 & 2032
- Table 66: Global Blood Glucose Monitoring Industry in Canada Volume K Unit Forecast, by Self-monitoring blood glucose devices 2019 & 2032
- Table 67: Global Blood Glucose Monitoring Industry in Canada Revenue Million Forecast, by Continuous blood glucose monitoring devices 2019 & 2032
- Table 68: Global Blood Glucose Monitoring Industry in Canada Volume K Unit Forecast, by Continuous blood glucose monitoring devices 2019 & 2032
- Table 69: Global Blood Glucose Monitoring Industry in Canada Revenue Million Forecast, by Country 2019 & 2032
- Table 70: Global Blood Glucose Monitoring Industry in Canada Volume K Unit Forecast, by Country 2019 & 2032
- Table 71: Turkey Blood Glucose Monitoring Industry in Canada Revenue (Million) Forecast, by Application 2019 & 2032
- Table 72: Turkey Blood Glucose Monitoring Industry in Canada Volume (K Unit) Forecast, by Application 2019 & 2032
- Table 73: Israel Blood Glucose Monitoring Industry in Canada Revenue (Million) Forecast, by Application 2019 & 2032
- Table 74: Israel Blood Glucose Monitoring Industry in Canada Volume (K Unit) Forecast, by Application 2019 & 2032
- Table 75: GCC Blood Glucose Monitoring Industry in Canada Revenue (Million) Forecast, by Application 2019 & 2032
- Table 76: GCC Blood Glucose Monitoring Industry in Canada Volume (K Unit) Forecast, by Application 2019 & 2032
- Table 77: North Africa Blood Glucose Monitoring Industry in Canada Revenue (Million) Forecast, by Application 2019 & 2032
- Table 78: North Africa Blood Glucose Monitoring Industry in Canada Volume (K Unit) Forecast, by Application 2019 & 2032
- Table 79: South Africa Blood Glucose Monitoring Industry in Canada Revenue (Million) Forecast, by Application 2019 & 2032
- Table 80: South Africa Blood Glucose Monitoring Industry in Canada Volume (K Unit) Forecast, by Application 2019 & 2032
- Table 81: Rest of Middle East & Africa Blood Glucose Monitoring Industry in Canada Revenue (Million) Forecast, by Application 2019 & 2032
- Table 82: Rest of Middle East & Africa Blood Glucose Monitoring Industry in Canada Volume (K Unit) Forecast, by Application 2019 & 2032
- Table 83: Global Blood Glucose Monitoring Industry in Canada Revenue Million Forecast, by Self-monitoring blood glucose devices 2019 & 2032
- Table 84: Global Blood Glucose Monitoring Industry in Canada Volume K Unit Forecast, by Self-monitoring blood glucose devices 2019 & 2032
- Table 85: Global Blood Glucose Monitoring Industry in Canada Revenue Million Forecast, by Continuous blood glucose monitoring devices 2019 & 2032
- Table 86: Global Blood Glucose Monitoring Industry in Canada Volume K Unit Forecast, by Continuous blood glucose monitoring devices 2019 & 2032
- Table 87: Global Blood Glucose Monitoring Industry in Canada Revenue Million Forecast, by Country 2019 & 2032
- Table 88: Global Blood Glucose Monitoring Industry in Canada Volume K Unit Forecast, by Country 2019 & 2032
- Table 89: China Blood Glucose Monitoring Industry in Canada Revenue (Million) Forecast, by Application 2019 & 2032
- Table 90: China Blood Glucose Monitoring Industry in Canada Volume (K Unit) Forecast, by Application 2019 & 2032
- Table 91: India Blood Glucose Monitoring Industry in Canada Revenue (Million) Forecast, by Application 2019 & 2032
- Table 92: India Blood Glucose Monitoring Industry in Canada Volume (K Unit) Forecast, by Application 2019 & 2032
- Table 93: Japan Blood Glucose Monitoring Industry in Canada Revenue (Million) Forecast, by Application 2019 & 2032
- Table 94: Japan Blood Glucose Monitoring Industry in Canada Volume (K Unit) Forecast, by Application 2019 & 2032
- Table 95: South Korea Blood Glucose Monitoring Industry in Canada Revenue (Million) Forecast, by Application 2019 & 2032
- Table 96: South Korea Blood Glucose Monitoring Industry in Canada Volume (K Unit) Forecast, by Application 2019 & 2032
- Table 97: ASEAN Blood Glucose Monitoring Industry in Canada Revenue (Million) Forecast, by Application 2019 & 2032
- Table 98: ASEAN Blood Glucose Monitoring Industry in Canada Volume (K Unit) Forecast, by Application 2019 & 2032
- Table 99: Oceania Blood Glucose Monitoring Industry in Canada Revenue (Million) Forecast, by Application 2019 & 2032
- Table 100: Oceania Blood Glucose Monitoring Industry in Canada Volume (K Unit) Forecast, by Application 2019 & 2032
- Table 101: Rest of Asia Pacific Blood Glucose Monitoring Industry in Canada Revenue (Million) Forecast, by Application 2019 & 2032
- Table 102: Rest of Asia Pacific Blood Glucose Monitoring Industry in Canada Volume (K Unit) Forecast, by Application 2019 & 2032
Frequently Asked Questions
1. What is the projected Compound Annual Growth Rate (CAGR) of the Blood Glucose Monitoring Industry in Canada?
The projected CAGR is approximately 15.11%.
2. Which companies are prominent players in the Blood Glucose Monitoring Industry in Canada?
Key companies in the market include Trivida Functional Medicine, Abbott Diabetes Care, Dexcom Inc, Acon Laboratories Inc, Medtronic PLC, Agamatrix Inc, Senseonics, Self-monitoring Blood Glucose Devices, Bionime Corporation, LifeScan, Roche Holding AG, Arkray Inc, Ascensia Diabetes Care.
3. What are the main segments of the Blood Glucose Monitoring Industry in Canada?
The market segments include Self-monitoring blood glucose devices, Continuous blood glucose monitoring devices.
4. Can you provide details about the market size?
The market size is estimated to be USD 1.05 Million as of 2022.
5. What are some drivers contributing to market growth?
Rising Prevalence of Cancer Worldwide; Technological Advancements in Diagnostic Testing; Increasing Demand for Point-of-care Treatment.
6. What are the notable trends driving market growth?
Increasing Type-1 diabetes population across Canada.
7. Are there any restraints impacting market growth?
High Cost of Molecular Diagnostic Tests; Lack of Skilled Workforce and Stringent Regulatory Framework.
8. Can you provide examples of recent developments in the market?
July 2023: The Dexcom G7 has been authorized for use in Canada. This CGM system is now accessible to individuals aged two years and above who have any form of diabetes
9. What pricing options are available for accessing the report?
Pricing options include single-user, multi-user, and enterprise licenses priced at USD 3800, USD 4500, and USD 5800 respectively.
10. Is the market size provided in terms of value or volume?
The market size is provided in terms of value, measured in Million and volume, measured in K Unit.
11. Are there any specific market keywords associated with the report?
Yes, the market keyword associated with the report is "Blood Glucose Monitoring Industry in Canada," which aids in identifying and referencing the specific market segment covered.
12. How do I determine which pricing option suits my needs best?
The pricing options vary based on user requirements and access needs. Individual users may opt for single-user licenses, while businesses requiring broader access may choose multi-user or enterprise licenses for cost-effective access to the report.
13. Are there any additional resources or data provided in the Blood Glucose Monitoring Industry in Canada report?
While the report offers comprehensive insights, it's advisable to review the specific contents or supplementary materials provided to ascertain if additional resources or data are available.
14. How can I stay updated on further developments or reports in the Blood Glucose Monitoring Industry in Canada?
To stay informed about further developments, trends, and reports in the Blood Glucose Monitoring Industry in Canada, consider subscribing to industry newsletters, following relevant companies and organizations, or regularly checking reputable industry news sources and publications.
Methodology
Step 1 - Identification of Relevant Samples Size from Population Database


Step 2 - Approaches for Defining Global Market Size (Value, Volume* & Price*)

Note*: In applicable scenarios
Step 3 - Data Sources
Primary Research
- Web Analytics
- Survey Reports
- Research Institute
- Latest Research Reports
- Opinion Leaders
Secondary Research
- Annual Reports
- White Paper
- Latest Press Release
- Industry Association
- Paid Database
- Investor Presentations

Step 4 - Data Triangulation
Involves using different sources of information in order to increase the validity of a study
These sources are likely to be stakeholders in a program - participants, other researchers, program staff, other community members, and so on.
Then we put all data in single framework & apply various statistical tools to find out the dynamic on the market.
During the analysis stage, feedback from the stakeholder groups would be compared to determine areas of agreement as well as areas of divergence


