
Key Insights
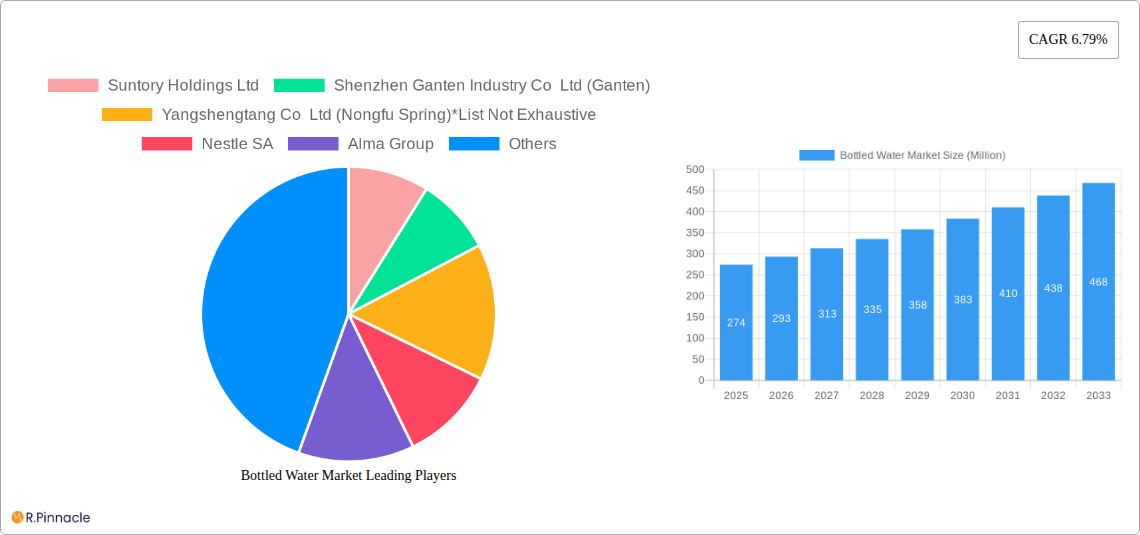
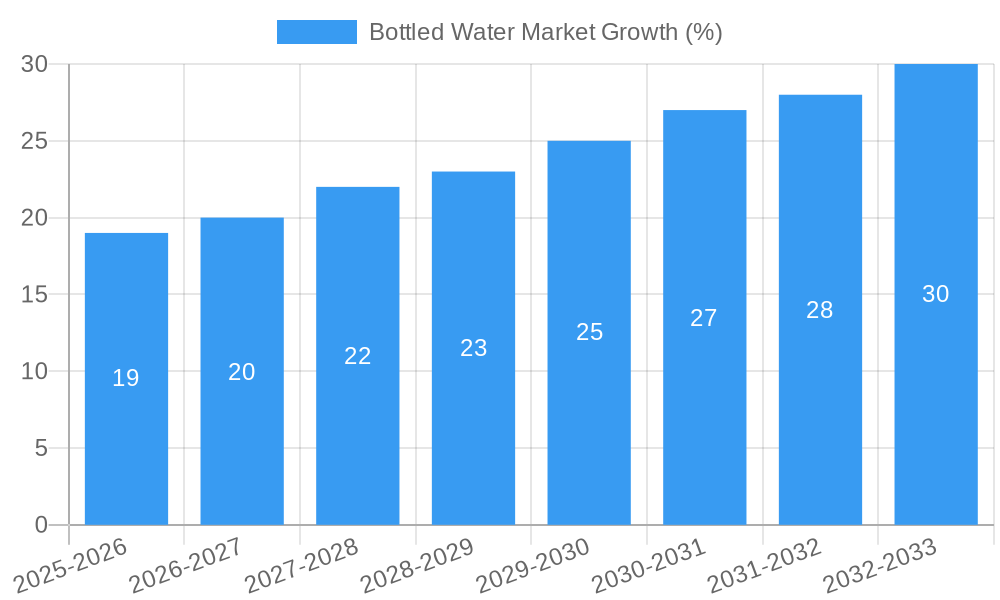
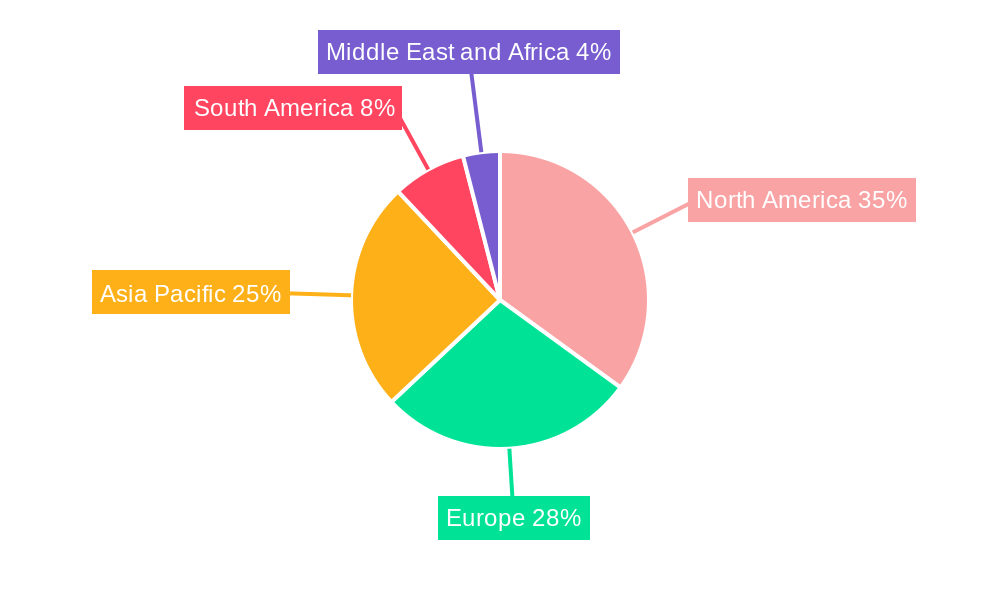
The global bottled water market, valued at $274 million in 2025, is projected to experience robust growth, driven by several key factors. Increasing health consciousness among consumers, coupled with concerns over tap water quality in many regions, fuels strong demand for bottled water as a convenient and perceived healthier alternative. The rising popularity of functional and flavored waters, catering to specific health needs and preferences, further contributes to market expansion. Convenience, particularly in busy lifestyles and on-the-go consumption, is a major driver, with the off-trade segment (retail stores, supermarkets) exhibiting significant growth. However, environmental concerns regarding plastic waste generated by single-use plastic bottles pose a significant restraint, prompting manufacturers to invest in sustainable packaging solutions like recycled plastic and plant-based alternatives. Market segmentation reveals a strong preference for still water, although sparkling and functional waters are gaining considerable traction, especially among younger demographics. Competitive rivalry is intense, with both established beverage giants like Coca-Cola and Nestle, and regional players like Nongfu Spring, vying for market share through product innovation, branding, and distribution strategies. Geographic growth is varied, with North America and Asia Pacific expected to be leading contributors, driven by increasing disposable incomes and changing consumer habits.
The forecast period (2025-2033) anticipates continued expansion, with the 6.79% CAGR indicating substantial growth potential. Key players are strategically adapting their offerings and business models to mitigate environmental concerns and capture emerging market opportunities. Growth within specific segments such as functional waters will likely outpace the overall market average. Regional variations will persist, reflecting differences in economic development, consumer preferences, and regulatory frameworks concerning plastic waste management. Companies are focusing on sustainable sourcing, efficient logistics, and targeted marketing campaigns to maintain competitiveness and maximize their share of this dynamic and expanding market.
Bottled Water Market: A Comprehensive Report (2019-2033)
This comprehensive report provides an in-depth analysis of the global bottled water market, offering valuable insights for industry professionals, investors, and strategic decision-makers. With a study period spanning 2019-2033, a base year of 2025, and a forecast period of 2025-2033, this report covers market size, segmentation, trends, and competitive dynamics. The report leverages extensive data analysis to project a market valued at xx Million by 2033.
Bottled Water Market Structure & Innovation Trends
This section analyzes the market's competitive landscape, identifying key players and their market share. We examine the drivers of innovation, regulatory influences, and the role of substitute products. The impact of mergers and acquisitions (M&A) is also explored, including deal values.
- Market Concentration: The bottled water market is characterized by a mix of large multinational corporations and regional players. The top ten companies hold approximately xx% of the global market share in 2025. This includes giants like Nestle SA, The Coca-Cola Company, and PepsiCo Inc., along with significant regional players such as Suntory Holdings Ltd and Nongfu Spring.
- Innovation Drivers: Key drivers include consumer demand for healthier alternatives, growing health consciousness, and increasing disposable incomes. Innovation is focused on product diversification (e.g., functional waters, flavored waters), sustainable packaging, and improved distribution channels.
- Regulatory Frameworks: Government regulations regarding water safety, labeling, and plastic waste management significantly impact market dynamics. Variations in regulations across different countries and regions create diverse market opportunities and challenges.
- Product Substitutes: Tap water and other beverages pose a competitive threat. However, the convenience, perceived purity, and variety of bottled water continue to drive demand.
- End-User Demographics: The market caters to a wide demographic, with significant consumption across all age groups and income levels. However, specific segments, such as health-conscious millennials and Gen Z, are particularly influential.
- M&A Activities: The bottled water market has witnessed significant M&A activity in recent years, with deal values totaling approximately xx Million between 2019 and 2024. These activities have reshaped the competitive landscape, leading to increased consolidation.
Bottled Water Market Dynamics & Trends
This section delves into the market's growth trajectory, exploring factors influencing its expansion. We analyze technological advancements, evolving consumer preferences, and competitive strategies. Key metrics like Compound Annual Growth Rate (CAGR) and market penetration are provided.
The global bottled water market is experiencing robust growth, driven by increasing urbanization, rising disposable incomes, and changing lifestyle patterns. The market is projected to exhibit a CAGR of xx% during the forecast period (2025-2033). Increased health consciousness among consumers, particularly in developing economies, fuels the demand for healthier hydration options. Technological advancements in packaging and distribution are also playing a significant role. However, growing concerns about plastic waste and its environmental impact are creating challenges for the industry. Competitive dynamics are intense, with leading players constantly innovating to capture market share and maintain their position. Market penetration in developing regions is still increasing, offering substantial growth potential.
Dominant Regions & Segments in Bottled Water Market
This section identifies the leading regions and market segments (by distribution channel and product type). We analyze the factors driving their dominance, including economic policies, infrastructure development, and consumer preferences.
- Leading Regions: [Insert dominant region analysis here - e.g., North America continues to be the largest market, driven by high per capita consumption. Asia-Pacific is a fast-growing region with significant potential.]
- By Distribution Channel:
- On-trade: [Analysis of on-trade segment, including key drivers and growth projections.]
- Off-trade: [Analysis of off-trade segment, including key drivers and growth projections.]
- By Type:
- Still Water: [Analysis of still water segment, including key drivers and growth projections.]
- Sparkling Water: [Analysis of sparkling water segment, including key drivers and growth projections.]
- Functional/Flavored Water: [Analysis of functional/flavored water segment, including key drivers and growth projections.]
[Detailed dominance analysis for each region and segment goes here, approximately 600 words total, using bullet points for key drivers and paragraphs for detailed analysis.]
Bottled Water Market Product Innovations
Recent innovations focus on sustainable packaging, functional ingredients, and enhanced flavors. Smartwater's launch of aluminum cans and Topo Chico's expansion into flavored sparkling waters exemplify this trend. These innovations cater to growing consumer demand for environmentally friendly options and diverse taste preferences. The market is witnessing a shift towards healthier and more convenient bottled water options, further driving innovation and competition.
Report Scope & Segmentation Analysis
This report segments the bottled water market by distribution channel (on-trade and off-trade) and product type (still water, sparkling water, and functional/flavored water). Each segment's growth projections, market size, and competitive dynamics are analyzed. [Paragraphs detailing each segment's growth projections, market sizes, and competitive dynamics go here, approximately 100-150 words per segment.]
Key Drivers of Bottled Water Market Growth
Several factors contribute to the market's growth, including rising health awareness, increasing urbanization, and the convenience of bottled water. Government regulations also play a role, as stricter standards for water safety and labeling can boost consumer confidence. Technological advancements in packaging and distribution further enhance accessibility and sustainability.
Challenges in the Bottled Water Market Sector
The bottled water market faces challenges, including environmental concerns related to plastic waste, intense competition, and fluctuating raw material prices. Regulatory hurdles and supply chain disruptions can also impact market stability. Quantifiable impacts of these challenges are analyzed and presented within the report.
Emerging Opportunities in Bottled Water Market
Emerging opportunities include the growing demand for functional and flavored waters, the potential for eco-friendly packaging, and expansion into new markets. Technological advancements in water purification and distribution systems can create new avenues for growth. Increased focus on sustainability and health-conscious consumer preferences are key to unlocking new opportunities.
Leading Players in the Bottled Water Market Market
- Suntory Holdings Ltd
- Shenzhen Ganten Industry Co Ltd (Ganten)
- Yangshengtang Co Ltd (Nongfu Spring)
- Nestle SA
- Alma Group
- PepsiCo Inc
- Parle Agro Pvt Ltd
- Danone SA
- The Coca-Cola Company
- BlueTriton Brands Inc
Key Developments in Bottled Water Market Industry
- February 2024: Nongfu Spring invested CNY 5 billion (approx. USD 703 million) into a new factory in Jiande City, Zhejiang Province, significantly expanding its production capacity.
- February 2024: The Topo Chico brand launched a range of sparkling mineral water flavors, expanding its product portfolio and targeting the growing demand for flavored beverages.
- April 2024: Smartwater launched its alkaline and sparkling waters in designed aluminum cans, demonstrating a commitment to sustainable packaging and responding to consumer demand for eco-friendly products.
Future Outlook for Bottled Water Market Market
The bottled water market is poised for continued growth, driven by increasing consumer demand, innovation in product offerings, and expansion into new markets. Strategic opportunities lie in sustainable packaging solutions, functional water development, and leveraging digital marketing to reach target audiences. The market is expected to witness further consolidation through mergers and acquisitions, shaping the competitive landscape in the coming years.
Bottled Water Market Segmentation
-
1. Type
- 1.1. Still Water
- 1.2. Sparkling Water
- 1.3. Functional/Flavored Water
-
2. Distribution Channel
- 2.1. On-trade
-
2.2. Off-trade
- 2.2.1. Supermarkets/Hypermarkets
- 2.2.2. Convenience/Grocery Stores
- 2.2.3. Home and Office Delivery
- 2.2.4. Online Retail Stores
- 2.2.5. Other Off-trade Channels
Bottled Water Market Segmentation By Geography
-
1. North America
- 1.1. United States
- 1.2. Canada
- 1.3. Mexico
- 1.4. Rest of North America
-
2. Europe
- 2.1. Spain
- 2.2. United Kingdom
- 2.3. Germany
- 2.4. France
- 2.5. Italy
- 2.6. Russia
- 2.7. Rest of Europe
-
3. Asia Pacific
- 3.1. China
- 3.2. Japan
- 3.3. India
- 3.4. Australia
- 3.5. Rest of Asia Pacific
-
4. South America
- 4.1. Brazil
- 4.2. Argentina
- 4.3. Rest of South America
-
5. Middle East and Africa
- 5.1. South Africa
- 5.2. Saudi Arabia
- 5.3. Rest of Middle East and Africa
Bottled Water Market REPORT HIGHLIGHTS
| Aspects | Details |
|---|---|
| Study Period | 2019-2033 |
| Base Year | 2024 |
| Estimated Year | 2025 |
| Forecast Period | 2025-2033 |
| Historical Period | 2019-2024 |
| Growth Rate | CAGR of 6.79% from 2019-2033 |
| Segmentation |
|
Table of Contents
- 1. Introduction
- 1.1. Research Scope
- 1.2. Market Segmentation
- 1.3. Research Methodology
- 1.4. Definitions and Assumptions
- 2. Executive Summary
- 2.1. Introduction
- 3. Market Dynamics
- 3.1. Introduction
- 3.2. Market Drivers
- 3.2.1. Consumer Preference Of Pure And Healthy Hydration; Advertisements And Promotional Campaigns Supporting Demand
- 3.3. Market Restrains
- 3.3.1. Presence Of Inferior Quality Products And Nanoplastics In Bottled Water
- 3.4. Market Trends
- 3.4.1. Consumer Preference Of Pure And Healthy Hydration
- 4. Market Factor Analysis
- 4.1. Porters Five Forces
- 4.2. Supply/Value Chain
- 4.3. PESTEL analysis
- 4.4. Market Entropy
- 4.5. Patent/Trademark Analysis
- 5. Global Bottled Water Market Analysis, Insights and Forecast, 2019-2031
- 5.1. Market Analysis, Insights and Forecast - by Type
- 5.1.1. Still Water
- 5.1.2. Sparkling Water
- 5.1.3. Functional/Flavored Water
- 5.2. Market Analysis, Insights and Forecast - by Distribution Channel
- 5.2.1. On-trade
- 5.2.2. Off-trade
- 5.2.2.1. Supermarkets/Hypermarkets
- 5.2.2.2. Convenience/Grocery Stores
- 5.2.2.3. Home and Office Delivery
- 5.2.2.4. Online Retail Stores
- 5.2.2.5. Other Off-trade Channels
- 5.3. Market Analysis, Insights and Forecast - by Region
- 5.3.1. North America
- 5.3.2. Europe
- 5.3.3. Asia Pacific
- 5.3.4. South America
- 5.3.5. Middle East and Africa
- 5.1. Market Analysis, Insights and Forecast - by Type
- 6. North America Bottled Water Market Analysis, Insights and Forecast, 2019-2031
- 6.1. Market Analysis, Insights and Forecast - by Type
- 6.1.1. Still Water
- 6.1.2. Sparkling Water
- 6.1.3. Functional/Flavored Water
- 6.2. Market Analysis, Insights and Forecast - by Distribution Channel
- 6.2.1. On-trade
- 6.2.2. Off-trade
- 6.2.2.1. Supermarkets/Hypermarkets
- 6.2.2.2. Convenience/Grocery Stores
- 6.2.2.3. Home and Office Delivery
- 6.2.2.4. Online Retail Stores
- 6.2.2.5. Other Off-trade Channels
- 6.1. Market Analysis, Insights and Forecast - by Type
- 7. Europe Bottled Water Market Analysis, Insights and Forecast, 2019-2031
- 7.1. Market Analysis, Insights and Forecast - by Type
- 7.1.1. Still Water
- 7.1.2. Sparkling Water
- 7.1.3. Functional/Flavored Water
- 7.2. Market Analysis, Insights and Forecast - by Distribution Channel
- 7.2.1. On-trade
- 7.2.2. Off-trade
- 7.2.2.1. Supermarkets/Hypermarkets
- 7.2.2.2. Convenience/Grocery Stores
- 7.2.2.3. Home and Office Delivery
- 7.2.2.4. Online Retail Stores
- 7.2.2.5. Other Off-trade Channels
- 7.1. Market Analysis, Insights and Forecast - by Type
- 8. Asia Pacific Bottled Water Market Analysis, Insights and Forecast, 2019-2031
- 8.1. Market Analysis, Insights and Forecast - by Type
- 8.1.1. Still Water
- 8.1.2. Sparkling Water
- 8.1.3. Functional/Flavored Water
- 8.2. Market Analysis, Insights and Forecast - by Distribution Channel
- 8.2.1. On-trade
- 8.2.2. Off-trade
- 8.2.2.1. Supermarkets/Hypermarkets
- 8.2.2.2. Convenience/Grocery Stores
- 8.2.2.3. Home and Office Delivery
- 8.2.2.4. Online Retail Stores
- 8.2.2.5. Other Off-trade Channels
- 8.1. Market Analysis, Insights and Forecast - by Type
- 9. South America Bottled Water Market Analysis, Insights and Forecast, 2019-2031
- 9.1. Market Analysis, Insights and Forecast - by Type
- 9.1.1. Still Water
- 9.1.2. Sparkling Water
- 9.1.3. Functional/Flavored Water
- 9.2. Market Analysis, Insights and Forecast - by Distribution Channel
- 9.2.1. On-trade
- 9.2.2. Off-trade
- 9.2.2.1. Supermarkets/Hypermarkets
- 9.2.2.2. Convenience/Grocery Stores
- 9.2.2.3. Home and Office Delivery
- 9.2.2.4. Online Retail Stores
- 9.2.2.5. Other Off-trade Channels
- 9.1. Market Analysis, Insights and Forecast - by Type
- 10. Middle East and Africa Bottled Water Market Analysis, Insights and Forecast, 2019-2031
- 10.1. Market Analysis, Insights and Forecast - by Type
- 10.1.1. Still Water
- 10.1.2. Sparkling Water
- 10.1.3. Functional/Flavored Water
- 10.2. Market Analysis, Insights and Forecast - by Distribution Channel
- 10.2.1. On-trade
- 10.2.2. Off-trade
- 10.2.2.1. Supermarkets/Hypermarkets
- 10.2.2.2. Convenience/Grocery Stores
- 10.2.2.3. Home and Office Delivery
- 10.2.2.4. Online Retail Stores
- 10.2.2.5. Other Off-trade Channels
- 10.1. Market Analysis, Insights and Forecast - by Type
- 11. North America Bottled Water Market Analysis, Insights and Forecast, 2019-2031
- 11.1. Market Analysis, Insights and Forecast - By Country/Sub-region
- 11.1.1 United States
- 11.1.2 Canada
- 11.1.3 Mexico
- 11.1.4 Rest of North America
- 12. Europe Bottled Water Market Analysis, Insights and Forecast, 2019-2031
- 12.1. Market Analysis, Insights and Forecast - By Country/Sub-region
- 12.1.1 Spain
- 12.1.2 United Kingdom
- 12.1.3 Germany
- 12.1.4 France
- 12.1.5 Italy
- 12.1.6 Russia
- 12.1.7 Rest of Europe
- 13. Asia Pacific Bottled Water Market Analysis, Insights and Forecast, 2019-2031
- 13.1. Market Analysis, Insights and Forecast - By Country/Sub-region
- 13.1.1 China
- 13.1.2 Japan
- 13.1.3 India
- 13.1.4 Australia
- 13.1.5 Rest of Asia Pacific
- 14. South America Bottled Water Market Analysis, Insights and Forecast, 2019-2031
- 14.1. Market Analysis, Insights and Forecast - By Country/Sub-region
- 14.1.1 Brazil
- 14.1.2 Argentina
- 14.1.3 Rest of South America
- 15. Middle East and Africa Bottled Water Market Analysis, Insights and Forecast, 2019-2031
- 15.1. Market Analysis, Insights and Forecast - By Country/Sub-region
- 15.1.1 South Africa
- 15.1.2 Saudi Arabia
- 15.1.3 Rest of Middle East and Africa
- 16. Competitive Analysis
- 16.1. Global Market Share Analysis 2024
- 16.2. Company Profiles
- 16.2.1 Suntory Holdings Ltd
- 16.2.1.1. Overview
- 16.2.1.2. Products
- 16.2.1.3. SWOT Analysis
- 16.2.1.4. Recent Developments
- 16.2.1.5. Financials (Based on Availability)
- 16.2.2 Shenzhen Ganten Industry Co Ltd (Ganten)
- 16.2.2.1. Overview
- 16.2.2.2. Products
- 16.2.2.3. SWOT Analysis
- 16.2.2.4. Recent Developments
- 16.2.2.5. Financials (Based on Availability)
- 16.2.3 Yangshengtang Co Ltd (Nongfu Spring)*List Not Exhaustive
- 16.2.3.1. Overview
- 16.2.3.2. Products
- 16.2.3.3. SWOT Analysis
- 16.2.3.4. Recent Developments
- 16.2.3.5. Financials (Based on Availability)
- 16.2.4 Nestle SA
- 16.2.4.1. Overview
- 16.2.4.2. Products
- 16.2.4.3. SWOT Analysis
- 16.2.4.4. Recent Developments
- 16.2.4.5. Financials (Based on Availability)
- 16.2.5 Alma Group
- 16.2.5.1. Overview
- 16.2.5.2. Products
- 16.2.5.3. SWOT Analysis
- 16.2.5.4. Recent Developments
- 16.2.5.5. Financials (Based on Availability)
- 16.2.6 PepsiCo Inc
- 16.2.6.1. Overview
- 16.2.6.2. Products
- 16.2.6.3. SWOT Analysis
- 16.2.6.4. Recent Developments
- 16.2.6.5. Financials (Based on Availability)
- 16.2.7 Parle Agro Pvt Ltd
- 16.2.7.1. Overview
- 16.2.7.2. Products
- 16.2.7.3. SWOT Analysis
- 16.2.7.4. Recent Developments
- 16.2.7.5. Financials (Based on Availability)
- 16.2.8 Danone SA
- 16.2.8.1. Overview
- 16.2.8.2. Products
- 16.2.8.3. SWOT Analysis
- 16.2.8.4. Recent Developments
- 16.2.8.5. Financials (Based on Availability)
- 16.2.9 The Coca-Cola Company
- 16.2.9.1. Overview
- 16.2.9.2. Products
- 16.2.9.3. SWOT Analysis
- 16.2.9.4. Recent Developments
- 16.2.9.5. Financials (Based on Availability)
- 16.2.10 BlueTriton Brands Inc
- 16.2.10.1. Overview
- 16.2.10.2. Products
- 16.2.10.3. SWOT Analysis
- 16.2.10.4. Recent Developments
- 16.2.10.5. Financials (Based on Availability)
- 16.2.1 Suntory Holdings Ltd
List of Figures
- Figure 1: Global Bottled Water Market Revenue Breakdown (Million, %) by Region 2024 & 2032
- Figure 2: North America Bottled Water Market Revenue (Million), by Country 2024 & 2032
- Figure 3: North America Bottled Water Market Revenue Share (%), by Country 2024 & 2032
- Figure 4: Europe Bottled Water Market Revenue (Million), by Country 2024 & 2032
- Figure 5: Europe Bottled Water Market Revenue Share (%), by Country 2024 & 2032
- Figure 6: Asia Pacific Bottled Water Market Revenue (Million), by Country 2024 & 2032
- Figure 7: Asia Pacific Bottled Water Market Revenue Share (%), by Country 2024 & 2032
- Figure 8: South America Bottled Water Market Revenue (Million), by Country 2024 & 2032
- Figure 9: South America Bottled Water Market Revenue Share (%), by Country 2024 & 2032
- Figure 10: Middle East and Africa Bottled Water Market Revenue (Million), by Country 2024 & 2032
- Figure 11: Middle East and Africa Bottled Water Market Revenue Share (%), by Country 2024 & 2032
- Figure 12: North America Bottled Water Market Revenue (Million), by Type 2024 & 2032
- Figure 13: North America Bottled Water Market Revenue Share (%), by Type 2024 & 2032
- Figure 14: North America Bottled Water Market Revenue (Million), by Distribution Channel 2024 & 2032
- Figure 15: North America Bottled Water Market Revenue Share (%), by Distribution Channel 2024 & 2032
- Figure 16: North America Bottled Water Market Revenue (Million), by Country 2024 & 2032
- Figure 17: North America Bottled Water Market Revenue Share (%), by Country 2024 & 2032
- Figure 18: Europe Bottled Water Market Revenue (Million), by Type 2024 & 2032
- Figure 19: Europe Bottled Water Market Revenue Share (%), by Type 2024 & 2032
- Figure 20: Europe Bottled Water Market Revenue (Million), by Distribution Channel 2024 & 2032
- Figure 21: Europe Bottled Water Market Revenue Share (%), by Distribution Channel 2024 & 2032
- Figure 22: Europe Bottled Water Market Revenue (Million), by Country 2024 & 2032
- Figure 23: Europe Bottled Water Market Revenue Share (%), by Country 2024 & 2032
- Figure 24: Asia Pacific Bottled Water Market Revenue (Million), by Type 2024 & 2032
- Figure 25: Asia Pacific Bottled Water Market Revenue Share (%), by Type 2024 & 2032
- Figure 26: Asia Pacific Bottled Water Market Revenue (Million), by Distribution Channel 2024 & 2032
- Figure 27: Asia Pacific Bottled Water Market Revenue Share (%), by Distribution Channel 2024 & 2032
- Figure 28: Asia Pacific Bottled Water Market Revenue (Million), by Country 2024 & 2032
- Figure 29: Asia Pacific Bottled Water Market Revenue Share (%), by Country 2024 & 2032
- Figure 30: South America Bottled Water Market Revenue (Million), by Type 2024 & 2032
- Figure 31: South America Bottled Water Market Revenue Share (%), by Type 2024 & 2032
- Figure 32: South America Bottled Water Market Revenue (Million), by Distribution Channel 2024 & 2032
- Figure 33: South America Bottled Water Market Revenue Share (%), by Distribution Channel 2024 & 2032
- Figure 34: South America Bottled Water Market Revenue (Million), by Country 2024 & 2032
- Figure 35: South America Bottled Water Market Revenue Share (%), by Country 2024 & 2032
- Figure 36: Middle East and Africa Bottled Water Market Revenue (Million), by Type 2024 & 2032
- Figure 37: Middle East and Africa Bottled Water Market Revenue Share (%), by Type 2024 & 2032
- Figure 38: Middle East and Africa Bottled Water Market Revenue (Million), by Distribution Channel 2024 & 2032
- Figure 39: Middle East and Africa Bottled Water Market Revenue Share (%), by Distribution Channel 2024 & 2032
- Figure 40: Middle East and Africa Bottled Water Market Revenue (Million), by Country 2024 & 2032
- Figure 41: Middle East and Africa Bottled Water Market Revenue Share (%), by Country 2024 & 2032
List of Tables
- Table 1: Global Bottled Water Market Revenue Million Forecast, by Region 2019 & 2032
- Table 2: Global Bottled Water Market Revenue Million Forecast, by Type 2019 & 2032
- Table 3: Global Bottled Water Market Revenue Million Forecast, by Distribution Channel 2019 & 2032
- Table 4: Global Bottled Water Market Revenue Million Forecast, by Region 2019 & 2032
- Table 5: Global Bottled Water Market Revenue Million Forecast, by Country 2019 & 2032
- Table 6: United States Bottled Water Market Revenue (Million) Forecast, by Application 2019 & 2032
- Table 7: Canada Bottled Water Market Revenue (Million) Forecast, by Application 2019 & 2032
- Table 8: Mexico Bottled Water Market Revenue (Million) Forecast, by Application 2019 & 2032
- Table 9: Rest of North America Bottled Water Market Revenue (Million) Forecast, by Application 2019 & 2032
- Table 10: Global Bottled Water Market Revenue Million Forecast, by Country 2019 & 2032
- Table 11: Spain Bottled Water Market Revenue (Million) Forecast, by Application 2019 & 2032
- Table 12: United Kingdom Bottled Water Market Revenue (Million) Forecast, by Application 2019 & 2032
- Table 13: Germany Bottled Water Market Revenue (Million) Forecast, by Application 2019 & 2032
- Table 14: France Bottled Water Market Revenue (Million) Forecast, by Application 2019 & 2032
- Table 15: Italy Bottled Water Market Revenue (Million) Forecast, by Application 2019 & 2032
- Table 16: Russia Bottled Water Market Revenue (Million) Forecast, by Application 2019 & 2032
- Table 17: Rest of Europe Bottled Water Market Revenue (Million) Forecast, by Application 2019 & 2032
- Table 18: Global Bottled Water Market Revenue Million Forecast, by Country 2019 & 2032
- Table 19: China Bottled Water Market Revenue (Million) Forecast, by Application 2019 & 2032
- Table 20: Japan Bottled Water Market Revenue (Million) Forecast, by Application 2019 & 2032
- Table 21: India Bottled Water Market Revenue (Million) Forecast, by Application 2019 & 2032
- Table 22: Australia Bottled Water Market Revenue (Million) Forecast, by Application 2019 & 2032
- Table 23: Rest of Asia Pacific Bottled Water Market Revenue (Million) Forecast, by Application 2019 & 2032
- Table 24: Global Bottled Water Market Revenue Million Forecast, by Country 2019 & 2032
- Table 25: Brazil Bottled Water Market Revenue (Million) Forecast, by Application 2019 & 2032
- Table 26: Argentina Bottled Water Market Revenue (Million) Forecast, by Application 2019 & 2032
- Table 27: Rest of South America Bottled Water Market Revenue (Million) Forecast, by Application 2019 & 2032
- Table 28: Global Bottled Water Market Revenue Million Forecast, by Country 2019 & 2032
- Table 29: South Africa Bottled Water Market Revenue (Million) Forecast, by Application 2019 & 2032
- Table 30: Saudi Arabia Bottled Water Market Revenue (Million) Forecast, by Application 2019 & 2032
- Table 31: Rest of Middle East and Africa Bottled Water Market Revenue (Million) Forecast, by Application 2019 & 2032
- Table 32: Global Bottled Water Market Revenue Million Forecast, by Type 2019 & 2032
- Table 33: Global Bottled Water Market Revenue Million Forecast, by Distribution Channel 2019 & 2032
- Table 34: Global Bottled Water Market Revenue Million Forecast, by Country 2019 & 2032
- Table 35: United States Bottled Water Market Revenue (Million) Forecast, by Application 2019 & 2032
- Table 36: Canada Bottled Water Market Revenue (Million) Forecast, by Application 2019 & 2032
- Table 37: Mexico Bottled Water Market Revenue (Million) Forecast, by Application 2019 & 2032
- Table 38: Rest of North America Bottled Water Market Revenue (Million) Forecast, by Application 2019 & 2032
- Table 39: Global Bottled Water Market Revenue Million Forecast, by Type 2019 & 2032
- Table 40: Global Bottled Water Market Revenue Million Forecast, by Distribution Channel 2019 & 2032
- Table 41: Global Bottled Water Market Revenue Million Forecast, by Country 2019 & 2032
- Table 42: Spain Bottled Water Market Revenue (Million) Forecast, by Application 2019 & 2032
- Table 43: United Kingdom Bottled Water Market Revenue (Million) Forecast, by Application 2019 & 2032
- Table 44: Germany Bottled Water Market Revenue (Million) Forecast, by Application 2019 & 2032
- Table 45: France Bottled Water Market Revenue (Million) Forecast, by Application 2019 & 2032
- Table 46: Italy Bottled Water Market Revenue (Million) Forecast, by Application 2019 & 2032
- Table 47: Russia Bottled Water Market Revenue (Million) Forecast, by Application 2019 & 2032
- Table 48: Rest of Europe Bottled Water Market Revenue (Million) Forecast, by Application 2019 & 2032
- Table 49: Global Bottled Water Market Revenue Million Forecast, by Type 2019 & 2032
- Table 50: Global Bottled Water Market Revenue Million Forecast, by Distribution Channel 2019 & 2032
- Table 51: Global Bottled Water Market Revenue Million Forecast, by Country 2019 & 2032
- Table 52: China Bottled Water Market Revenue (Million) Forecast, by Application 2019 & 2032
- Table 53: Japan Bottled Water Market Revenue (Million) Forecast, by Application 2019 & 2032
- Table 54: India Bottled Water Market Revenue (Million) Forecast, by Application 2019 & 2032
- Table 55: Australia Bottled Water Market Revenue (Million) Forecast, by Application 2019 & 2032
- Table 56: Rest of Asia Pacific Bottled Water Market Revenue (Million) Forecast, by Application 2019 & 2032
- Table 57: Global Bottled Water Market Revenue Million Forecast, by Type 2019 & 2032
- Table 58: Global Bottled Water Market Revenue Million Forecast, by Distribution Channel 2019 & 2032
- Table 59: Global Bottled Water Market Revenue Million Forecast, by Country 2019 & 2032
- Table 60: Brazil Bottled Water Market Revenue (Million) Forecast, by Application 2019 & 2032
- Table 61: Argentina Bottled Water Market Revenue (Million) Forecast, by Application 2019 & 2032
- Table 62: Rest of South America Bottled Water Market Revenue (Million) Forecast, by Application 2019 & 2032
- Table 63: Global Bottled Water Market Revenue Million Forecast, by Type 2019 & 2032
- Table 64: Global Bottled Water Market Revenue Million Forecast, by Distribution Channel 2019 & 2032
- Table 65: Global Bottled Water Market Revenue Million Forecast, by Country 2019 & 2032
- Table 66: South Africa Bottled Water Market Revenue (Million) Forecast, by Application 2019 & 2032
- Table 67: Saudi Arabia Bottled Water Market Revenue (Million) Forecast, by Application 2019 & 2032
- Table 68: Rest of Middle East and Africa Bottled Water Market Revenue (Million) Forecast, by Application 2019 & 2032
Frequently Asked Questions
1. What is the projected Compound Annual Growth Rate (CAGR) of the Bottled Water Market?
The projected CAGR is approximately 6.79%.
2. Which companies are prominent players in the Bottled Water Market?
Key companies in the market include Suntory Holdings Ltd, Shenzhen Ganten Industry Co Ltd (Ganten), Yangshengtang Co Ltd (Nongfu Spring)*List Not Exhaustive, Nestle SA, Alma Group, PepsiCo Inc, Parle Agro Pvt Ltd, Danone SA, The Coca-Cola Company, BlueTriton Brands Inc.
3. What are the main segments of the Bottled Water Market?
The market segments include Type, Distribution Channel.
4. Can you provide details about the market size?
The market size is estimated to be USD 274 Million as of 2022.
5. What are some drivers contributing to market growth?
Consumer Preference Of Pure And Healthy Hydration; Advertisements And Promotional Campaigns Supporting Demand.
6. What are the notable trends driving market growth?
Consumer Preference Of Pure And Healthy Hydration.
7. Are there any restraints impacting market growth?
Presence Of Inferior Quality Products And Nanoplastics In Bottled Water.
8. Can you provide examples of recent developments in the market?
April 2024: Smartwater launched designed aluminum cans for its alkaline and sparkling waters. The cans are available in supermarket aisles in the United States.
9. What pricing options are available for accessing the report?
Pricing options include single-user, multi-user, and enterprise licenses priced at USD 4750, USD 5250, and USD 8750 respectively.
10. Is the market size provided in terms of value or volume?
The market size is provided in terms of value, measured in Million.
11. Are there any specific market keywords associated with the report?
Yes, the market keyword associated with the report is "Bottled Water Market," which aids in identifying and referencing the specific market segment covered.
12. How do I determine which pricing option suits my needs best?
The pricing options vary based on user requirements and access needs. Individual users may opt for single-user licenses, while businesses requiring broader access may choose multi-user or enterprise licenses for cost-effective access to the report.
13. Are there any additional resources or data provided in the Bottled Water Market report?
While the report offers comprehensive insights, it's advisable to review the specific contents or supplementary materials provided to ascertain if additional resources or data are available.
14. How can I stay updated on further developments or reports in the Bottled Water Market?
To stay informed about further developments, trends, and reports in the Bottled Water Market, consider subscribing to industry newsletters, following relevant companies and organizations, or regularly checking reputable industry news sources and publications.
Methodology
Step 1 - Identification of Relevant Samples Size from Population Database


Step 2 - Approaches for Defining Global Market Size (Value, Volume* & Price*)

Note*: In applicable scenarios
Step 3 - Data Sources
Primary Research
- Web Analytics
- Survey Reports
- Research Institute
- Latest Research Reports
- Opinion Leaders
Secondary Research
- Annual Reports
- White Paper
- Latest Press Release
- Industry Association
- Paid Database
- Investor Presentations

Step 4 - Data Triangulation
Involves using different sources of information in order to increase the validity of a study
These sources are likely to be stakeholders in a program - participants, other researchers, program staff, other community members, and so on.
Then we put all data in single framework & apply various statistical tools to find out the dynamic on the market.
During the analysis stage, feedback from the stakeholder groups would be compared to determine areas of agreement as well as areas of divergence


