
Key Insights
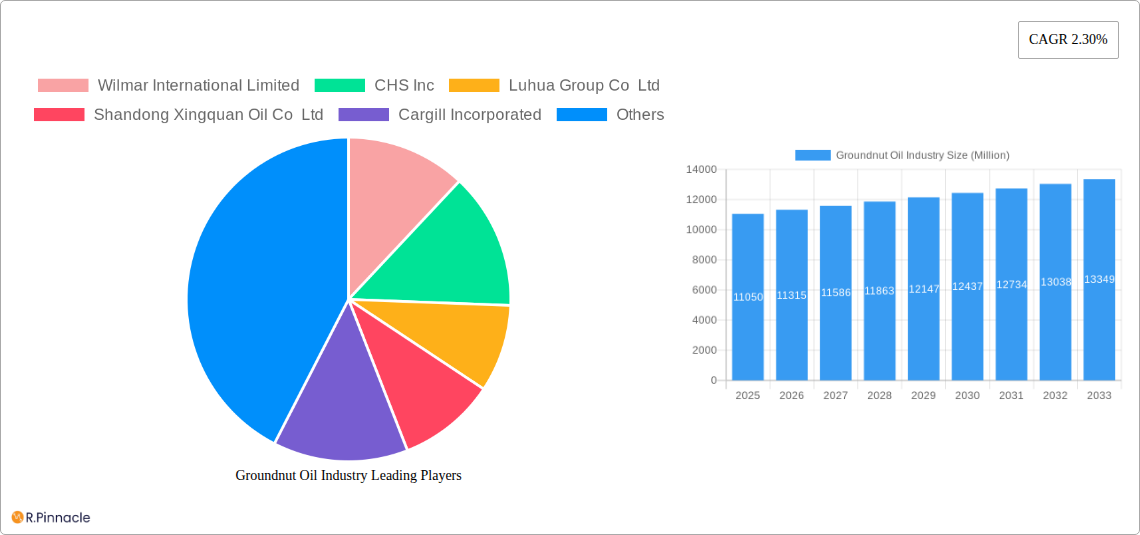
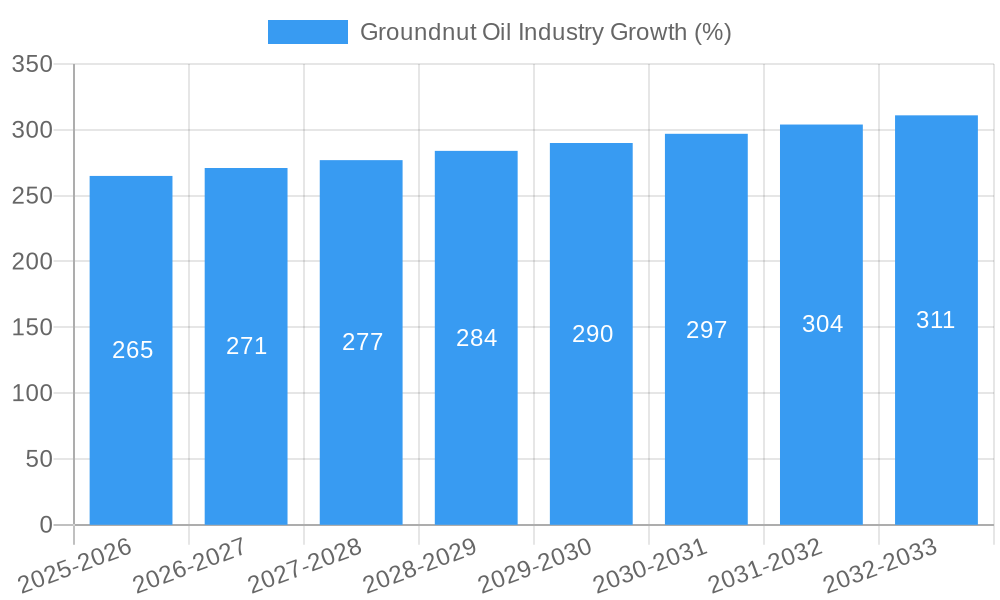
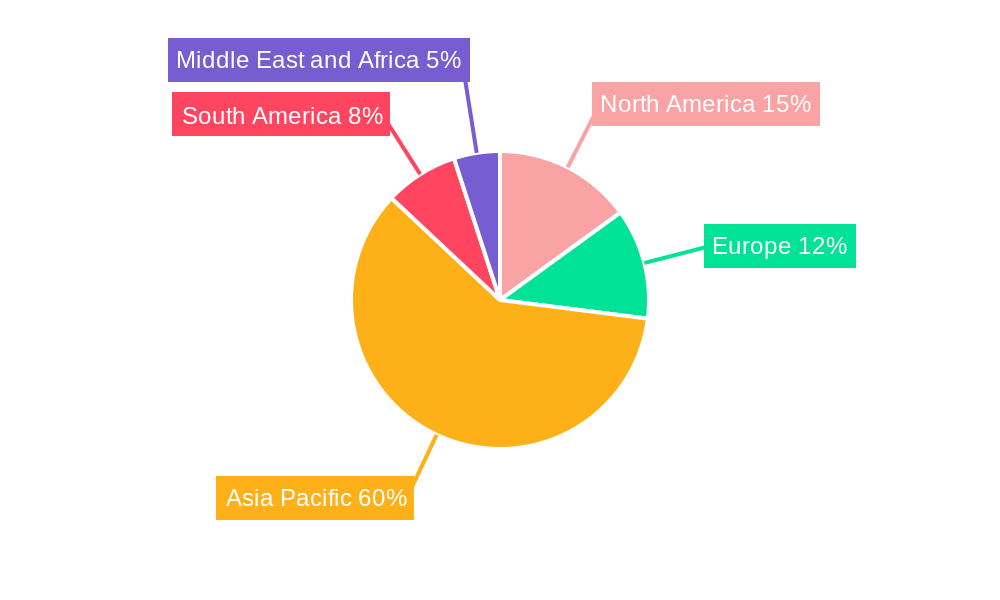
The global groundnut oil market, valued at $11.05 billion in 2025, is projected to experience steady growth, driven by increasing consumer demand for healthy cooking oils and its use in various applications. The Compound Annual Growth Rate (CAGR) of 2.30% from 2025 to 2033 indicates a consistent expansion, albeit moderate. Key drivers include the rising popularity of groundnut oil in personal care products due to its moisturizing properties, and its continued importance in the food industry, especially in Asian and African cuisines where it's a staple. The refined segment holds a significant market share, reflecting consumer preference for convenience and enhanced shelf life. While growth is expected across all application segments—personal care, food, pharmaceuticals, and others—the food segment is likely to remain dominant. However, challenges such as fluctuating groundnut prices and competition from other vegetable oils could restrain market expansion. Major players like Wilmar International, Cargill, and Bunge are leveraging their global presence and supply chain expertise to maintain market share, while regional players are focusing on localized production and distribution to cater to specific market needs. The Asia-Pacific region, particularly India and China, is projected to dominate the market due to high groundnut production and consumption. North America and Europe will experience moderate growth driven by increasing health-conscious consumers.
The forecast period (2025-2033) will likely see a gradual shift towards sustainable and ethically sourced groundnut oil, influencing consumer purchasing decisions. The industry will experience increased focus on traceability and transparency within the supply chain, addressing concerns regarding sustainability. Innovation in processing and packaging technologies will further enhance product quality and shelf life. Furthermore, opportunities for growth exist in exploring novel applications of groundnut oil in specialty food products and functional foods, capitalizing on its nutritional benefits. The market’s future hinges on effectively managing supply chain challenges, adapting to consumer preferences for sustainably produced products, and innovating to meet emerging market needs.
Groundnut Oil Industry Market Report: 2019-2033 Forecast
This comprehensive report provides a detailed analysis of the global groundnut oil industry, offering valuable insights for industry professionals, investors, and stakeholders. Covering the period 2019-2033, with a focus on 2025, this report unveils market trends, competitive dynamics, and future growth opportunities within the $XX Million groundnut oil market.
Groundnut Oil Industry Market Structure & Innovation Trends
This section analyzes the competitive landscape of the groundnut oil industry, focusing on market concentration, innovation drivers, and regulatory influences. The report examines the market share held by key players such as Wilmar International Limited, CHS Inc, Luhua Group Co Ltd, Shandong Xingquan Oil Co Ltd, Cargill Incorporated, Bunge Ltd, Archer Daniels Midland Company, Hain Celestial Group Inc, Olam International, Liberty Oil Mills Limited, and Lorenzati Group (list not exhaustive). We delve into the impact of mergers and acquisitions (M&A) activity, analyzing deal values and their effect on market consolidation. The study also explores the influence of regulatory frameworks on innovation and product development, including the impact of substitutes and evolving end-user demographics. Key metrics, such as market share percentages and M&A deal values in Millions, are included for a comprehensive understanding. For example, Wilmar International Limited might hold a xx% market share, while recent M&A activity totalled approximately $xx Million.
Groundnut Oil Industry Market Dynamics & Trends
This section details the key market dynamics influencing the groundnut oil industry's growth trajectory. The report explores factors driving market expansion, such as changing consumer preferences (e.g., increasing demand for healthy oils), technological advancements in oil processing and extraction, and evolving competitive strategies. The analysis includes a comprehensive examination of the Compound Annual Growth Rate (CAGR) during the historical period (2019-2024) and the forecast period (2025-2033), alongside market penetration rates for refined and unrefined groundnut oil across different geographical regions. We assess the impact of technological disruptions, such as advancements in oil extraction and refining techniques, on market dynamics and competitive landscapes. The report explores the strategic responses of key players to market changes, including product diversification and expansion into new markets. The estimated market size in 2025 is $XX Million.
Dominant Regions & Segments in Groundnut Oil Industry
This section identifies the leading regions and segments within the groundnut oil market. A detailed analysis assesses the dominance of specific geographic areas (e.g., Asia-Pacific, North America) and market segments (refined vs. unrefined groundnut oil; food, personal care, pharmaceutical, and other applications). Key drivers behind regional and segment dominance are explored using bullet points.
- Asia-Pacific: High population density, increasing disposable incomes, and a growing preference for healthy cooking oils.
- North America: Strong demand from food processing industries and personal care sectors.
- Refined Groundnut Oil: Higher consumer preference due to its purity and longer shelf life.
- Food Applications: Largest segment due to extensive use in cooking and food processing.
The report provides a detailed explanation for the dominance of each region and segment, incorporating economic policies, infrastructure development, and consumer behavior trends.
Groundnut Oil Industry Product Innovations
This section summarizes recent product developments and innovations in the groundnut oil industry. It highlights technological trends shaping product features, such as the use of sustainable processing methods and the development of fortified groundnut oils with added nutrients. The report explores how these innovations contribute to competitive advantages and satisfy evolving consumer demands. The focus is on how technological advancements are driving market fit and overall growth.
Report Scope & Segmentation Analysis
This section outlines the scope of the report and details the market segmentation, including:
- By Type: Refined and Unrefined groundnut oil, with projected growth rates and market sizes for each segment in Millions.
- By Application: Food, Personal Care, Pharmaceuticals, and Other Applications. Each segment's size, growth projections, and competitive dynamics are analyzed.
Key Drivers of Groundnut Oil Industry Growth
This section highlights the key factors driving growth in the groundnut oil industry. Technological advancements in extraction and refining, increasing health consciousness among consumers leading to higher demand for healthy cooking oils, and supportive government policies promoting domestic production are discussed.
Challenges in the Groundnut Oil Industry Sector
This section discusses the challenges facing the groundnut oil industry. These include fluctuating raw material prices, stringent regulatory requirements, supply chain disruptions, and intense competition from other vegetable oils. The quantitative impact of these challenges on market growth is also discussed.
Emerging Opportunities in Groundnut Oil Industry
This section explores emerging opportunities in the groundnut oil industry, such as the rising demand in new markets, advancements in sustainable agricultural practices, and the development of value-added groundnut oil products.
Leading Players in the Groundnut Oil Industry Market
- Wilmar International Limited
- CHS Inc
- Luhua Group Co Ltd
- Shandong Xingquan Oil Co Ltd
- Cargill Incorporated
- Bunge Ltd
- Archer Daniels Midland Company
- Hain Celestial Group Inc
- Olam International
- Liberty Oil Mills Limited
- Lorenzati Group
*List Not Exhaustive
Key Developments in Groundnut Oil Industry Industry
- 2023-Q2: Launch of a new, sustainably-sourced groundnut oil by Wilmar International.
- 2022-Q4: Acquisition of a smaller groundnut oil producer by Cargill Incorporated for $xx Million.
- 2021-Q3: Introduction of a new groundnut oil refining technology by ADM, increasing efficiency by xx%. (Note: Specific dates and details for other developments will be included in the full report.)
Future Outlook for Groundnut Oil Industry Market
The future outlook for the groundnut oil industry is positive, driven by continued growth in key markets and ongoing product innovations. The market is expected to expand steadily, with opportunities for both established players and new entrants. Strategic partnerships, sustainable sourcing initiatives, and focus on value-added products will play a significant role in shaping future market dynamics. The potential for growth is significant, with projections indicating a market size of $XX Million by 2033.
Groundnut Oil Industry Segmentation
-
1. Type
- 1.1. Refined
- 1.2. Unrefined
-
2. Application
- 2.1. Personal Care
- 2.2. Food
- 2.3. Pharmaceuticals
- 2.4. Other Applications
Groundnut Oil Industry Segmentation By Geography
-
1. North America
- 1.1. United States
- 1.2. Canada
- 1.3. Mexico
- 1.4. Rest of North America
-
2. Europe
- 2.1. Spain
- 2.2. United Kingdom
- 2.3. Germany
- 2.4. France
- 2.5. Italy
- 2.6. Russia
- 2.7. Rest of Europe
-
3. Asia Pacific
- 3.1. China
- 3.2. Japan
- 3.3. India
- 3.4. Australia
- 3.5. Rest of Asia Pacific
-
4. South America
- 4.1. Brazil
- 4.2. Argentina
- 4.3. Rest of South America
-
5. Middle East and Africa
- 5.1. South Africa
- 5.2. Saudi Arabia
- 5.3. Rest of Middle East and Africa
Groundnut Oil Industry REPORT HIGHLIGHTS
| Aspects | Details |
|---|---|
| Study Period | 2019-2033 |
| Base Year | 2024 |
| Estimated Year | 2025 |
| Forecast Period | 2025-2033 |
| Historical Period | 2019-2024 |
| Growth Rate | CAGR of 2.30% from 2019-2033 |
| Segmentation |
|
Table of Contents
- 1. Introduction
- 1.1. Research Scope
- 1.2. Market Segmentation
- 1.3. Research Methodology
- 1.4. Definitions and Assumptions
- 2. Executive Summary
- 2.1. Introduction
- 3. Market Dynamics
- 3.1. Introduction
- 3.2. Market Drivers
- 3.2.1. Inclination Towards Fitness and Increasing Intake of Plant-based Protein; Increase in Consumer Inclination Towards Meat Substitutes
- 3.3. Market Restrains
- 3.3.1. Gluten-Intolerance Among the Population Hindering the Market
- 3.4. Market Trends
- 3.4.1. Increasing Awareness of Peanut Oil Benefits in Skincare Products
- 4. Market Factor Analysis
- 4.1. Porters Five Forces
- 4.2. Supply/Value Chain
- 4.3. PESTEL analysis
- 4.4. Market Entropy
- 4.5. Patent/Trademark Analysis
- 5. Global Groundnut Oil Industry Analysis, Insights and Forecast, 2019-2031
- 5.1. Market Analysis, Insights and Forecast - by Type
- 5.1.1. Refined
- 5.1.2. Unrefined
- 5.2. Market Analysis, Insights and Forecast - by Application
- 5.2.1. Personal Care
- 5.2.2. Food
- 5.2.3. Pharmaceuticals
- 5.2.4. Other Applications
- 5.3. Market Analysis, Insights and Forecast - by Region
- 5.3.1. North America
- 5.3.2. Europe
- 5.3.3. Asia Pacific
- 5.3.4. South America
- 5.3.5. Middle East and Africa
- 5.1. Market Analysis, Insights and Forecast - by Type
- 6. North America Groundnut Oil Industry Analysis, Insights and Forecast, 2019-2031
- 6.1. Market Analysis, Insights and Forecast - by Type
- 6.1.1. Refined
- 6.1.2. Unrefined
- 6.2. Market Analysis, Insights and Forecast - by Application
- 6.2.1. Personal Care
- 6.2.2. Food
- 6.2.3. Pharmaceuticals
- 6.2.4. Other Applications
- 6.1. Market Analysis, Insights and Forecast - by Type
- 7. Europe Groundnut Oil Industry Analysis, Insights and Forecast, 2019-2031
- 7.1. Market Analysis, Insights and Forecast - by Type
- 7.1.1. Refined
- 7.1.2. Unrefined
- 7.2. Market Analysis, Insights and Forecast - by Application
- 7.2.1. Personal Care
- 7.2.2. Food
- 7.2.3. Pharmaceuticals
- 7.2.4. Other Applications
- 7.1. Market Analysis, Insights and Forecast - by Type
- 8. Asia Pacific Groundnut Oil Industry Analysis, Insights and Forecast, 2019-2031
- 8.1. Market Analysis, Insights and Forecast - by Type
- 8.1.1. Refined
- 8.1.2. Unrefined
- 8.2. Market Analysis, Insights and Forecast - by Application
- 8.2.1. Personal Care
- 8.2.2. Food
- 8.2.3. Pharmaceuticals
- 8.2.4. Other Applications
- 8.1. Market Analysis, Insights and Forecast - by Type
- 9. South America Groundnut Oil Industry Analysis, Insights and Forecast, 2019-2031
- 9.1. Market Analysis, Insights and Forecast - by Type
- 9.1.1. Refined
- 9.1.2. Unrefined
- 9.2. Market Analysis, Insights and Forecast - by Application
- 9.2.1. Personal Care
- 9.2.2. Food
- 9.2.3. Pharmaceuticals
- 9.2.4. Other Applications
- 9.1. Market Analysis, Insights and Forecast - by Type
- 10. Middle East and Africa Groundnut Oil Industry Analysis, Insights and Forecast, 2019-2031
- 10.1. Market Analysis, Insights and Forecast - by Type
- 10.1.1. Refined
- 10.1.2. Unrefined
- 10.2. Market Analysis, Insights and Forecast - by Application
- 10.2.1. Personal Care
- 10.2.2. Food
- 10.2.3. Pharmaceuticals
- 10.2.4. Other Applications
- 10.1. Market Analysis, Insights and Forecast - by Type
- 11. North America Groundnut Oil Industry Analysis, Insights and Forecast, 2019-2031
- 11.1. Market Analysis, Insights and Forecast - By Country/Sub-region
- 11.1.1 United States
- 11.1.2 Canada
- 11.1.3 Mexico
- 11.1.4 Rest of North America
- 12. Europe Groundnut Oil Industry Analysis, Insights and Forecast, 2019-2031
- 12.1. Market Analysis, Insights and Forecast - By Country/Sub-region
- 12.1.1 Spain
- 12.1.2 United Kingdom
- 12.1.3 Germany
- 12.1.4 France
- 12.1.5 Italy
- 12.1.6 Russia
- 12.1.7 Rest of Europe
- 13. Asia Pacific Groundnut Oil Industry Analysis, Insights and Forecast, 2019-2031
- 13.1. Market Analysis, Insights and Forecast - By Country/Sub-region
- 13.1.1 China
- 13.1.2 Japan
- 13.1.3 India
- 13.1.4 Australia
- 13.1.5 Rest of Asia Pacific
- 14. South America Groundnut Oil Industry Analysis, Insights and Forecast, 2019-2031
- 14.1. Market Analysis, Insights and Forecast - By Country/Sub-region
- 14.1.1 Brazil
- 14.1.2 Argentina
- 14.1.3 Rest of South America
- 15. Middle East and Africa Groundnut Oil Industry Analysis, Insights and Forecast, 2019-2031
- 15.1. Market Analysis, Insights and Forecast - By Country/Sub-region
- 15.1.1 South Africa
- 15.1.2 Saudi Arabia
- 15.1.3 Rest of Middle East and Africa
- 16. Competitive Analysis
- 16.1. Global Market Share Analysis 2024
- 16.2. Company Profiles
- 16.2.1 Wilmar International Limited
- 16.2.1.1. Overview
- 16.2.1.2. Products
- 16.2.1.3. SWOT Analysis
- 16.2.1.4. Recent Developments
- 16.2.1.5. Financials (Based on Availability)
- 16.2.2 CHS Inc
- 16.2.2.1. Overview
- 16.2.2.2. Products
- 16.2.2.3. SWOT Analysis
- 16.2.2.4. Recent Developments
- 16.2.2.5. Financials (Based on Availability)
- 16.2.3 Luhua Group Co Ltd
- 16.2.3.1. Overview
- 16.2.3.2. Products
- 16.2.3.3. SWOT Analysis
- 16.2.3.4. Recent Developments
- 16.2.3.5. Financials (Based on Availability)
- 16.2.4 Shandong Xingquan Oil Co Ltd
- 16.2.4.1. Overview
- 16.2.4.2. Products
- 16.2.4.3. SWOT Analysis
- 16.2.4.4. Recent Developments
- 16.2.4.5. Financials (Based on Availability)
- 16.2.5 Cargill Incorporated
- 16.2.5.1. Overview
- 16.2.5.2. Products
- 16.2.5.3. SWOT Analysis
- 16.2.5.4. Recent Developments
- 16.2.5.5. Financials (Based on Availability)
- 16.2.6 Bunge Ltd
- 16.2.6.1. Overview
- 16.2.6.2. Products
- 16.2.6.3. SWOT Analysis
- 16.2.6.4. Recent Developments
- 16.2.6.5. Financials (Based on Availability)
- 16.2.7 Archer Daniels Midland Company
- 16.2.7.1. Overview
- 16.2.7.2. Products
- 16.2.7.3. SWOT Analysis
- 16.2.7.4. Recent Developments
- 16.2.7.5. Financials (Based on Availability)
- 16.2.8 Hain Celestial Group Inc
- 16.2.8.1. Overview
- 16.2.8.2. Products
- 16.2.8.3. SWOT Analysis
- 16.2.8.4. Recent Developments
- 16.2.8.5. Financials (Based on Availability)
- 16.2.9 Olam International
- 16.2.9.1. Overview
- 16.2.9.2. Products
- 16.2.9.3. SWOT Analysis
- 16.2.9.4. Recent Developments
- 16.2.9.5. Financials (Based on Availability)
- 16.2.10 Liberty Oil Mills Limited
- 16.2.10.1. Overview
- 16.2.10.2. Products
- 16.2.10.3. SWOT Analysis
- 16.2.10.4. Recent Developments
- 16.2.10.5. Financials (Based on Availability)
- 16.2.11 Lorenzati Group*List Not Exhaustive
- 16.2.11.1. Overview
- 16.2.11.2. Products
- 16.2.11.3. SWOT Analysis
- 16.2.11.4. Recent Developments
- 16.2.11.5. Financials (Based on Availability)
- 16.2.1 Wilmar International Limited
List of Figures
- Figure 1: Global Groundnut Oil Industry Revenue Breakdown (Million, %) by Region 2024 & 2032
- Figure 2: Global Groundnut Oil Industry Volume Breakdown (K Tons, %) by Region 2024 & 2032
- Figure 3: North America Groundnut Oil Industry Revenue (Million), by Country 2024 & 2032
- Figure 4: North America Groundnut Oil Industry Volume (K Tons), by Country 2024 & 2032
- Figure 5: North America Groundnut Oil Industry Revenue Share (%), by Country 2024 & 2032
- Figure 6: North America Groundnut Oil Industry Volume Share (%), by Country 2024 & 2032
- Figure 7: Europe Groundnut Oil Industry Revenue (Million), by Country 2024 & 2032
- Figure 8: Europe Groundnut Oil Industry Volume (K Tons), by Country 2024 & 2032
- Figure 9: Europe Groundnut Oil Industry Revenue Share (%), by Country 2024 & 2032
- Figure 10: Europe Groundnut Oil Industry Volume Share (%), by Country 2024 & 2032
- Figure 11: Asia Pacific Groundnut Oil Industry Revenue (Million), by Country 2024 & 2032
- Figure 12: Asia Pacific Groundnut Oil Industry Volume (K Tons), by Country 2024 & 2032
- Figure 13: Asia Pacific Groundnut Oil Industry Revenue Share (%), by Country 2024 & 2032
- Figure 14: Asia Pacific Groundnut Oil Industry Volume Share (%), by Country 2024 & 2032
- Figure 15: South America Groundnut Oil Industry Revenue (Million), by Country 2024 & 2032
- Figure 16: South America Groundnut Oil Industry Volume (K Tons), by Country 2024 & 2032
- Figure 17: South America Groundnut Oil Industry Revenue Share (%), by Country 2024 & 2032
- Figure 18: South America Groundnut Oil Industry Volume Share (%), by Country 2024 & 2032
- Figure 19: Middle East and Africa Groundnut Oil Industry Revenue (Million), by Country 2024 & 2032
- Figure 20: Middle East and Africa Groundnut Oil Industry Volume (K Tons), by Country 2024 & 2032
- Figure 21: Middle East and Africa Groundnut Oil Industry Revenue Share (%), by Country 2024 & 2032
- Figure 22: Middle East and Africa Groundnut Oil Industry Volume Share (%), by Country 2024 & 2032
- Figure 23: North America Groundnut Oil Industry Revenue (Million), by Type 2024 & 2032
- Figure 24: North America Groundnut Oil Industry Volume (K Tons), by Type 2024 & 2032
- Figure 25: North America Groundnut Oil Industry Revenue Share (%), by Type 2024 & 2032
- Figure 26: North America Groundnut Oil Industry Volume Share (%), by Type 2024 & 2032
- Figure 27: North America Groundnut Oil Industry Revenue (Million), by Application 2024 & 2032
- Figure 28: North America Groundnut Oil Industry Volume (K Tons), by Application 2024 & 2032
- Figure 29: North America Groundnut Oil Industry Revenue Share (%), by Application 2024 & 2032
- Figure 30: North America Groundnut Oil Industry Volume Share (%), by Application 2024 & 2032
- Figure 31: North America Groundnut Oil Industry Revenue (Million), by Country 2024 & 2032
- Figure 32: North America Groundnut Oil Industry Volume (K Tons), by Country 2024 & 2032
- Figure 33: North America Groundnut Oil Industry Revenue Share (%), by Country 2024 & 2032
- Figure 34: North America Groundnut Oil Industry Volume Share (%), by Country 2024 & 2032
- Figure 35: Europe Groundnut Oil Industry Revenue (Million), by Type 2024 & 2032
- Figure 36: Europe Groundnut Oil Industry Volume (K Tons), by Type 2024 & 2032
- Figure 37: Europe Groundnut Oil Industry Revenue Share (%), by Type 2024 & 2032
- Figure 38: Europe Groundnut Oil Industry Volume Share (%), by Type 2024 & 2032
- Figure 39: Europe Groundnut Oil Industry Revenue (Million), by Application 2024 & 2032
- Figure 40: Europe Groundnut Oil Industry Volume (K Tons), by Application 2024 & 2032
- Figure 41: Europe Groundnut Oil Industry Revenue Share (%), by Application 2024 & 2032
- Figure 42: Europe Groundnut Oil Industry Volume Share (%), by Application 2024 & 2032
- Figure 43: Europe Groundnut Oil Industry Revenue (Million), by Country 2024 & 2032
- Figure 44: Europe Groundnut Oil Industry Volume (K Tons), by Country 2024 & 2032
- Figure 45: Europe Groundnut Oil Industry Revenue Share (%), by Country 2024 & 2032
- Figure 46: Europe Groundnut Oil Industry Volume Share (%), by Country 2024 & 2032
- Figure 47: Asia Pacific Groundnut Oil Industry Revenue (Million), by Type 2024 & 2032
- Figure 48: Asia Pacific Groundnut Oil Industry Volume (K Tons), by Type 2024 & 2032
- Figure 49: Asia Pacific Groundnut Oil Industry Revenue Share (%), by Type 2024 & 2032
- Figure 50: Asia Pacific Groundnut Oil Industry Volume Share (%), by Type 2024 & 2032
- Figure 51: Asia Pacific Groundnut Oil Industry Revenue (Million), by Application 2024 & 2032
- Figure 52: Asia Pacific Groundnut Oil Industry Volume (K Tons), by Application 2024 & 2032
- Figure 53: Asia Pacific Groundnut Oil Industry Revenue Share (%), by Application 2024 & 2032
- Figure 54: Asia Pacific Groundnut Oil Industry Volume Share (%), by Application 2024 & 2032
- Figure 55: Asia Pacific Groundnut Oil Industry Revenue (Million), by Country 2024 & 2032
- Figure 56: Asia Pacific Groundnut Oil Industry Volume (K Tons), by Country 2024 & 2032
- Figure 57: Asia Pacific Groundnut Oil Industry Revenue Share (%), by Country 2024 & 2032
- Figure 58: Asia Pacific Groundnut Oil Industry Volume Share (%), by Country 2024 & 2032
- Figure 59: South America Groundnut Oil Industry Revenue (Million), by Type 2024 & 2032
- Figure 60: South America Groundnut Oil Industry Volume (K Tons), by Type 2024 & 2032
- Figure 61: South America Groundnut Oil Industry Revenue Share (%), by Type 2024 & 2032
- Figure 62: South America Groundnut Oil Industry Volume Share (%), by Type 2024 & 2032
- Figure 63: South America Groundnut Oil Industry Revenue (Million), by Application 2024 & 2032
- Figure 64: South America Groundnut Oil Industry Volume (K Tons), by Application 2024 & 2032
- Figure 65: South America Groundnut Oil Industry Revenue Share (%), by Application 2024 & 2032
- Figure 66: South America Groundnut Oil Industry Volume Share (%), by Application 2024 & 2032
- Figure 67: South America Groundnut Oil Industry Revenue (Million), by Country 2024 & 2032
- Figure 68: South America Groundnut Oil Industry Volume (K Tons), by Country 2024 & 2032
- Figure 69: South America Groundnut Oil Industry Revenue Share (%), by Country 2024 & 2032
- Figure 70: South America Groundnut Oil Industry Volume Share (%), by Country 2024 & 2032
- Figure 71: Middle East and Africa Groundnut Oil Industry Revenue (Million), by Type 2024 & 2032
- Figure 72: Middle East and Africa Groundnut Oil Industry Volume (K Tons), by Type 2024 & 2032
- Figure 73: Middle East and Africa Groundnut Oil Industry Revenue Share (%), by Type 2024 & 2032
- Figure 74: Middle East and Africa Groundnut Oil Industry Volume Share (%), by Type 2024 & 2032
- Figure 75: Middle East and Africa Groundnut Oil Industry Revenue (Million), by Application 2024 & 2032
- Figure 76: Middle East and Africa Groundnut Oil Industry Volume (K Tons), by Application 2024 & 2032
- Figure 77: Middle East and Africa Groundnut Oil Industry Revenue Share (%), by Application 2024 & 2032
- Figure 78: Middle East and Africa Groundnut Oil Industry Volume Share (%), by Application 2024 & 2032
- Figure 79: Middle East and Africa Groundnut Oil Industry Revenue (Million), by Country 2024 & 2032
- Figure 80: Middle East and Africa Groundnut Oil Industry Volume (K Tons), by Country 2024 & 2032
- Figure 81: Middle East and Africa Groundnut Oil Industry Revenue Share (%), by Country 2024 & 2032
- Figure 82: Middle East and Africa Groundnut Oil Industry Volume Share (%), by Country 2024 & 2032
List of Tables
- Table 1: Global Groundnut Oil Industry Revenue Million Forecast, by Region 2019 & 2032
- Table 2: Global Groundnut Oil Industry Volume K Tons Forecast, by Region 2019 & 2032
- Table 3: Global Groundnut Oil Industry Revenue Million Forecast, by Type 2019 & 2032
- Table 4: Global Groundnut Oil Industry Volume K Tons Forecast, by Type 2019 & 2032
- Table 5: Global Groundnut Oil Industry Revenue Million Forecast, by Application 2019 & 2032
- Table 6: Global Groundnut Oil Industry Volume K Tons Forecast, by Application 2019 & 2032
- Table 7: Global Groundnut Oil Industry Revenue Million Forecast, by Region 2019 & 2032
- Table 8: Global Groundnut Oil Industry Volume K Tons Forecast, by Region 2019 & 2032
- Table 9: Global Groundnut Oil Industry Revenue Million Forecast, by Country 2019 & 2032
- Table 10: Global Groundnut Oil Industry Volume K Tons Forecast, by Country 2019 & 2032
- Table 11: United States Groundnut Oil Industry Revenue (Million) Forecast, by Application 2019 & 2032
- Table 12: United States Groundnut Oil Industry Volume (K Tons) Forecast, by Application 2019 & 2032
- Table 13: Canada Groundnut Oil Industry Revenue (Million) Forecast, by Application 2019 & 2032
- Table 14: Canada Groundnut Oil Industry Volume (K Tons) Forecast, by Application 2019 & 2032
- Table 15: Mexico Groundnut Oil Industry Revenue (Million) Forecast, by Application 2019 & 2032
- Table 16: Mexico Groundnut Oil Industry Volume (K Tons) Forecast, by Application 2019 & 2032
- Table 17: Rest of North America Groundnut Oil Industry Revenue (Million) Forecast, by Application 2019 & 2032
- Table 18: Rest of North America Groundnut Oil Industry Volume (K Tons) Forecast, by Application 2019 & 2032
- Table 19: Global Groundnut Oil Industry Revenue Million Forecast, by Country 2019 & 2032
- Table 20: Global Groundnut Oil Industry Volume K Tons Forecast, by Country 2019 & 2032
- Table 21: Spain Groundnut Oil Industry Revenue (Million) Forecast, by Application 2019 & 2032
- Table 22: Spain Groundnut Oil Industry Volume (K Tons) Forecast, by Application 2019 & 2032
- Table 23: United Kingdom Groundnut Oil Industry Revenue (Million) Forecast, by Application 2019 & 2032
- Table 24: United Kingdom Groundnut Oil Industry Volume (K Tons) Forecast, by Application 2019 & 2032
- Table 25: Germany Groundnut Oil Industry Revenue (Million) Forecast, by Application 2019 & 2032
- Table 26: Germany Groundnut Oil Industry Volume (K Tons) Forecast, by Application 2019 & 2032
- Table 27: France Groundnut Oil Industry Revenue (Million) Forecast, by Application 2019 & 2032
- Table 28: France Groundnut Oil Industry Volume (K Tons) Forecast, by Application 2019 & 2032
- Table 29: Italy Groundnut Oil Industry Revenue (Million) Forecast, by Application 2019 & 2032
- Table 30: Italy Groundnut Oil Industry Volume (K Tons) Forecast, by Application 2019 & 2032
- Table 31: Russia Groundnut Oil Industry Revenue (Million) Forecast, by Application 2019 & 2032
- Table 32: Russia Groundnut Oil Industry Volume (K Tons) Forecast, by Application 2019 & 2032
- Table 33: Rest of Europe Groundnut Oil Industry Revenue (Million) Forecast, by Application 2019 & 2032
- Table 34: Rest of Europe Groundnut Oil Industry Volume (K Tons) Forecast, by Application 2019 & 2032
- Table 35: Global Groundnut Oil Industry Revenue Million Forecast, by Country 2019 & 2032
- Table 36: Global Groundnut Oil Industry Volume K Tons Forecast, by Country 2019 & 2032
- Table 37: China Groundnut Oil Industry Revenue (Million) Forecast, by Application 2019 & 2032
- Table 38: China Groundnut Oil Industry Volume (K Tons) Forecast, by Application 2019 & 2032
- Table 39: Japan Groundnut Oil Industry Revenue (Million) Forecast, by Application 2019 & 2032
- Table 40: Japan Groundnut Oil Industry Volume (K Tons) Forecast, by Application 2019 & 2032
- Table 41: India Groundnut Oil Industry Revenue (Million) Forecast, by Application 2019 & 2032
- Table 42: India Groundnut Oil Industry Volume (K Tons) Forecast, by Application 2019 & 2032
- Table 43: Australia Groundnut Oil Industry Revenue (Million) Forecast, by Application 2019 & 2032
- Table 44: Australia Groundnut Oil Industry Volume (K Tons) Forecast, by Application 2019 & 2032
- Table 45: Rest of Asia Pacific Groundnut Oil Industry Revenue (Million) Forecast, by Application 2019 & 2032
- Table 46: Rest of Asia Pacific Groundnut Oil Industry Volume (K Tons) Forecast, by Application 2019 & 2032
- Table 47: Global Groundnut Oil Industry Revenue Million Forecast, by Country 2019 & 2032
- Table 48: Global Groundnut Oil Industry Volume K Tons Forecast, by Country 2019 & 2032
- Table 49: Brazil Groundnut Oil Industry Revenue (Million) Forecast, by Application 2019 & 2032
- Table 50: Brazil Groundnut Oil Industry Volume (K Tons) Forecast, by Application 2019 & 2032
- Table 51: Argentina Groundnut Oil Industry Revenue (Million) Forecast, by Application 2019 & 2032
- Table 52: Argentina Groundnut Oil Industry Volume (K Tons) Forecast, by Application 2019 & 2032
- Table 53: Rest of South America Groundnut Oil Industry Revenue (Million) Forecast, by Application 2019 & 2032
- Table 54: Rest of South America Groundnut Oil Industry Volume (K Tons) Forecast, by Application 2019 & 2032
- Table 55: Global Groundnut Oil Industry Revenue Million Forecast, by Country 2019 & 2032
- Table 56: Global Groundnut Oil Industry Volume K Tons Forecast, by Country 2019 & 2032
- Table 57: South Africa Groundnut Oil Industry Revenue (Million) Forecast, by Application 2019 & 2032
- Table 58: South Africa Groundnut Oil Industry Volume (K Tons) Forecast, by Application 2019 & 2032
- Table 59: Saudi Arabia Groundnut Oil Industry Revenue (Million) Forecast, by Application 2019 & 2032
- Table 60: Saudi Arabia Groundnut Oil Industry Volume (K Tons) Forecast, by Application 2019 & 2032
- Table 61: Rest of Middle East and Africa Groundnut Oil Industry Revenue (Million) Forecast, by Application 2019 & 2032
- Table 62: Rest of Middle East and Africa Groundnut Oil Industry Volume (K Tons) Forecast, by Application 2019 & 2032
- Table 63: Global Groundnut Oil Industry Revenue Million Forecast, by Type 2019 & 2032
- Table 64: Global Groundnut Oil Industry Volume K Tons Forecast, by Type 2019 & 2032
- Table 65: Global Groundnut Oil Industry Revenue Million Forecast, by Application 2019 & 2032
- Table 66: Global Groundnut Oil Industry Volume K Tons Forecast, by Application 2019 & 2032
- Table 67: Global Groundnut Oil Industry Revenue Million Forecast, by Country 2019 & 2032
- Table 68: Global Groundnut Oil Industry Volume K Tons Forecast, by Country 2019 & 2032
- Table 69: United States Groundnut Oil Industry Revenue (Million) Forecast, by Application 2019 & 2032
- Table 70: United States Groundnut Oil Industry Volume (K Tons) Forecast, by Application 2019 & 2032
- Table 71: Canada Groundnut Oil Industry Revenue (Million) Forecast, by Application 2019 & 2032
- Table 72: Canada Groundnut Oil Industry Volume (K Tons) Forecast, by Application 2019 & 2032
- Table 73: Mexico Groundnut Oil Industry Revenue (Million) Forecast, by Application 2019 & 2032
- Table 74: Mexico Groundnut Oil Industry Volume (K Tons) Forecast, by Application 2019 & 2032
- Table 75: Rest of North America Groundnut Oil Industry Revenue (Million) Forecast, by Application 2019 & 2032
- Table 76: Rest of North America Groundnut Oil Industry Volume (K Tons) Forecast, by Application 2019 & 2032
- Table 77: Global Groundnut Oil Industry Revenue Million Forecast, by Type 2019 & 2032
- Table 78: Global Groundnut Oil Industry Volume K Tons Forecast, by Type 2019 & 2032
- Table 79: Global Groundnut Oil Industry Revenue Million Forecast, by Application 2019 & 2032
- Table 80: Global Groundnut Oil Industry Volume K Tons Forecast, by Application 2019 & 2032
- Table 81: Global Groundnut Oil Industry Revenue Million Forecast, by Country 2019 & 2032
- Table 82: Global Groundnut Oil Industry Volume K Tons Forecast, by Country 2019 & 2032
- Table 83: Spain Groundnut Oil Industry Revenue (Million) Forecast, by Application 2019 & 2032
- Table 84: Spain Groundnut Oil Industry Volume (K Tons) Forecast, by Application 2019 & 2032
- Table 85: United Kingdom Groundnut Oil Industry Revenue (Million) Forecast, by Application 2019 & 2032
- Table 86: United Kingdom Groundnut Oil Industry Volume (K Tons) Forecast, by Application 2019 & 2032
- Table 87: Germany Groundnut Oil Industry Revenue (Million) Forecast, by Application 2019 & 2032
- Table 88: Germany Groundnut Oil Industry Volume (K Tons) Forecast, by Application 2019 & 2032
- Table 89: France Groundnut Oil Industry Revenue (Million) Forecast, by Application 2019 & 2032
- Table 90: France Groundnut Oil Industry Volume (K Tons) Forecast, by Application 2019 & 2032
- Table 91: Italy Groundnut Oil Industry Revenue (Million) Forecast, by Application 2019 & 2032
- Table 92: Italy Groundnut Oil Industry Volume (K Tons) Forecast, by Application 2019 & 2032
- Table 93: Russia Groundnut Oil Industry Revenue (Million) Forecast, by Application 2019 & 2032
- Table 94: Russia Groundnut Oil Industry Volume (K Tons) Forecast, by Application 2019 & 2032
- Table 95: Rest of Europe Groundnut Oil Industry Revenue (Million) Forecast, by Application 2019 & 2032
- Table 96: Rest of Europe Groundnut Oil Industry Volume (K Tons) Forecast, by Application 2019 & 2032
- Table 97: Global Groundnut Oil Industry Revenue Million Forecast, by Type 2019 & 2032
- Table 98: Global Groundnut Oil Industry Volume K Tons Forecast, by Type 2019 & 2032
- Table 99: Global Groundnut Oil Industry Revenue Million Forecast, by Application 2019 & 2032
- Table 100: Global Groundnut Oil Industry Volume K Tons Forecast, by Application 2019 & 2032
- Table 101: Global Groundnut Oil Industry Revenue Million Forecast, by Country 2019 & 2032
- Table 102: Global Groundnut Oil Industry Volume K Tons Forecast, by Country 2019 & 2032
- Table 103: China Groundnut Oil Industry Revenue (Million) Forecast, by Application 2019 & 2032
- Table 104: China Groundnut Oil Industry Volume (K Tons) Forecast, by Application 2019 & 2032
- Table 105: Japan Groundnut Oil Industry Revenue (Million) Forecast, by Application 2019 & 2032
- Table 106: Japan Groundnut Oil Industry Volume (K Tons) Forecast, by Application 2019 & 2032
- Table 107: India Groundnut Oil Industry Revenue (Million) Forecast, by Application 2019 & 2032
- Table 108: India Groundnut Oil Industry Volume (K Tons) Forecast, by Application 2019 & 2032
- Table 109: Australia Groundnut Oil Industry Revenue (Million) Forecast, by Application 2019 & 2032
- Table 110: Australia Groundnut Oil Industry Volume (K Tons) Forecast, by Application 2019 & 2032
- Table 111: Rest of Asia Pacific Groundnut Oil Industry Revenue (Million) Forecast, by Application 2019 & 2032
- Table 112: Rest of Asia Pacific Groundnut Oil Industry Volume (K Tons) Forecast, by Application 2019 & 2032
- Table 113: Global Groundnut Oil Industry Revenue Million Forecast, by Type 2019 & 2032
- Table 114: Global Groundnut Oil Industry Volume K Tons Forecast, by Type 2019 & 2032
- Table 115: Global Groundnut Oil Industry Revenue Million Forecast, by Application 2019 & 2032
- Table 116: Global Groundnut Oil Industry Volume K Tons Forecast, by Application 2019 & 2032
- Table 117: Global Groundnut Oil Industry Revenue Million Forecast, by Country 2019 & 2032
- Table 118: Global Groundnut Oil Industry Volume K Tons Forecast, by Country 2019 & 2032
- Table 119: Brazil Groundnut Oil Industry Revenue (Million) Forecast, by Application 2019 & 2032
- Table 120: Brazil Groundnut Oil Industry Volume (K Tons) Forecast, by Application 2019 & 2032
- Table 121: Argentina Groundnut Oil Industry Revenue (Million) Forecast, by Application 2019 & 2032
- Table 122: Argentina Groundnut Oil Industry Volume (K Tons) Forecast, by Application 2019 & 2032
- Table 123: Rest of South America Groundnut Oil Industry Revenue (Million) Forecast, by Application 2019 & 2032
- Table 124: Rest of South America Groundnut Oil Industry Volume (K Tons) Forecast, by Application 2019 & 2032
- Table 125: Global Groundnut Oil Industry Revenue Million Forecast, by Type 2019 & 2032
- Table 126: Global Groundnut Oil Industry Volume K Tons Forecast, by Type 2019 & 2032
- Table 127: Global Groundnut Oil Industry Revenue Million Forecast, by Application 2019 & 2032
- Table 128: Global Groundnut Oil Industry Volume K Tons Forecast, by Application 2019 & 2032
- Table 129: Global Groundnut Oil Industry Revenue Million Forecast, by Country 2019 & 2032
- Table 130: Global Groundnut Oil Industry Volume K Tons Forecast, by Country 2019 & 2032
- Table 131: South Africa Groundnut Oil Industry Revenue (Million) Forecast, by Application 2019 & 2032
- Table 132: South Africa Groundnut Oil Industry Volume (K Tons) Forecast, by Application 2019 & 2032
- Table 133: Saudi Arabia Groundnut Oil Industry Revenue (Million) Forecast, by Application 2019 & 2032
- Table 134: Saudi Arabia Groundnut Oil Industry Volume (K Tons) Forecast, by Application 2019 & 2032
- Table 135: Rest of Middle East and Africa Groundnut Oil Industry Revenue (Million) Forecast, by Application 2019 & 2032
- Table 136: Rest of Middle East and Africa Groundnut Oil Industry Volume (K Tons) Forecast, by Application 2019 & 2032
Frequently Asked Questions
1. What is the projected Compound Annual Growth Rate (CAGR) of the Groundnut Oil Industry?
The projected CAGR is approximately 2.30%.
2. Which companies are prominent players in the Groundnut Oil Industry?
Key companies in the market include Wilmar International Limited, CHS Inc, Luhua Group Co Ltd, Shandong Xingquan Oil Co Ltd, Cargill Incorporated, Bunge Ltd, Archer Daniels Midland Company, Hain Celestial Group Inc, Olam International, Liberty Oil Mills Limited, Lorenzati Group*List Not Exhaustive.
3. What are the main segments of the Groundnut Oil Industry?
The market segments include Type, Application.
4. Can you provide details about the market size?
The market size is estimated to be USD 11.05 Million as of 2022.
5. What are some drivers contributing to market growth?
Inclination Towards Fitness and Increasing Intake of Plant-based Protein; Increase in Consumer Inclination Towards Meat Substitutes.
6. What are the notable trends driving market growth?
Increasing Awareness of Peanut Oil Benefits in Skincare Products.
7. Are there any restraints impacting market growth?
Gluten-Intolerance Among the Population Hindering the Market.
8. Can you provide examples of recent developments in the market?
N/A
9. What pricing options are available for accessing the report?
Pricing options include single-user, multi-user, and enterprise licenses priced at USD 4750, USD 5250, and USD 8750 respectively.
10. Is the market size provided in terms of value or volume?
The market size is provided in terms of value, measured in Million and volume, measured in K Tons.
11. Are there any specific market keywords associated with the report?
Yes, the market keyword associated with the report is "Groundnut Oil Industry," which aids in identifying and referencing the specific market segment covered.
12. How do I determine which pricing option suits my needs best?
The pricing options vary based on user requirements and access needs. Individual users may opt for single-user licenses, while businesses requiring broader access may choose multi-user or enterprise licenses for cost-effective access to the report.
13. Are there any additional resources or data provided in the Groundnut Oil Industry report?
While the report offers comprehensive insights, it's advisable to review the specific contents or supplementary materials provided to ascertain if additional resources or data are available.
14. How can I stay updated on further developments or reports in the Groundnut Oil Industry?
To stay informed about further developments, trends, and reports in the Groundnut Oil Industry, consider subscribing to industry newsletters, following relevant companies and organizations, or regularly checking reputable industry news sources and publications.
Methodology
Step 1 - Identification of Relevant Samples Size from Population Database


Step 2 - Approaches for Defining Global Market Size (Value, Volume* & Price*)

Note*: In applicable scenarios
Step 3 - Data Sources
Primary Research
- Web Analytics
- Survey Reports
- Research Institute
- Latest Research Reports
- Opinion Leaders
Secondary Research
- Annual Reports
- White Paper
- Latest Press Release
- Industry Association
- Paid Database
- Investor Presentations

Step 4 - Data Triangulation
Involves using different sources of information in order to increase the validity of a study
These sources are likely to be stakeholders in a program - participants, other researchers, program staff, other community members, and so on.
Then we put all data in single framework & apply various statistical tools to find out the dynamic on the market.
During the analysis stage, feedback from the stakeholder groups would be compared to determine areas of agreement as well as areas of divergence


