
Key Insights
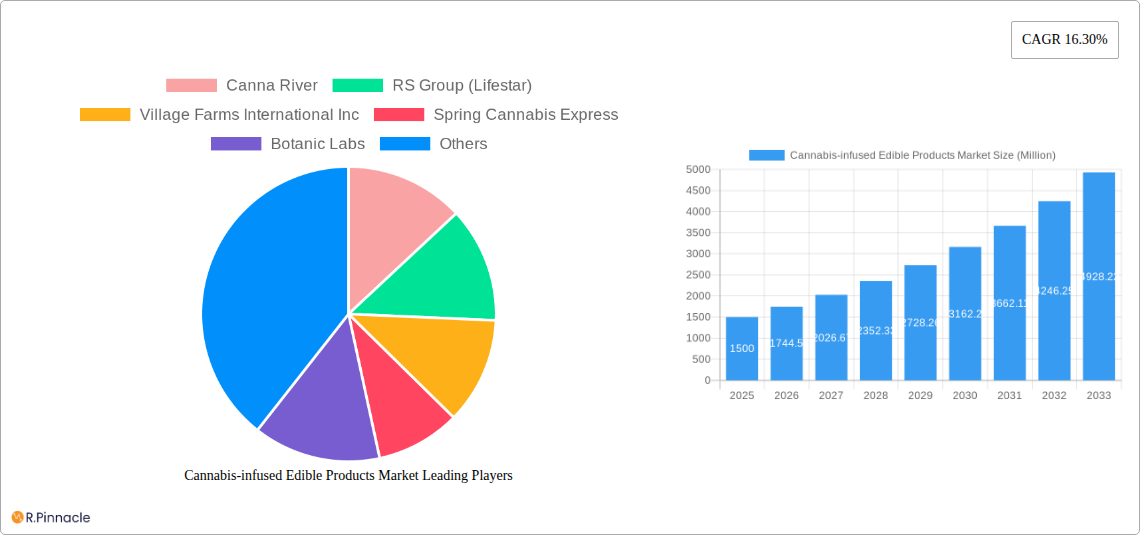
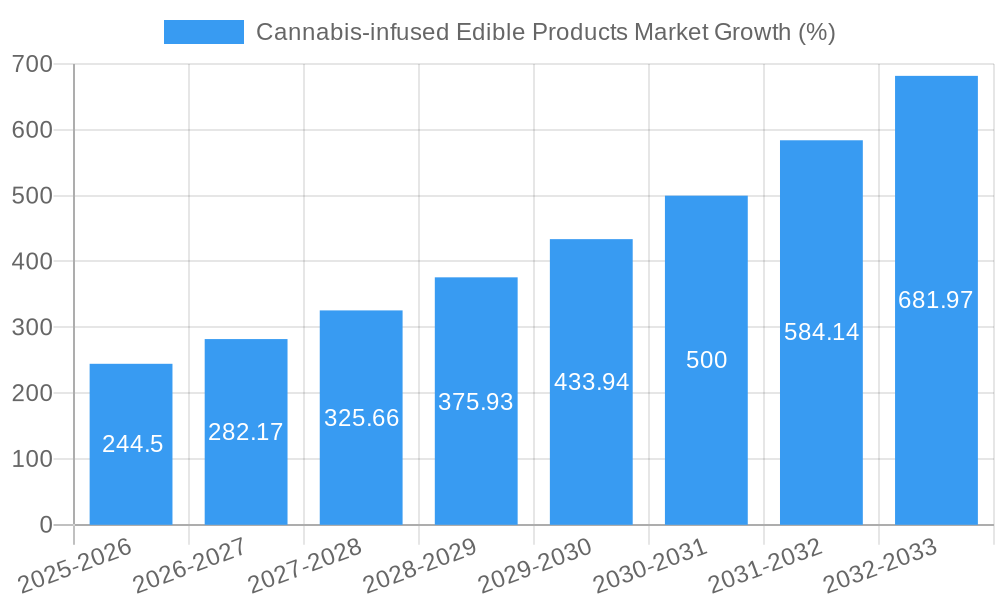
The Cannabis-infused Edible Products Market is experiencing robust growth, driven by increasing consumer acceptance of cannabis for recreational and medicinal purposes, coupled with the expanding legalization landscape globally. The market's Compound Annual Growth Rate (CAGR) of 16.30% from 2019 to 2024 indicates significant potential. This growth is fueled by the diversification of product offerings, including chocolates, gummies, baked goods, and beverages, catering to a wider range of consumer preferences. The convenience and discreet nature of edibles contribute significantly to their popularity, especially among consumers seeking alternative methods of cannabis consumption. Supermarkets and hypermarkets represent a key distribution channel, but online retail stores are rapidly gaining traction, driven by increased e-commerce penetration and consumer preference for convenient home delivery. While regulatory hurdles and varying legalization statuses across different regions pose some challenges, the overall market outlook remains positive, with continued expansion anticipated throughout the forecast period (2025-2033).
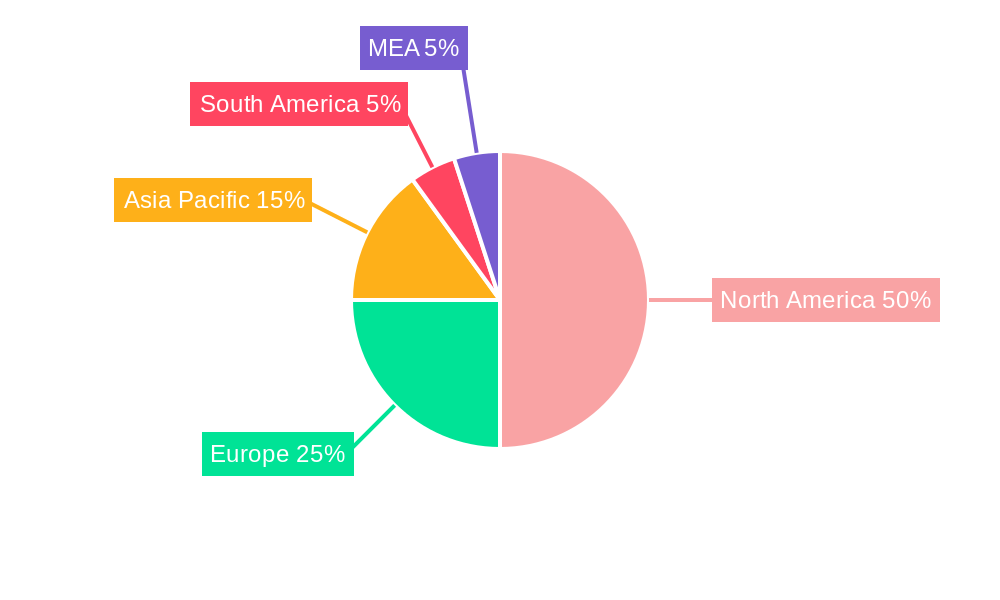
Significant regional variations exist within the market. North America, particularly the United States and Canada, currently holds the largest market share due to early legalization and robust consumer demand. However, Europe and the Asia-Pacific region are exhibiting significant growth potential, driven by changing regulations and increasing consumer awareness. The market segmentation by product type (food and beverages) highlights the versatility and expanding nature of the industry, with continuous innovation in flavors, formulations, and dosage forms. Key players in the market are focused on product innovation, brand building, and strategic partnerships to expand their market reach and capture a larger share of the growing demand. Competition is likely to intensify as more companies enter the market, leading to price competition and a greater focus on product differentiation. Future growth will depend heavily on further legislative advancements, evolving consumer preferences, and the development of innovative products that cater to specific consumer needs and preferences.
Cannabis-infused Edible Products Market: A Comprehensive Report (2019-2033)
This comprehensive report provides an in-depth analysis of the Cannabis-infused Edible Products Market, offering valuable insights for industry professionals, investors, and stakeholders. Covering the period from 2019 to 2033, with a focus on 2025, this report unveils market dynamics, growth drivers, challenges, and future opportunities. The study encompasses various segments, including different product types, distribution channels, and geographical regions, providing a holistic view of this rapidly evolving market. The market is projected to reach xx Million by 2033.
Cannabis-infused Edible Products Market Market Structure & Innovation Trends
This section analyzes the competitive landscape, innovative product development, regulatory influences, and market consolidation within the cannabis-infused edible products market. The market exhibits a moderately fragmented structure, with several key players vying for market share. Key players include Canna River, RS Group (Lifestar), Village Farms International Inc, Spring Cannabis Express, Botanic Labs, CBDfx, Neurogen, Cannabinoid Creations, BellRock Brands Inc (Dixie Elixirs), Naturecan Ltd, Hempfusion Wellness Inc, and Grön Confections (GrönCBD) LLC. This list is not exhaustive.
- Market Concentration: The market share of the top 5 players is estimated at xx% in 2025, indicating a moderately competitive landscape. Further analysis reveals a dynamic shift in market share due to new product launches and acquisitions.
- Innovation Drivers: Consumer demand for diverse product formats, improved taste profiles, and precise dosage control drives innovation. Technological advancements in extraction methods and formulation techniques further contribute.
- Regulatory Frameworks: Varying regulations across different jurisdictions significantly impact market growth and entry barriers. Stricter regulations in certain regions limit market expansion, while more lenient policies foster growth.
- Product Substitutes: Traditional confectionery and snack foods pose a competitive threat, although the unique appeal of cannabis-infused products retains a strong market presence.
- End-User Demographics: The primary consumer base consists of adults aged 25-45, with growing interest amongst older demographics. Marketing strategies are evolving to cater to diverse consumer segments.
- M&A Activities: The market has witnessed significant merger and acquisition activity in recent years, with deal values exceeding xx Million in 2024. These activities consolidate market share and accelerate innovation.
Cannabis-infused Edible Products Market Market Dynamics & Trends
The cannabis-infused edible products market is characterized by robust growth driven by several key factors. Increasing legalization and acceptance of cannabis for recreational and medicinal use globally is a major catalyst. The evolving consumer preference towards healthier alternatives and the rising demand for convenient and discreet consumption methods significantly contribute to the market's expansion.
The market witnessed a CAGR of xx% during the historical period (2019-2024) and is projected to maintain a healthy CAGR of xx% during the forecast period (2025-2033). Market penetration in key regions remains relatively low, presenting considerable growth potential. Technological advancements, such as advancements in extraction, formulation and packaging, are continually enhancing product quality, safety, and appeal. Intense competition fuels innovation and necessitates continuous product diversification to capture growing consumer segments. Changing consumer preferences towards premium quality products and tailored experiences shape product development and marketing strategies.
Dominant Regions & Segments in Cannabis-infused Edible Products Market
The North American market, particularly the United States and Canada, currently dominates the global cannabis-infused edible products market. This dominance is attributed to the early legalization of cannabis in several states and provinces, fostering a robust regulatory framework and encouraging market expansion. Europe is emerging as a key region, with increasing legalization driving significant growth prospects.
Leading Regions:
- North America: High consumer acceptance, established regulatory frameworks, and robust distribution networks fuel market expansion.
- Europe: Increasing legalization efforts and growing consumer awareness are driving market growth.
- Other Regions: Emerging markets in South America, Australia and Asia Pacific also show growth potential but face regulatory hurdles.
Dominant Segments:
- Product Type: Beverages and other food products are presently the leading segments, fueled by consumers' growing interest in convenient and palatable consumption formats.
- Distribution Channel: Supermarkets/Hypermarkets and specialist stores are significant distribution channels due to increased accessibility and brand visibility. Online retail stores are witnessing significant growth.
Key Drivers:
- Economic Policies: Legalization policies and supportive regulatory frameworks are crucial for market growth.
- Infrastructure: Efficient distribution networks and sophisticated supply chains are pivotal for market expansion.
- Consumer Preferences: Rising demand for convenient, discreet, and palatable consumption methods drives growth.
Cannabis-infused Edible Products Market Product Innovations
The market is witnessing continuous innovation in product formats, flavors, and delivery methods. New product development focuses on improving taste and minimizing off-flavors often associated with cannabis-infused edibles. Manufacturers are increasingly leveraging nanotechnology for enhanced bioavailability and quicker onset of effects. Innovative packaging solutions aim to enhance product shelf-life and maintain freshness. These developments reflect the industry's commitment to enhancing the consumer experience and catering to specific preferences.
Report Scope & Segmentation Analysis
This report segments the cannabis-infused edible products market based on product type (Food, Other Food: Beverages, Other Beverages: Dietary Supplements), distribution channels (Supermarkets/Hypermarkets, Convenience stores, Specialist stores, Online Retail Stores, Other Distribution Channels), and geography. Each segment's growth projections, market size, and competitive dynamics are extensively analyzed. The report projects substantial growth in all segments, particularly beverages and online retail channels. Competitive intensity varies across segments, with some exhibiting higher concentration than others.
Key Drivers of Cannabis-infused Edible Products Market Growth
The market's growth is propelled by several key drivers. The increasing legalization of cannabis for both recreational and medicinal use is a major catalyst. Rising consumer awareness about the potential health benefits of cannabis and its derivatives fuels demand. Technological advancements in extraction, formulation, and packaging enhance product quality and appeal, fostering market expansion.
Challenges in the Cannabis-infused Edible Products Market Sector
The cannabis-infused edible products market faces several challenges. Varying and evolving regulatory frameworks across different jurisdictions create complexities in market entry and expansion. Supply chain management remains a significant hurdle, given the specialized nature of cannabis cultivation and processing. Intense competition, particularly from established food and beverage companies, creates pressure on pricing and profitability. Consumer concerns about dosage accuracy and potential adverse effects need careful attention.
Emerging Opportunities in Cannabis-infused Edible Products Market
Significant opportunities exist for innovation and expansion. Emerging markets in regions with recently legalized cannabis offer vast potential. The development of new product formats and delivery methods, such as incorporating CBD and other cannabinoids, will drive future growth. Growing interest in personalized wellness solutions and functional foods presents opportunities for targeted product development.
Leading Players in the Cannabis-infused Edible Products Market Market
- Canna River
- RS Group (Lifestar)
- Village Farms International Inc
- Spring Cannabis Express
- Botanic Labs
- CBDfx
- Neurogen
- Cannabinoid Creations
- BellRock Brands Inc (Dixie Elixirs)
- Naturecan Ltd
- Hempfusion Wellness Inc
- Grön Confections (GrönCBD) LLC
Key Developments in Cannabis-infused Edible Products Market Industry
- January 2023: Canna River launched a new line of infused gummies.
- March 2024: RS Group acquired a smaller competitor, expanding its market reach.
- June 2024: A major regulatory change in California impacted product labeling. (Further developments will be detailed in the full report)
Future Outlook for Cannabis-infused Edible Products Market Market
The cannabis-infused edible products market is poised for continued robust growth, driven by increasing legalization, evolving consumer preferences, and technological advancements. Strategic partnerships, product diversification, and expansion into emerging markets will be crucial for success. The market presents significant opportunities for innovation and expansion, with considerable potential for growth in both established and emerging regions.
Cannabis-infused Edible Products Market Segmentation
-
1. Product Type
-
1.1. Food
- 1.1.1. Chocolates
- 1.1.2. Gummies
- 1.1.3. Mints & Tarts
- 1.1.4. Brownies & Cookies
- 1.1.5. Other Food
-
1.2. Beverages
- 1.2.1. Energy Drinks
- 1.2.2. Fruit Juices
- 1.2.3. Herbal Tea
- 1.2.4. Other Beverages
- 1.3. Dietary Supplements
-
1.1. Food
-
2. Distribution Channel
- 2.1. Supermarkets/Hypermarkets
- 2.2. Convenience stores
- 2.3. Specialist stores
- 2.4. Online Retail Stores
- 2.5. Other Distribution Channels
Cannabis-infused Edible Products Market Segmentation By Geography
-
1. North America
- 1.1. United States
- 1.2. Canada
- 1.3. Mexico
- 1.4. Rest of North America
-
2. Europe
- 2.1. Spain
- 2.2. United Kingdom
- 2.3. Germany
- 2.4. France
- 2.5. Italy
- 2.6. Rest of Europe
-
3. Asia Pacific
- 3.1. Japan
- 3.2. Australia
- 3.3. Rest of Asia Pacific
-
4. Rest of the World
- 4.1. Africa
- 4.2. South America
Cannabis-infused Edible Products Market REPORT HIGHLIGHTS
| Aspects | Details |
|---|---|
| Study Period | 2019-2033 |
| Base Year | 2024 |
| Estimated Year | 2025 |
| Forecast Period | 2025-2033 |
| Historical Period | 2019-2024 |
| Growth Rate | CAGR of 16.30% from 2019-2033 |
| Segmentation |
|
Table of Contents
- 1. Introduction
- 1.1. Research Scope
- 1.2. Market Segmentation
- 1.3. Research Methodology
- 1.4. Definitions and Assumptions
- 2. Executive Summary
- 2.1. Introduction
- 3. Market Dynamics
- 3.1. Introduction
- 3.2. Market Drivers
- 3.2.1. Growing Demand for Convenience and Processed Foods Drives Demand; Expanding Cosmetic and Personal Care Industries Utilize Gelatin for Various Purposes
- 3.3. Market Restrains
- 3.3.1. Fluctuations in Raw Material Proces Affecting Production Costs
- 3.4. Market Trends
- 3.4.1. More Patents and Collaborations with Micro-dosing
- 4. Market Factor Analysis
- 4.1. Porters Five Forces
- 4.2. Supply/Value Chain
- 4.3. PESTEL analysis
- 4.4. Market Entropy
- 4.5. Patent/Trademark Analysis
- 5. Global Cannabis-infused Edible Products Market Analysis, Insights and Forecast, 2019-2031
- 5.1. Market Analysis, Insights and Forecast - by Product Type
- 5.1.1. Food
- 5.1.1.1. Chocolates
- 5.1.1.2. Gummies
- 5.1.1.3. Mints & Tarts
- 5.1.1.4. Brownies & Cookies
- 5.1.1.5. Other Food
- 5.1.2. Beverages
- 5.1.2.1. Energy Drinks
- 5.1.2.2. Fruit Juices
- 5.1.2.3. Herbal Tea
- 5.1.2.4. Other Beverages
- 5.1.3. Dietary Supplements
- 5.1.1. Food
- 5.2. Market Analysis, Insights and Forecast - by Distribution Channel
- 5.2.1. Supermarkets/Hypermarkets
- 5.2.2. Convenience stores
- 5.2.3. Specialist stores
- 5.2.4. Online Retail Stores
- 5.2.5. Other Distribution Channels
- 5.3. Market Analysis, Insights and Forecast - by Region
- 5.3.1. North America
- 5.3.2. Europe
- 5.3.3. Asia Pacific
- 5.3.4. Rest of the World
- 5.1. Market Analysis, Insights and Forecast - by Product Type
- 6. North America Cannabis-infused Edible Products Market Analysis, Insights and Forecast, 2019-2031
- 6.1. Market Analysis, Insights and Forecast - by Product Type
- 6.1.1. Food
- 6.1.1.1. Chocolates
- 6.1.1.2. Gummies
- 6.1.1.3. Mints & Tarts
- 6.1.1.4. Brownies & Cookies
- 6.1.1.5. Other Food
- 6.1.2. Beverages
- 6.1.2.1. Energy Drinks
- 6.1.2.2. Fruit Juices
- 6.1.2.3. Herbal Tea
- 6.1.2.4. Other Beverages
- 6.1.3. Dietary Supplements
- 6.1.1. Food
- 6.2. Market Analysis, Insights and Forecast - by Distribution Channel
- 6.2.1. Supermarkets/Hypermarkets
- 6.2.2. Convenience stores
- 6.2.3. Specialist stores
- 6.2.4. Online Retail Stores
- 6.2.5. Other Distribution Channels
- 6.1. Market Analysis, Insights and Forecast - by Product Type
- 7. Europe Cannabis-infused Edible Products Market Analysis, Insights and Forecast, 2019-2031
- 7.1. Market Analysis, Insights and Forecast - by Product Type
- 7.1.1. Food
- 7.1.1.1. Chocolates
- 7.1.1.2. Gummies
- 7.1.1.3. Mints & Tarts
- 7.1.1.4. Brownies & Cookies
- 7.1.1.5. Other Food
- 7.1.2. Beverages
- 7.1.2.1. Energy Drinks
- 7.1.2.2. Fruit Juices
- 7.1.2.3. Herbal Tea
- 7.1.2.4. Other Beverages
- 7.1.3. Dietary Supplements
- 7.1.1. Food
- 7.2. Market Analysis, Insights and Forecast - by Distribution Channel
- 7.2.1. Supermarkets/Hypermarkets
- 7.2.2. Convenience stores
- 7.2.3. Specialist stores
- 7.2.4. Online Retail Stores
- 7.2.5. Other Distribution Channels
- 7.1. Market Analysis, Insights and Forecast - by Product Type
- 8. Asia Pacific Cannabis-infused Edible Products Market Analysis, Insights and Forecast, 2019-2031
- 8.1. Market Analysis, Insights and Forecast - by Product Type
- 8.1.1. Food
- 8.1.1.1. Chocolates
- 8.1.1.2. Gummies
- 8.1.1.3. Mints & Tarts
- 8.1.1.4. Brownies & Cookies
- 8.1.1.5. Other Food
- 8.1.2. Beverages
- 8.1.2.1. Energy Drinks
- 8.1.2.2. Fruit Juices
- 8.1.2.3. Herbal Tea
- 8.1.2.4. Other Beverages
- 8.1.3. Dietary Supplements
- 8.1.1. Food
- 8.2. Market Analysis, Insights and Forecast - by Distribution Channel
- 8.2.1. Supermarkets/Hypermarkets
- 8.2.2. Convenience stores
- 8.2.3. Specialist stores
- 8.2.4. Online Retail Stores
- 8.2.5. Other Distribution Channels
- 8.1. Market Analysis, Insights and Forecast - by Product Type
- 9. Rest of the World Cannabis-infused Edible Products Market Analysis, Insights and Forecast, 2019-2031
- 9.1. Market Analysis, Insights and Forecast - by Product Type
- 9.1.1. Food
- 9.1.1.1. Chocolates
- 9.1.1.2. Gummies
- 9.1.1.3. Mints & Tarts
- 9.1.1.4. Brownies & Cookies
- 9.1.1.5. Other Food
- 9.1.2. Beverages
- 9.1.2.1. Energy Drinks
- 9.1.2.2. Fruit Juices
- 9.1.2.3. Herbal Tea
- 9.1.2.4. Other Beverages
- 9.1.3. Dietary Supplements
- 9.1.1. Food
- 9.2. Market Analysis, Insights and Forecast - by Distribution Channel
- 9.2.1. Supermarkets/Hypermarkets
- 9.2.2. Convenience stores
- 9.2.3. Specialist stores
- 9.2.4. Online Retail Stores
- 9.2.5. Other Distribution Channels
- 9.1. Market Analysis, Insights and Forecast - by Product Type
- 10. North America Cannabis-infused Edible Products Market Analysis, Insights and Forecast, 2019-2031
- 10.1. Market Analysis, Insights and Forecast - By Country/Sub-region
- 10.1.1 United States
- 10.1.2 Canada
- 10.1.3 Mexico
- 11. Europe Cannabis-infused Edible Products Market Analysis, Insights and Forecast, 2019-2031
- 11.1. Market Analysis, Insights and Forecast - By Country/Sub-region
- 11.1.1 Germany
- 11.1.2 United Kingdom
- 11.1.3 France
- 11.1.4 Spain
- 11.1.5 Italy
- 11.1.6 Spain
- 11.1.7 Belgium
- 11.1.8 Netherland
- 11.1.9 Nordics
- 11.1.10 Rest of Europe
- 12. Asia Pacific Cannabis-infused Edible Products Market Analysis, Insights and Forecast, 2019-2031
- 12.1. Market Analysis, Insights and Forecast - By Country/Sub-region
- 12.1.1 China
- 12.1.2 Japan
- 12.1.3 India
- 12.1.4 South Korea
- 12.1.5 Southeast Asia
- 12.1.6 Australia
- 12.1.7 Indonesia
- 12.1.8 Phillipes
- 12.1.9 Singapore
- 12.1.10 Thailandc
- 12.1.11 Rest of Asia Pacific
- 13. South America Cannabis-infused Edible Products Market Analysis, Insights and Forecast, 2019-2031
- 13.1. Market Analysis, Insights and Forecast - By Country/Sub-region
- 13.1.1 Brazil
- 13.1.2 Argentina
- 13.1.3 Peru
- 13.1.4 Chile
- 13.1.5 Colombia
- 13.1.6 Ecuador
- 13.1.7 Venezuela
- 13.1.8 Rest of South America
- 14. North America Cannabis-infused Edible Products Market Analysis, Insights and Forecast, 2019-2031
- 14.1. Market Analysis, Insights and Forecast - By Country/Sub-region
- 14.1.1 United States
- 14.1.2 Canada
- 14.1.3 Mexico
- 15. MEA Cannabis-infused Edible Products Market Analysis, Insights and Forecast, 2019-2031
- 15.1. Market Analysis, Insights and Forecast - By Country/Sub-region
- 15.1.1 United Arab Emirates
- 15.1.2 Saudi Arabia
- 15.1.3 South Africa
- 15.1.4 Rest of Middle East and Africa
- 16. Competitive Analysis
- 16.1. Global Market Share Analysis 2024
- 16.2. Company Profiles
- 16.2.1 Canna River
- 16.2.1.1. Overview
- 16.2.1.2. Products
- 16.2.1.3. SWOT Analysis
- 16.2.1.4. Recent Developments
- 16.2.1.5. Financials (Based on Availability)
- 16.2.2 RS Group (Lifestar)
- 16.2.2.1. Overview
- 16.2.2.2. Products
- 16.2.2.3. SWOT Analysis
- 16.2.2.4. Recent Developments
- 16.2.2.5. Financials (Based on Availability)
- 16.2.3 Village Farms International Inc
- 16.2.3.1. Overview
- 16.2.3.2. Products
- 16.2.3.3. SWOT Analysis
- 16.2.3.4. Recent Developments
- 16.2.3.5. Financials (Based on Availability)
- 16.2.4 Spring Cannabis Express
- 16.2.4.1. Overview
- 16.2.4.2. Products
- 16.2.4.3. SWOT Analysis
- 16.2.4.4. Recent Developments
- 16.2.4.5. Financials (Based on Availability)
- 16.2.5 Botanic Labs
- 16.2.5.1. Overview
- 16.2.5.2. Products
- 16.2.5.3. SWOT Analysis
- 16.2.5.4. Recent Developments
- 16.2.5.5. Financials (Based on Availability)
- 16.2.6 CBDfx
- 16.2.6.1. Overview
- 16.2.6.2. Products
- 16.2.6.3. SWOT Analysis
- 16.2.6.4. Recent Developments
- 16.2.6.5. Financials (Based on Availability)
- 16.2.7 Neurogen
- 16.2.7.1. Overview
- 16.2.7.2. Products
- 16.2.7.3. SWOT Analysis
- 16.2.7.4. Recent Developments
- 16.2.7.5. Financials (Based on Availability)
- 16.2.8 Cannabinoid Creations
- 16.2.8.1. Overview
- 16.2.8.2. Products
- 16.2.8.3. SWOT Analysis
- 16.2.8.4. Recent Developments
- 16.2.8.5. Financials (Based on Availability)
- 16.2.9 BellRock Brands Inc (Dixie Elixirs)
- 16.2.9.1. Overview
- 16.2.9.2. Products
- 16.2.9.3. SWOT Analysis
- 16.2.9.4. Recent Developments
- 16.2.9.5. Financials (Based on Availability)
- 16.2.10 Naturecan Ltd
- 16.2.10.1. Overview
- 16.2.10.2. Products
- 16.2.10.3. SWOT Analysis
- 16.2.10.4. Recent Developments
- 16.2.10.5. Financials (Based on Availability)
- 16.2.11 Hempfusion Wellness Inc
- 16.2.11.1. Overview
- 16.2.11.2. Products
- 16.2.11.3. SWOT Analysis
- 16.2.11.4. Recent Developments
- 16.2.11.5. Financials (Based on Availability)
- 16.2.12 Grön Confections (GrönCBD) LLC*List Not Exhaustive
- 16.2.12.1. Overview
- 16.2.12.2. Products
- 16.2.12.3. SWOT Analysis
- 16.2.12.4. Recent Developments
- 16.2.12.5. Financials (Based on Availability)
- 16.2.1 Canna River
List of Figures
- Figure 1: Global Cannabis-infused Edible Products Market Revenue Breakdown (Million, %) by Region 2024 & 2032
- Figure 2: North America Cannabis-infused Edible Products Market Revenue (Million), by Country 2024 & 2032
- Figure 3: North America Cannabis-infused Edible Products Market Revenue Share (%), by Country 2024 & 2032
- Figure 4: Europe Cannabis-infused Edible Products Market Revenue (Million), by Country 2024 & 2032
- Figure 5: Europe Cannabis-infused Edible Products Market Revenue Share (%), by Country 2024 & 2032
- Figure 6: Asia Pacific Cannabis-infused Edible Products Market Revenue (Million), by Country 2024 & 2032
- Figure 7: Asia Pacific Cannabis-infused Edible Products Market Revenue Share (%), by Country 2024 & 2032
- Figure 8: South America Cannabis-infused Edible Products Market Revenue (Million), by Country 2024 & 2032
- Figure 9: South America Cannabis-infused Edible Products Market Revenue Share (%), by Country 2024 & 2032
- Figure 10: North America Cannabis-infused Edible Products Market Revenue (Million), by Country 2024 & 2032
- Figure 11: North America Cannabis-infused Edible Products Market Revenue Share (%), by Country 2024 & 2032
- Figure 12: MEA Cannabis-infused Edible Products Market Revenue (Million), by Country 2024 & 2032
- Figure 13: MEA Cannabis-infused Edible Products Market Revenue Share (%), by Country 2024 & 2032
- Figure 14: North America Cannabis-infused Edible Products Market Revenue (Million), by Product Type 2024 & 2032
- Figure 15: North America Cannabis-infused Edible Products Market Revenue Share (%), by Product Type 2024 & 2032
- Figure 16: North America Cannabis-infused Edible Products Market Revenue (Million), by Distribution Channel 2024 & 2032
- Figure 17: North America Cannabis-infused Edible Products Market Revenue Share (%), by Distribution Channel 2024 & 2032
- Figure 18: North America Cannabis-infused Edible Products Market Revenue (Million), by Country 2024 & 2032
- Figure 19: North America Cannabis-infused Edible Products Market Revenue Share (%), by Country 2024 & 2032
- Figure 20: Europe Cannabis-infused Edible Products Market Revenue (Million), by Product Type 2024 & 2032
- Figure 21: Europe Cannabis-infused Edible Products Market Revenue Share (%), by Product Type 2024 & 2032
- Figure 22: Europe Cannabis-infused Edible Products Market Revenue (Million), by Distribution Channel 2024 & 2032
- Figure 23: Europe Cannabis-infused Edible Products Market Revenue Share (%), by Distribution Channel 2024 & 2032
- Figure 24: Europe Cannabis-infused Edible Products Market Revenue (Million), by Country 2024 & 2032
- Figure 25: Europe Cannabis-infused Edible Products Market Revenue Share (%), by Country 2024 & 2032
- Figure 26: Asia Pacific Cannabis-infused Edible Products Market Revenue (Million), by Product Type 2024 & 2032
- Figure 27: Asia Pacific Cannabis-infused Edible Products Market Revenue Share (%), by Product Type 2024 & 2032
- Figure 28: Asia Pacific Cannabis-infused Edible Products Market Revenue (Million), by Distribution Channel 2024 & 2032
- Figure 29: Asia Pacific Cannabis-infused Edible Products Market Revenue Share (%), by Distribution Channel 2024 & 2032
- Figure 30: Asia Pacific Cannabis-infused Edible Products Market Revenue (Million), by Country 2024 & 2032
- Figure 31: Asia Pacific Cannabis-infused Edible Products Market Revenue Share (%), by Country 2024 & 2032
- Figure 32: Rest of the World Cannabis-infused Edible Products Market Revenue (Million), by Product Type 2024 & 2032
- Figure 33: Rest of the World Cannabis-infused Edible Products Market Revenue Share (%), by Product Type 2024 & 2032
- Figure 34: Rest of the World Cannabis-infused Edible Products Market Revenue (Million), by Distribution Channel 2024 & 2032
- Figure 35: Rest of the World Cannabis-infused Edible Products Market Revenue Share (%), by Distribution Channel 2024 & 2032
- Figure 36: Rest of the World Cannabis-infused Edible Products Market Revenue (Million), by Country 2024 & 2032
- Figure 37: Rest of the World Cannabis-infused Edible Products Market Revenue Share (%), by Country 2024 & 2032
List of Tables
- Table 1: Global Cannabis-infused Edible Products Market Revenue Million Forecast, by Region 2019 & 2032
- Table 2: Global Cannabis-infused Edible Products Market Revenue Million Forecast, by Product Type 2019 & 2032
- Table 3: Global Cannabis-infused Edible Products Market Revenue Million Forecast, by Distribution Channel 2019 & 2032
- Table 4: Global Cannabis-infused Edible Products Market Revenue Million Forecast, by Region 2019 & 2032
- Table 5: Global Cannabis-infused Edible Products Market Revenue Million Forecast, by Country 2019 & 2032
- Table 6: United States Cannabis-infused Edible Products Market Revenue (Million) Forecast, by Application 2019 & 2032
- Table 7: Canada Cannabis-infused Edible Products Market Revenue (Million) Forecast, by Application 2019 & 2032
- Table 8: Mexico Cannabis-infused Edible Products Market Revenue (Million) Forecast, by Application 2019 & 2032
- Table 9: Global Cannabis-infused Edible Products Market Revenue Million Forecast, by Country 2019 & 2032
- Table 10: Germany Cannabis-infused Edible Products Market Revenue (Million) Forecast, by Application 2019 & 2032
- Table 11: United Kingdom Cannabis-infused Edible Products Market Revenue (Million) Forecast, by Application 2019 & 2032
- Table 12: France Cannabis-infused Edible Products Market Revenue (Million) Forecast, by Application 2019 & 2032
- Table 13: Spain Cannabis-infused Edible Products Market Revenue (Million) Forecast, by Application 2019 & 2032
- Table 14: Italy Cannabis-infused Edible Products Market Revenue (Million) Forecast, by Application 2019 & 2032
- Table 15: Spain Cannabis-infused Edible Products Market Revenue (Million) Forecast, by Application 2019 & 2032
- Table 16: Belgium Cannabis-infused Edible Products Market Revenue (Million) Forecast, by Application 2019 & 2032
- Table 17: Netherland Cannabis-infused Edible Products Market Revenue (Million) Forecast, by Application 2019 & 2032
- Table 18: Nordics Cannabis-infused Edible Products Market Revenue (Million) Forecast, by Application 2019 & 2032
- Table 19: Rest of Europe Cannabis-infused Edible Products Market Revenue (Million) Forecast, by Application 2019 & 2032
- Table 20: Global Cannabis-infused Edible Products Market Revenue Million Forecast, by Country 2019 & 2032
- Table 21: China Cannabis-infused Edible Products Market Revenue (Million) Forecast, by Application 2019 & 2032
- Table 22: Japan Cannabis-infused Edible Products Market Revenue (Million) Forecast, by Application 2019 & 2032
- Table 23: India Cannabis-infused Edible Products Market Revenue (Million) Forecast, by Application 2019 & 2032
- Table 24: South Korea Cannabis-infused Edible Products Market Revenue (Million) Forecast, by Application 2019 & 2032
- Table 25: Southeast Asia Cannabis-infused Edible Products Market Revenue (Million) Forecast, by Application 2019 & 2032
- Table 26: Australia Cannabis-infused Edible Products Market Revenue (Million) Forecast, by Application 2019 & 2032
- Table 27: Indonesia Cannabis-infused Edible Products Market Revenue (Million) Forecast, by Application 2019 & 2032
- Table 28: Phillipes Cannabis-infused Edible Products Market Revenue (Million) Forecast, by Application 2019 & 2032
- Table 29: Singapore Cannabis-infused Edible Products Market Revenue (Million) Forecast, by Application 2019 & 2032
- Table 30: Thailandc Cannabis-infused Edible Products Market Revenue (Million) Forecast, by Application 2019 & 2032
- Table 31: Rest of Asia Pacific Cannabis-infused Edible Products Market Revenue (Million) Forecast, by Application 2019 & 2032
- Table 32: Global Cannabis-infused Edible Products Market Revenue Million Forecast, by Country 2019 & 2032
- Table 33: Brazil Cannabis-infused Edible Products Market Revenue (Million) Forecast, by Application 2019 & 2032
- Table 34: Argentina Cannabis-infused Edible Products Market Revenue (Million) Forecast, by Application 2019 & 2032
- Table 35: Peru Cannabis-infused Edible Products Market Revenue (Million) Forecast, by Application 2019 & 2032
- Table 36: Chile Cannabis-infused Edible Products Market Revenue (Million) Forecast, by Application 2019 & 2032
- Table 37: Colombia Cannabis-infused Edible Products Market Revenue (Million) Forecast, by Application 2019 & 2032
- Table 38: Ecuador Cannabis-infused Edible Products Market Revenue (Million) Forecast, by Application 2019 & 2032
- Table 39: Venezuela Cannabis-infused Edible Products Market Revenue (Million) Forecast, by Application 2019 & 2032
- Table 40: Rest of South America Cannabis-infused Edible Products Market Revenue (Million) Forecast, by Application 2019 & 2032
- Table 41: Global Cannabis-infused Edible Products Market Revenue Million Forecast, by Country 2019 & 2032
- Table 42: United States Cannabis-infused Edible Products Market Revenue (Million) Forecast, by Application 2019 & 2032
- Table 43: Canada Cannabis-infused Edible Products Market Revenue (Million) Forecast, by Application 2019 & 2032
- Table 44: Mexico Cannabis-infused Edible Products Market Revenue (Million) Forecast, by Application 2019 & 2032
- Table 45: Global Cannabis-infused Edible Products Market Revenue Million Forecast, by Country 2019 & 2032
- Table 46: United Arab Emirates Cannabis-infused Edible Products Market Revenue (Million) Forecast, by Application 2019 & 2032
- Table 47: Saudi Arabia Cannabis-infused Edible Products Market Revenue (Million) Forecast, by Application 2019 & 2032
- Table 48: South Africa Cannabis-infused Edible Products Market Revenue (Million) Forecast, by Application 2019 & 2032
- Table 49: Rest of Middle East and Africa Cannabis-infused Edible Products Market Revenue (Million) Forecast, by Application 2019 & 2032
- Table 50: Global Cannabis-infused Edible Products Market Revenue Million Forecast, by Product Type 2019 & 2032
- Table 51: Global Cannabis-infused Edible Products Market Revenue Million Forecast, by Distribution Channel 2019 & 2032
- Table 52: Global Cannabis-infused Edible Products Market Revenue Million Forecast, by Country 2019 & 2032
- Table 53: United States Cannabis-infused Edible Products Market Revenue (Million) Forecast, by Application 2019 & 2032
- Table 54: Canada Cannabis-infused Edible Products Market Revenue (Million) Forecast, by Application 2019 & 2032
- Table 55: Mexico Cannabis-infused Edible Products Market Revenue (Million) Forecast, by Application 2019 & 2032
- Table 56: Rest of North America Cannabis-infused Edible Products Market Revenue (Million) Forecast, by Application 2019 & 2032
- Table 57: Global Cannabis-infused Edible Products Market Revenue Million Forecast, by Product Type 2019 & 2032
- Table 58: Global Cannabis-infused Edible Products Market Revenue Million Forecast, by Distribution Channel 2019 & 2032
- Table 59: Global Cannabis-infused Edible Products Market Revenue Million Forecast, by Country 2019 & 2032
- Table 60: Spain Cannabis-infused Edible Products Market Revenue (Million) Forecast, by Application 2019 & 2032
- Table 61: United Kingdom Cannabis-infused Edible Products Market Revenue (Million) Forecast, by Application 2019 & 2032
- Table 62: Germany Cannabis-infused Edible Products Market Revenue (Million) Forecast, by Application 2019 & 2032
- Table 63: France Cannabis-infused Edible Products Market Revenue (Million) Forecast, by Application 2019 & 2032
- Table 64: Italy Cannabis-infused Edible Products Market Revenue (Million) Forecast, by Application 2019 & 2032
- Table 65: Rest of Europe Cannabis-infused Edible Products Market Revenue (Million) Forecast, by Application 2019 & 2032
- Table 66: Global Cannabis-infused Edible Products Market Revenue Million Forecast, by Product Type 2019 & 2032
- Table 67: Global Cannabis-infused Edible Products Market Revenue Million Forecast, by Distribution Channel 2019 & 2032
- Table 68: Global Cannabis-infused Edible Products Market Revenue Million Forecast, by Country 2019 & 2032
- Table 69: Japan Cannabis-infused Edible Products Market Revenue (Million) Forecast, by Application 2019 & 2032
- Table 70: Australia Cannabis-infused Edible Products Market Revenue (Million) Forecast, by Application 2019 & 2032
- Table 71: Rest of Asia Pacific Cannabis-infused Edible Products Market Revenue (Million) Forecast, by Application 2019 & 2032
- Table 72: Global Cannabis-infused Edible Products Market Revenue Million Forecast, by Product Type 2019 & 2032
- Table 73: Global Cannabis-infused Edible Products Market Revenue Million Forecast, by Distribution Channel 2019 & 2032
- Table 74: Global Cannabis-infused Edible Products Market Revenue Million Forecast, by Country 2019 & 2032
- Table 75: Africa Cannabis-infused Edible Products Market Revenue (Million) Forecast, by Application 2019 & 2032
- Table 76: South America Cannabis-infused Edible Products Market Revenue (Million) Forecast, by Application 2019 & 2032
Frequently Asked Questions
1. What is the projected Compound Annual Growth Rate (CAGR) of the Cannabis-infused Edible Products Market?
The projected CAGR is approximately 16.30%.
2. Which companies are prominent players in the Cannabis-infused Edible Products Market?
Key companies in the market include Canna River, RS Group (Lifestar), Village Farms International Inc, Spring Cannabis Express, Botanic Labs, CBDfx, Neurogen, Cannabinoid Creations, BellRock Brands Inc (Dixie Elixirs), Naturecan Ltd, Hempfusion Wellness Inc, Grön Confections (GrönCBD) LLC*List Not Exhaustive.
3. What are the main segments of the Cannabis-infused Edible Products Market?
The market segments include Product Type, Distribution Channel.
4. Can you provide details about the market size?
The market size is estimated to be USD XX Million as of 2022.
5. What are some drivers contributing to market growth?
Growing Demand for Convenience and Processed Foods Drives Demand; Expanding Cosmetic and Personal Care Industries Utilize Gelatin for Various Purposes.
6. What are the notable trends driving market growth?
More Patents and Collaborations with Micro-dosing.
7. Are there any restraints impacting market growth?
Fluctuations in Raw Material Proces Affecting Production Costs.
8. Can you provide examples of recent developments in the market?
N/A
9. What pricing options are available for accessing the report?
Pricing options include single-user, multi-user, and enterprise licenses priced at USD 4750, USD 5250, and USD 8750 respectively.
10. Is the market size provided in terms of value or volume?
The market size is provided in terms of value, measured in Million.
11. Are there any specific market keywords associated with the report?
Yes, the market keyword associated with the report is "Cannabis-infused Edible Products Market," which aids in identifying and referencing the specific market segment covered.
12. How do I determine which pricing option suits my needs best?
The pricing options vary based on user requirements and access needs. Individual users may opt for single-user licenses, while businesses requiring broader access may choose multi-user or enterprise licenses for cost-effective access to the report.
13. Are there any additional resources or data provided in the Cannabis-infused Edible Products Market report?
While the report offers comprehensive insights, it's advisable to review the specific contents or supplementary materials provided to ascertain if additional resources or data are available.
14. How can I stay updated on further developments or reports in the Cannabis-infused Edible Products Market?
To stay informed about further developments, trends, and reports in the Cannabis-infused Edible Products Market, consider subscribing to industry newsletters, following relevant companies and organizations, or regularly checking reputable industry news sources and publications.
Methodology
Step 1 - Identification of Relevant Samples Size from Population Database


Step 2 - Approaches for Defining Global Market Size (Value, Volume* & Price*)

Note*: In applicable scenarios
Step 3 - Data Sources
Primary Research
- Web Analytics
- Survey Reports
- Research Institute
- Latest Research Reports
- Opinion Leaders
Secondary Research
- Annual Reports
- White Paper
- Latest Press Release
- Industry Association
- Paid Database
- Investor Presentations

Step 4 - Data Triangulation
Involves using different sources of information in order to increase the validity of a study
These sources are likely to be stakeholders in a program - participants, other researchers, program staff, other community members, and so on.
Then we put all data in single framework & apply various statistical tools to find out the dynamic on the market.
During the analysis stage, feedback from the stakeholder groups would be compared to determine areas of agreement as well as areas of divergence


