
Key Insights
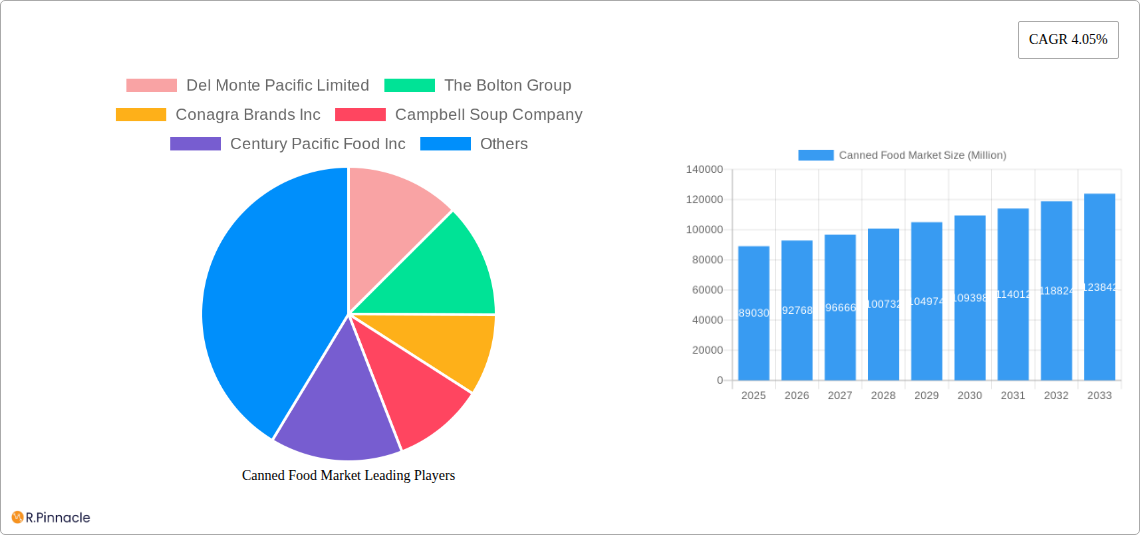
The global canned food market, valued at $89.03 billion in 2025, is projected to experience steady growth, driven by several key factors. The increasing demand for convenient and shelf-stable food options, particularly among busy working professionals and single-person households, fuels market expansion. Furthermore, the rising popularity of ready-to-eat meals and the growing awareness of food safety and preservation methods contribute significantly to market growth. Technological advancements in canning processes, leading to improved product quality and extended shelf life, also play a vital role. Specific product segments like canned vegetables and fruits benefit from health-conscious consumer trends seeking convenient sources of vitamins and minerals. The dominance of supermarkets and hypermarkets in distribution channels is expected to continue, although online retail stores are progressively gaining traction, reflecting the broader shift towards e-commerce. Geographic variations exist, with North America and Europe maintaining significant market shares due to established consumer preferences and robust retail infrastructure. However, the Asia-Pacific region demonstrates substantial growth potential, driven by rising disposable incomes and changing dietary habits. Competitive pressures among established players like Del Monte, Conagra Brands, and Thai Union Group, alongside the emergence of regional brands, will shape market dynamics in the coming years.
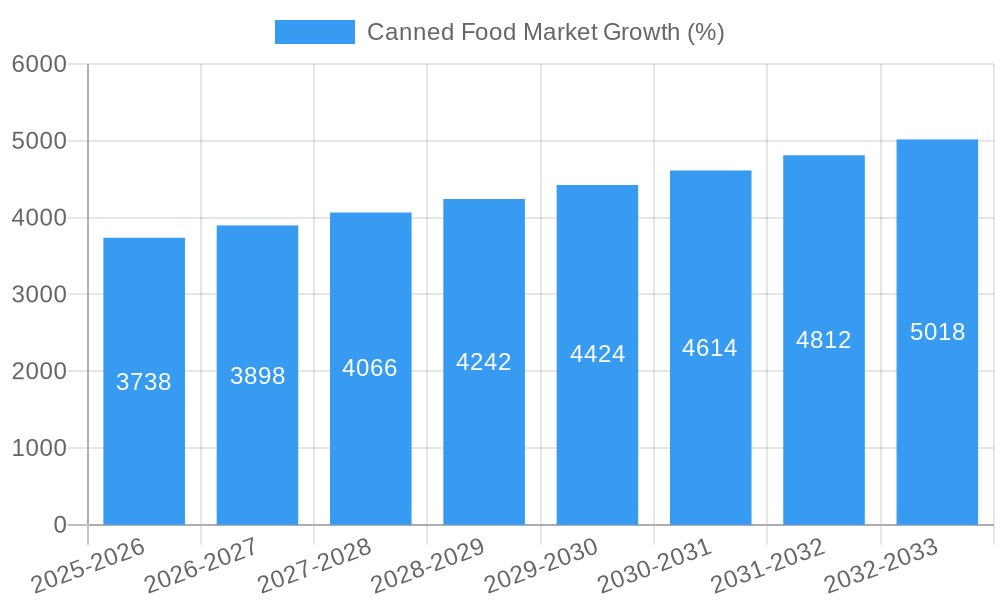
A projected Compound Annual Growth Rate (CAGR) of 4.05% from 2025 to 2033 indicates a consistent, albeit moderate, expansion of the canned food market. While restraints such as fluctuating raw material prices and concerns regarding the environmental impact of packaging materials present challenges, the market's resilience is supported by its established position as a fundamental part of global food systems. Strategic initiatives by major players focused on innovation, sustainability, and brand diversification will be crucial in navigating these challenges and capitalizing on emerging opportunities. The diversification of product offerings, including organic and gourmet canned goods, will also contribute to market growth by catering to evolving consumer preferences for healthier and higher-quality products. The continuous expansion of retail channels and the introduction of innovative packaging solutions will further shape the market's trajectory.
Canned Food Market: A Comprehensive Report (2019-2033)
This comprehensive report provides an in-depth analysis of the global canned food market, offering actionable insights for industry professionals and strategic decision-makers. The report covers the period 2019-2033, with a focus on the forecast period 2025-2033 and a base year of 2025. The market is segmented by type (Canned Meat Products, Canned Fish/Seafood, Canned Vegetables, Canned Fruits, Other Types) and distribution channel (Supermarkets/Hypermarkets, Convenience/Grocery Stores, Online Retail Stores, Other Distribution Channels). Key players analyzed include Del Monte Pacific Limited, The Bolton Group, Conagra Brands Inc, Campbell Soup Company, Century Pacific Food Inc, Thai Union Group PCL, Dole Holding Company LLC, JBS S A (SAMPCO), Bonduelle SA, and Kraft Heinz Company. The report projects a market valued at xx Million by 2033.
Canned Food Market Structure & Innovation Trends
The canned food market is characterized by a moderately concentrated structure, with several multinational corporations holding significant market share. The top ten players account for an estimated xx% of the global market. Innovation is driven by consumer demand for healthier, more convenient, and sustainably produced options. This includes a growing preference for organic and plant-based products, as well as increased focus on reduced sodium and sugar content. Regulatory frameworks concerning food safety and labeling vary across regions, influencing product development and marketing strategies. The market also faces competition from fresh and frozen foods, as well as other convenient meal solutions. Mergers and acquisitions (M&A) activities have played a significant role in shaping the market landscape. Recent deals, such as The Bolton Group's acquisition of Wild Planet Foods in 2021 (value: xx Million), have strengthened market positions and expanded product portfolios.
- Market Concentration: Top 10 players hold xx% market share (Estimated).
- M&A Activity: Significant M&A activity observed in the last 5 years, driving consolidation. Total M&A deal value: xx Million (Estimated).
- Innovation Drivers: Consumer demand for healthier, more convenient, and sustainable products.
- Regulatory Landscape: Varying food safety regulations across geographies.
Canned Food Market Dynamics & Trends
The canned food market is experiencing steady growth, driven primarily by factors like increasing urbanization, rising disposable incomes in developing economies, and the growing popularity of convenient and ready-to-eat meals. Technological advancements in packaging and preservation techniques further enhance product shelf life and quality. Changing consumer preferences, including a preference for organic, plant-based, and ethically sourced products, are also shaping market dynamics. The competitive landscape is highly dynamic, with established players focusing on innovation and product diversification to maintain their market share. The global canned food market is estimated to register a CAGR of xx% during the forecast period (2025-2033), with market penetration increasing significantly in emerging markets. E-commerce continues to influence distribution channels, representing a growing percentage of sales.
Dominant Regions & Segments in Canned Food Market
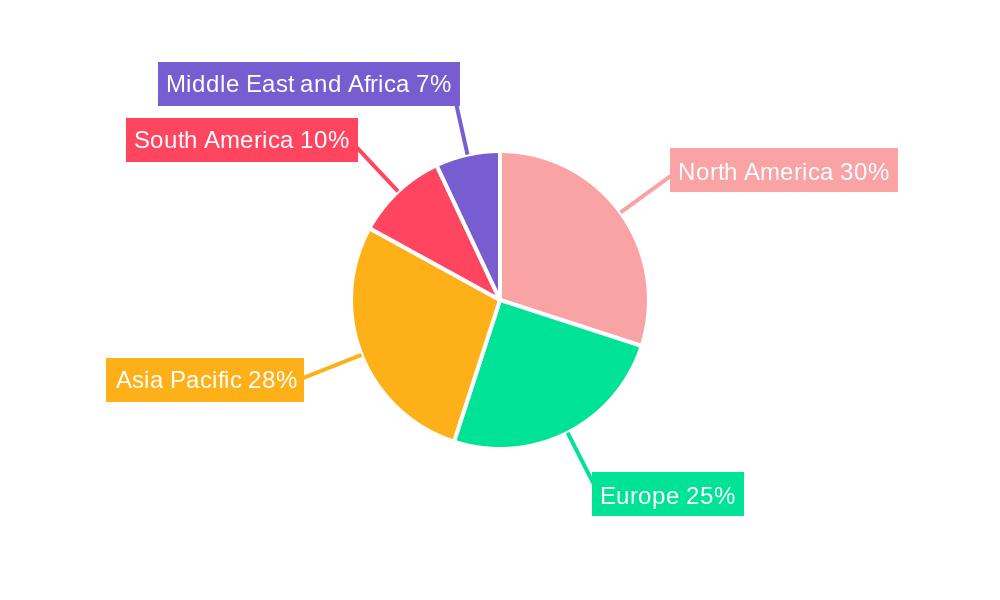
North America and Europe currently hold the largest market share within the global canned food sector. However, Asia-Pacific is expected to witness significant growth during the forecast period due to rapid urbanization and rising incomes.
- Leading Regions: North America and Europe currently dominate, with Asia-Pacific showing strong growth potential.
- Leading Segments:
- Type: Canned Vegetables hold the largest market share, followed by Canned Fruits and Canned Fish/Seafood.
- Distribution Channel: Supermarkets/Hypermarkets remain the dominant distribution channel, although online retail is expanding rapidly.
Key Drivers for Dominant Regions:
- North America & Europe: Established retail infrastructure, high consumer spending power, and robust regulatory frameworks.
- Asia-Pacific: Rapid urbanization, rising middle class, and increasing demand for convenient foods.
Canned Food Market Product Innovations
Recent product innovations have focused on addressing consumer demand for healthier options, improved convenience, and sustainable practices. This includes the launch of organic and plant-based products, reduced-sodium varieties, and innovative packaging solutions designed to minimize environmental impact. Technological advancements in canning techniques aim to enhance product quality and extend shelf life, while new flavor profiles and formats cater to evolving consumer preferences. These innovations contribute to creating a competitive edge for companies that can effectively meet the changing needs and demands of consumers.
Report Scope & Segmentation Analysis
This report analyzes the canned food market across several key segments:
- By Type: Canned Meat Products, Canned Fish/Seafood, Canned Vegetables, Canned Fruits, Other Types – each segment shows varied growth projections and competitive dynamics.
- By Distribution Channel: Supermarkets/Hypermarkets, Convenience/Grocery Stores, Online Retail Stores, Other Distribution Channels – detailed market size and growth forecasts are provided for each channel.
Key Drivers of Canned Food Market Growth
Several factors drive growth in the canned food market: the rising demand for convenient and ready-to-eat foods fuels the market, especially in urban settings. Technological advancements in packaging and preservation improve food quality and shelf life, increasing appeal. Government regulations promoting food safety and hygiene standards add to market growth. Expanding retail infrastructure in developing nations creates more avenues for distribution and accessibility.
Challenges in the Canned Food Market Sector
The canned food sector faces various challenges, including fluctuating raw material prices impacting production costs. Concerns over health and nutritional aspects of canned foods influence consumer choices, necessitating product innovations to address them. Stringent government regulations around food safety and labeling add to compliance costs. Intense competition among manufacturers requires continuous product development and marketing strategies.
Emerging Opportunities in Canned Food Market
The canned food market presents lucrative opportunities, especially in sustainable and environmentally friendly products. Growing demand for organic and ethically sourced canned goods creates niche market opportunities. Expansion into new and emerging markets globally offers considerable growth potential. Developing innovative packaging and preservation technologies further enhances product appeal and shelf life.
Leading Players in the Canned Food Market Market
- Del Monte Pacific Limited
- The Bolton Group
- Conagra Brands Inc
- Campbell Soup Company
- Century Pacific Food Inc
- Thai Union Group PCL
- Dole Holding Company LLC
- JBS S A (SAMPCO)
- Bonduelle SA
- Kraft Heinz Company
Key Developments in Canned Food Market Industry
- October 2022: Campbell Soup Company launched four new spicy Chunky Soup flavors.
- September 2022: Campbell's Pacific Foods launched 14 new organic ready-to-serve soups and plant-based chills.
- August 2021: The Bolton Group acquired Wild Planet Foods.
Future Outlook for Canned Food Market Market
The canned food market is poised for continued growth, driven by rising urbanization, increasing disposable incomes, and the ongoing demand for convenient and shelf-stable food options. Strategic investments in research and development, particularly in sustainable packaging and healthier product formulations, will be crucial for success. Expansion into emerging markets and the adoption of innovative distribution strategies, including e-commerce, will also play a vital role in shaping the future of this dynamic market.
Canned Food Market Segmentation
-
1. Type
- 1.1. Canned Meat Products
- 1.2. Canned Fish/Seafood
- 1.3. Canned Vegetables
- 1.4. Canned Fruits
- 1.5. Other Types
-
2. Distribution Channel
- 2.1. Supermarkets/Hypermarkets
- 2.2. Convenience/Grocery Stores
- 2.3. Online Retail Stores
- 2.4. Other Distribution Channels
Canned Food Market Segmentation By Geography
-
1. North America
- 1.1. United States
- 1.2. Canada
- 1.3. Mexico
- 1.4. Rest of North America
-
2. Europe
- 2.1. Spain
- 2.2. United Kingdom
- 2.3. Germany
- 2.4. France
- 2.5. Italy
- 2.6. Netherlands
- 2.7. Rest of Europe
-
3. Asia Pacific
- 3.1. China
- 3.2. Japan
- 3.3. India
- 3.4. Australia
- 3.5. Rest of Asia Pacific
-
4. South America
- 4.1. Brazil
- 4.2. Argentina
- 4.3. Rest of South America
-
5. Middle East and Africa
- 5.1. South Africa
- 5.2. Saudi Arabia
- 5.3. Rest of Middle East and Africa
Canned Food Market REPORT HIGHLIGHTS
| Aspects | Details |
|---|---|
| Study Period | 2019-2033 |
| Base Year | 2024 |
| Estimated Year | 2025 |
| Forecast Period | 2025-2033 |
| Historical Period | 2019-2024 |
| Growth Rate | CAGR of 4.05% from 2019-2033 |
| Segmentation |
|
Table of Contents
- 1. Introduction
- 1.1. Research Scope
- 1.2. Market Segmentation
- 1.3. Research Methodology
- 1.4. Definitions and Assumptions
- 2. Executive Summary
- 2.1. Introduction
- 3. Market Dynamics
- 3.1. Introduction
- 3.2. Market Drivers
- 3.2.1. Increasing urbanization and globalization contribute to changing dietary habits and a greater demand for convenient food options
- 3.3. Market Restrains
- 3.3.1. Shelf Life Limitations and Changing Consumer Preferences
- 3.4. Market Trends
- 3.4.1. Increasing variety of canned foods including gourmet and premium options
- 4. Market Factor Analysis
- 4.1. Porters Five Forces
- 4.2. Supply/Value Chain
- 4.3. PESTEL analysis
- 4.4. Market Entropy
- 4.5. Patent/Trademark Analysis
- 5. Global Canned Food Market Analysis, Insights and Forecast, 2019-2031
- 5.1. Market Analysis, Insights and Forecast - by Type
- 5.1.1. Canned Meat Products
- 5.1.2. Canned Fish/Seafood
- 5.1.3. Canned Vegetables
- 5.1.4. Canned Fruits
- 5.1.5. Other Types
- 5.2. Market Analysis, Insights and Forecast - by Distribution Channel
- 5.2.1. Supermarkets/Hypermarkets
- 5.2.2. Convenience/Grocery Stores
- 5.2.3. Online Retail Stores
- 5.2.4. Other Distribution Channels
- 5.3. Market Analysis, Insights and Forecast - by Region
- 5.3.1. North America
- 5.3.2. Europe
- 5.3.3. Asia Pacific
- 5.3.4. South America
- 5.3.5. Middle East and Africa
- 5.1. Market Analysis, Insights and Forecast - by Type
- 6. North America Canned Food Market Analysis, Insights and Forecast, 2019-2031
- 6.1. Market Analysis, Insights and Forecast - by Type
- 6.1.1. Canned Meat Products
- 6.1.2. Canned Fish/Seafood
- 6.1.3. Canned Vegetables
- 6.1.4. Canned Fruits
- 6.1.5. Other Types
- 6.2. Market Analysis, Insights and Forecast - by Distribution Channel
- 6.2.1. Supermarkets/Hypermarkets
- 6.2.2. Convenience/Grocery Stores
- 6.2.3. Online Retail Stores
- 6.2.4. Other Distribution Channels
- 6.1. Market Analysis, Insights and Forecast - by Type
- 7. Europe Canned Food Market Analysis, Insights and Forecast, 2019-2031
- 7.1. Market Analysis, Insights and Forecast - by Type
- 7.1.1. Canned Meat Products
- 7.1.2. Canned Fish/Seafood
- 7.1.3. Canned Vegetables
- 7.1.4. Canned Fruits
- 7.1.5. Other Types
- 7.2. Market Analysis, Insights and Forecast - by Distribution Channel
- 7.2.1. Supermarkets/Hypermarkets
- 7.2.2. Convenience/Grocery Stores
- 7.2.3. Online Retail Stores
- 7.2.4. Other Distribution Channels
- 7.1. Market Analysis, Insights and Forecast - by Type
- 8. Asia Pacific Canned Food Market Analysis, Insights and Forecast, 2019-2031
- 8.1. Market Analysis, Insights and Forecast - by Type
- 8.1.1. Canned Meat Products
- 8.1.2. Canned Fish/Seafood
- 8.1.3. Canned Vegetables
- 8.1.4. Canned Fruits
- 8.1.5. Other Types
- 8.2. Market Analysis, Insights and Forecast - by Distribution Channel
- 8.2.1. Supermarkets/Hypermarkets
- 8.2.2. Convenience/Grocery Stores
- 8.2.3. Online Retail Stores
- 8.2.4. Other Distribution Channels
- 8.1. Market Analysis, Insights and Forecast - by Type
- 9. South America Canned Food Market Analysis, Insights and Forecast, 2019-2031
- 9.1. Market Analysis, Insights and Forecast - by Type
- 9.1.1. Canned Meat Products
- 9.1.2. Canned Fish/Seafood
- 9.1.3. Canned Vegetables
- 9.1.4. Canned Fruits
- 9.1.5. Other Types
- 9.2. Market Analysis, Insights and Forecast - by Distribution Channel
- 9.2.1. Supermarkets/Hypermarkets
- 9.2.2. Convenience/Grocery Stores
- 9.2.3. Online Retail Stores
- 9.2.4. Other Distribution Channels
- 9.1. Market Analysis, Insights and Forecast - by Type
- 10. Middle East and Africa Canned Food Market Analysis, Insights and Forecast, 2019-2031
- 10.1. Market Analysis, Insights and Forecast - by Type
- 10.1.1. Canned Meat Products
- 10.1.2. Canned Fish/Seafood
- 10.1.3. Canned Vegetables
- 10.1.4. Canned Fruits
- 10.1.5. Other Types
- 10.2. Market Analysis, Insights and Forecast - by Distribution Channel
- 10.2.1. Supermarkets/Hypermarkets
- 10.2.2. Convenience/Grocery Stores
- 10.2.3. Online Retail Stores
- 10.2.4. Other Distribution Channels
- 10.1. Market Analysis, Insights and Forecast - by Type
- 11. North America Canned Food Market Analysis, Insights and Forecast, 2019-2031
- 11.1. Market Analysis, Insights and Forecast - By Country/Sub-region
- 11.1.1 United States
- 11.1.2 Canada
- 11.1.3 Mexico
- 11.1.4 Rest of North America
- 12. Europe Canned Food Market Analysis, Insights and Forecast, 2019-2031
- 12.1. Market Analysis, Insights and Forecast - By Country/Sub-region
- 12.1.1 Spain
- 12.1.2 United Kingdom
- 12.1.3 Germany
- 12.1.4 France
- 12.1.5 Italy
- 12.1.6 Russia
- 12.1.7 Rest of Europe
- 13. Asia Pacific Canned Food Market Analysis, Insights and Forecast, 2019-2031
- 13.1. Market Analysis, Insights and Forecast - By Country/Sub-region
- 13.1.1 China
- 13.1.2 Japan
- 13.1.3 India
- 13.1.4 Australia
- 13.1.5 Rest of Asia Pacific
- 14. South America Canned Food Market Analysis, Insights and Forecast, 2019-2031
- 14.1. Market Analysis, Insights and Forecast - By Country/Sub-region
- 14.1.1 Brazil
- 14.1.2 Argentina
- 14.1.3 Rest of South America
- 15. Middle East and Africa Canned Food Market Analysis, Insights and Forecast, 2019-2031
- 15.1. Market Analysis, Insights and Forecast - By Country/Sub-region
- 15.1.1 South Africa
- 15.1.2 Saudi Arabia
- 15.1.3 Rest of Middle East and Africa
- 16. Competitive Analysis
- 16.1. Global Market Share Analysis 2024
- 16.2. Company Profiles
- 16.2.1 Del Monte Pacific Limited
- 16.2.1.1. Overview
- 16.2.1.2. Products
- 16.2.1.3. SWOT Analysis
- 16.2.1.4. Recent Developments
- 16.2.1.5. Financials (Based on Availability)
- 16.2.2 The Bolton Group
- 16.2.2.1. Overview
- 16.2.2.2. Products
- 16.2.2.3. SWOT Analysis
- 16.2.2.4. Recent Developments
- 16.2.2.5. Financials (Based on Availability)
- 16.2.3 Conagra Brands Inc
- 16.2.3.1. Overview
- 16.2.3.2. Products
- 16.2.3.3. SWOT Analysis
- 16.2.3.4. Recent Developments
- 16.2.3.5. Financials (Based on Availability)
- 16.2.4 Campbell Soup Company
- 16.2.4.1. Overview
- 16.2.4.2. Products
- 16.2.4.3. SWOT Analysis
- 16.2.4.4. Recent Developments
- 16.2.4.5. Financials (Based on Availability)
- 16.2.5 Century Pacific Food Inc
- 16.2.5.1. Overview
- 16.2.5.2. Products
- 16.2.5.3. SWOT Analysis
- 16.2.5.4. Recent Developments
- 16.2.5.5. Financials (Based on Availability)
- 16.2.6 Thai Union Group PCL
- 16.2.6.1. Overview
- 16.2.6.2. Products
- 16.2.6.3. SWOT Analysis
- 16.2.6.4. Recent Developments
- 16.2.6.5. Financials (Based on Availability)
- 16.2.7 Dole Holding Company LLC
- 16.2.7.1. Overview
- 16.2.7.2. Products
- 16.2.7.3. SWOT Analysis
- 16.2.7.4. Recent Developments
- 16.2.7.5. Financials (Based on Availability)
- 16.2.8 JBS S A (SAMPCO)
- 16.2.8.1. Overview
- 16.2.8.2. Products
- 16.2.8.3. SWOT Analysis
- 16.2.8.4. Recent Developments
- 16.2.8.5. Financials (Based on Availability)
- 16.2.9 Bonduelle SA
- 16.2.9.1. Overview
- 16.2.9.2. Products
- 16.2.9.3. SWOT Analysis
- 16.2.9.4. Recent Developments
- 16.2.9.5. Financials (Based on Availability)
- 16.2.10 Kraft Heinz Company
- 16.2.10.1. Overview
- 16.2.10.2. Products
- 16.2.10.3. SWOT Analysis
- 16.2.10.4. Recent Developments
- 16.2.10.5. Financials (Based on Availability)
- 16.2.1 Del Monte Pacific Limited
List of Figures
- Figure 1: Global Canned Food Market Revenue Breakdown (Million, %) by Region 2024 & 2032
- Figure 2: Global Canned Food Market Volume Breakdown (K Tons, %) by Region 2024 & 2032
- Figure 3: North America Canned Food Market Revenue (Million), by Country 2024 & 2032
- Figure 4: North America Canned Food Market Volume (K Tons), by Country 2024 & 2032
- Figure 5: North America Canned Food Market Revenue Share (%), by Country 2024 & 2032
- Figure 6: North America Canned Food Market Volume Share (%), by Country 2024 & 2032
- Figure 7: Europe Canned Food Market Revenue (Million), by Country 2024 & 2032
- Figure 8: Europe Canned Food Market Volume (K Tons), by Country 2024 & 2032
- Figure 9: Europe Canned Food Market Revenue Share (%), by Country 2024 & 2032
- Figure 10: Europe Canned Food Market Volume Share (%), by Country 2024 & 2032
- Figure 11: Asia Pacific Canned Food Market Revenue (Million), by Country 2024 & 2032
- Figure 12: Asia Pacific Canned Food Market Volume (K Tons), by Country 2024 & 2032
- Figure 13: Asia Pacific Canned Food Market Revenue Share (%), by Country 2024 & 2032
- Figure 14: Asia Pacific Canned Food Market Volume Share (%), by Country 2024 & 2032
- Figure 15: South America Canned Food Market Revenue (Million), by Country 2024 & 2032
- Figure 16: South America Canned Food Market Volume (K Tons), by Country 2024 & 2032
- Figure 17: South America Canned Food Market Revenue Share (%), by Country 2024 & 2032
- Figure 18: South America Canned Food Market Volume Share (%), by Country 2024 & 2032
- Figure 19: Middle East and Africa Canned Food Market Revenue (Million), by Country 2024 & 2032
- Figure 20: Middle East and Africa Canned Food Market Volume (K Tons), by Country 2024 & 2032
- Figure 21: Middle East and Africa Canned Food Market Revenue Share (%), by Country 2024 & 2032
- Figure 22: Middle East and Africa Canned Food Market Volume Share (%), by Country 2024 & 2032
- Figure 23: North America Canned Food Market Revenue (Million), by Type 2024 & 2032
- Figure 24: North America Canned Food Market Volume (K Tons), by Type 2024 & 2032
- Figure 25: North America Canned Food Market Revenue Share (%), by Type 2024 & 2032
- Figure 26: North America Canned Food Market Volume Share (%), by Type 2024 & 2032
- Figure 27: North America Canned Food Market Revenue (Million), by Distribution Channel 2024 & 2032
- Figure 28: North America Canned Food Market Volume (K Tons), by Distribution Channel 2024 & 2032
- Figure 29: North America Canned Food Market Revenue Share (%), by Distribution Channel 2024 & 2032
- Figure 30: North America Canned Food Market Volume Share (%), by Distribution Channel 2024 & 2032
- Figure 31: North America Canned Food Market Revenue (Million), by Country 2024 & 2032
- Figure 32: North America Canned Food Market Volume (K Tons), by Country 2024 & 2032
- Figure 33: North America Canned Food Market Revenue Share (%), by Country 2024 & 2032
- Figure 34: North America Canned Food Market Volume Share (%), by Country 2024 & 2032
- Figure 35: Europe Canned Food Market Revenue (Million), by Type 2024 & 2032
- Figure 36: Europe Canned Food Market Volume (K Tons), by Type 2024 & 2032
- Figure 37: Europe Canned Food Market Revenue Share (%), by Type 2024 & 2032
- Figure 38: Europe Canned Food Market Volume Share (%), by Type 2024 & 2032
- Figure 39: Europe Canned Food Market Revenue (Million), by Distribution Channel 2024 & 2032
- Figure 40: Europe Canned Food Market Volume (K Tons), by Distribution Channel 2024 & 2032
- Figure 41: Europe Canned Food Market Revenue Share (%), by Distribution Channel 2024 & 2032
- Figure 42: Europe Canned Food Market Volume Share (%), by Distribution Channel 2024 & 2032
- Figure 43: Europe Canned Food Market Revenue (Million), by Country 2024 & 2032
- Figure 44: Europe Canned Food Market Volume (K Tons), by Country 2024 & 2032
- Figure 45: Europe Canned Food Market Revenue Share (%), by Country 2024 & 2032
- Figure 46: Europe Canned Food Market Volume Share (%), by Country 2024 & 2032
- Figure 47: Asia Pacific Canned Food Market Revenue (Million), by Type 2024 & 2032
- Figure 48: Asia Pacific Canned Food Market Volume (K Tons), by Type 2024 & 2032
- Figure 49: Asia Pacific Canned Food Market Revenue Share (%), by Type 2024 & 2032
- Figure 50: Asia Pacific Canned Food Market Volume Share (%), by Type 2024 & 2032
- Figure 51: Asia Pacific Canned Food Market Revenue (Million), by Distribution Channel 2024 & 2032
- Figure 52: Asia Pacific Canned Food Market Volume (K Tons), by Distribution Channel 2024 & 2032
- Figure 53: Asia Pacific Canned Food Market Revenue Share (%), by Distribution Channel 2024 & 2032
- Figure 54: Asia Pacific Canned Food Market Volume Share (%), by Distribution Channel 2024 & 2032
- Figure 55: Asia Pacific Canned Food Market Revenue (Million), by Country 2024 & 2032
- Figure 56: Asia Pacific Canned Food Market Volume (K Tons), by Country 2024 & 2032
- Figure 57: Asia Pacific Canned Food Market Revenue Share (%), by Country 2024 & 2032
- Figure 58: Asia Pacific Canned Food Market Volume Share (%), by Country 2024 & 2032
- Figure 59: South America Canned Food Market Revenue (Million), by Type 2024 & 2032
- Figure 60: South America Canned Food Market Volume (K Tons), by Type 2024 & 2032
- Figure 61: South America Canned Food Market Revenue Share (%), by Type 2024 & 2032
- Figure 62: South America Canned Food Market Volume Share (%), by Type 2024 & 2032
- Figure 63: South America Canned Food Market Revenue (Million), by Distribution Channel 2024 & 2032
- Figure 64: South America Canned Food Market Volume (K Tons), by Distribution Channel 2024 & 2032
- Figure 65: South America Canned Food Market Revenue Share (%), by Distribution Channel 2024 & 2032
- Figure 66: South America Canned Food Market Volume Share (%), by Distribution Channel 2024 & 2032
- Figure 67: South America Canned Food Market Revenue (Million), by Country 2024 & 2032
- Figure 68: South America Canned Food Market Volume (K Tons), by Country 2024 & 2032
- Figure 69: South America Canned Food Market Revenue Share (%), by Country 2024 & 2032
- Figure 70: South America Canned Food Market Volume Share (%), by Country 2024 & 2032
- Figure 71: Middle East and Africa Canned Food Market Revenue (Million), by Type 2024 & 2032
- Figure 72: Middle East and Africa Canned Food Market Volume (K Tons), by Type 2024 & 2032
- Figure 73: Middle East and Africa Canned Food Market Revenue Share (%), by Type 2024 & 2032
- Figure 74: Middle East and Africa Canned Food Market Volume Share (%), by Type 2024 & 2032
- Figure 75: Middle East and Africa Canned Food Market Revenue (Million), by Distribution Channel 2024 & 2032
- Figure 76: Middle East and Africa Canned Food Market Volume (K Tons), by Distribution Channel 2024 & 2032
- Figure 77: Middle East and Africa Canned Food Market Revenue Share (%), by Distribution Channel 2024 & 2032
- Figure 78: Middle East and Africa Canned Food Market Volume Share (%), by Distribution Channel 2024 & 2032
- Figure 79: Middle East and Africa Canned Food Market Revenue (Million), by Country 2024 & 2032
- Figure 80: Middle East and Africa Canned Food Market Volume (K Tons), by Country 2024 & 2032
- Figure 81: Middle East and Africa Canned Food Market Revenue Share (%), by Country 2024 & 2032
- Figure 82: Middle East and Africa Canned Food Market Volume Share (%), by Country 2024 & 2032
List of Tables
- Table 1: Global Canned Food Market Revenue Million Forecast, by Region 2019 & 2032
- Table 2: Global Canned Food Market Volume K Tons Forecast, by Region 2019 & 2032
- Table 3: Global Canned Food Market Revenue Million Forecast, by Type 2019 & 2032
- Table 4: Global Canned Food Market Volume K Tons Forecast, by Type 2019 & 2032
- Table 5: Global Canned Food Market Revenue Million Forecast, by Distribution Channel 2019 & 2032
- Table 6: Global Canned Food Market Volume K Tons Forecast, by Distribution Channel 2019 & 2032
- Table 7: Global Canned Food Market Revenue Million Forecast, by Region 2019 & 2032
- Table 8: Global Canned Food Market Volume K Tons Forecast, by Region 2019 & 2032
- Table 9: Global Canned Food Market Revenue Million Forecast, by Country 2019 & 2032
- Table 10: Global Canned Food Market Volume K Tons Forecast, by Country 2019 & 2032
- Table 11: United States Canned Food Market Revenue (Million) Forecast, by Application 2019 & 2032
- Table 12: United States Canned Food Market Volume (K Tons) Forecast, by Application 2019 & 2032
- Table 13: Canada Canned Food Market Revenue (Million) Forecast, by Application 2019 & 2032
- Table 14: Canada Canned Food Market Volume (K Tons) Forecast, by Application 2019 & 2032
- Table 15: Mexico Canned Food Market Revenue (Million) Forecast, by Application 2019 & 2032
- Table 16: Mexico Canned Food Market Volume (K Tons) Forecast, by Application 2019 & 2032
- Table 17: Rest of North America Canned Food Market Revenue (Million) Forecast, by Application 2019 & 2032
- Table 18: Rest of North America Canned Food Market Volume (K Tons) Forecast, by Application 2019 & 2032
- Table 19: Global Canned Food Market Revenue Million Forecast, by Country 2019 & 2032
- Table 20: Global Canned Food Market Volume K Tons Forecast, by Country 2019 & 2032
- Table 21: Spain Canned Food Market Revenue (Million) Forecast, by Application 2019 & 2032
- Table 22: Spain Canned Food Market Volume (K Tons) Forecast, by Application 2019 & 2032
- Table 23: United Kingdom Canned Food Market Revenue (Million) Forecast, by Application 2019 & 2032
- Table 24: United Kingdom Canned Food Market Volume (K Tons) Forecast, by Application 2019 & 2032
- Table 25: Germany Canned Food Market Revenue (Million) Forecast, by Application 2019 & 2032
- Table 26: Germany Canned Food Market Volume (K Tons) Forecast, by Application 2019 & 2032
- Table 27: France Canned Food Market Revenue (Million) Forecast, by Application 2019 & 2032
- Table 28: France Canned Food Market Volume (K Tons) Forecast, by Application 2019 & 2032
- Table 29: Italy Canned Food Market Revenue (Million) Forecast, by Application 2019 & 2032
- Table 30: Italy Canned Food Market Volume (K Tons) Forecast, by Application 2019 & 2032
- Table 31: Russia Canned Food Market Revenue (Million) Forecast, by Application 2019 & 2032
- Table 32: Russia Canned Food Market Volume (K Tons) Forecast, by Application 2019 & 2032
- Table 33: Rest of Europe Canned Food Market Revenue (Million) Forecast, by Application 2019 & 2032
- Table 34: Rest of Europe Canned Food Market Volume (K Tons) Forecast, by Application 2019 & 2032
- Table 35: Global Canned Food Market Revenue Million Forecast, by Country 2019 & 2032
- Table 36: Global Canned Food Market Volume K Tons Forecast, by Country 2019 & 2032
- Table 37: China Canned Food Market Revenue (Million) Forecast, by Application 2019 & 2032
- Table 38: China Canned Food Market Volume (K Tons) Forecast, by Application 2019 & 2032
- Table 39: Japan Canned Food Market Revenue (Million) Forecast, by Application 2019 & 2032
- Table 40: Japan Canned Food Market Volume (K Tons) Forecast, by Application 2019 & 2032
- Table 41: India Canned Food Market Revenue (Million) Forecast, by Application 2019 & 2032
- Table 42: India Canned Food Market Volume (K Tons) Forecast, by Application 2019 & 2032
- Table 43: Australia Canned Food Market Revenue (Million) Forecast, by Application 2019 & 2032
- Table 44: Australia Canned Food Market Volume (K Tons) Forecast, by Application 2019 & 2032
- Table 45: Rest of Asia Pacific Canned Food Market Revenue (Million) Forecast, by Application 2019 & 2032
- Table 46: Rest of Asia Pacific Canned Food Market Volume (K Tons) Forecast, by Application 2019 & 2032
- Table 47: Global Canned Food Market Revenue Million Forecast, by Country 2019 & 2032
- Table 48: Global Canned Food Market Volume K Tons Forecast, by Country 2019 & 2032
- Table 49: Brazil Canned Food Market Revenue (Million) Forecast, by Application 2019 & 2032
- Table 50: Brazil Canned Food Market Volume (K Tons) Forecast, by Application 2019 & 2032
- Table 51: Argentina Canned Food Market Revenue (Million) Forecast, by Application 2019 & 2032
- Table 52: Argentina Canned Food Market Volume (K Tons) Forecast, by Application 2019 & 2032
- Table 53: Rest of South America Canned Food Market Revenue (Million) Forecast, by Application 2019 & 2032
- Table 54: Rest of South America Canned Food Market Volume (K Tons) Forecast, by Application 2019 & 2032
- Table 55: Global Canned Food Market Revenue Million Forecast, by Country 2019 & 2032
- Table 56: Global Canned Food Market Volume K Tons Forecast, by Country 2019 & 2032
- Table 57: South Africa Canned Food Market Revenue (Million) Forecast, by Application 2019 & 2032
- Table 58: South Africa Canned Food Market Volume (K Tons) Forecast, by Application 2019 & 2032
- Table 59: Saudi Arabia Canned Food Market Revenue (Million) Forecast, by Application 2019 & 2032
- Table 60: Saudi Arabia Canned Food Market Volume (K Tons) Forecast, by Application 2019 & 2032
- Table 61: Rest of Middle East and Africa Canned Food Market Revenue (Million) Forecast, by Application 2019 & 2032
- Table 62: Rest of Middle East and Africa Canned Food Market Volume (K Tons) Forecast, by Application 2019 & 2032
- Table 63: Global Canned Food Market Revenue Million Forecast, by Type 2019 & 2032
- Table 64: Global Canned Food Market Volume K Tons Forecast, by Type 2019 & 2032
- Table 65: Global Canned Food Market Revenue Million Forecast, by Distribution Channel 2019 & 2032
- Table 66: Global Canned Food Market Volume K Tons Forecast, by Distribution Channel 2019 & 2032
- Table 67: Global Canned Food Market Revenue Million Forecast, by Country 2019 & 2032
- Table 68: Global Canned Food Market Volume K Tons Forecast, by Country 2019 & 2032
- Table 69: United States Canned Food Market Revenue (Million) Forecast, by Application 2019 & 2032
- Table 70: United States Canned Food Market Volume (K Tons) Forecast, by Application 2019 & 2032
- Table 71: Canada Canned Food Market Revenue (Million) Forecast, by Application 2019 & 2032
- Table 72: Canada Canned Food Market Volume (K Tons) Forecast, by Application 2019 & 2032
- Table 73: Mexico Canned Food Market Revenue (Million) Forecast, by Application 2019 & 2032
- Table 74: Mexico Canned Food Market Volume (K Tons) Forecast, by Application 2019 & 2032
- Table 75: Rest of North America Canned Food Market Revenue (Million) Forecast, by Application 2019 & 2032
- Table 76: Rest of North America Canned Food Market Volume (K Tons) Forecast, by Application 2019 & 2032
- Table 77: Global Canned Food Market Revenue Million Forecast, by Type 2019 & 2032
- Table 78: Global Canned Food Market Volume K Tons Forecast, by Type 2019 & 2032
- Table 79: Global Canned Food Market Revenue Million Forecast, by Distribution Channel 2019 & 2032
- Table 80: Global Canned Food Market Volume K Tons Forecast, by Distribution Channel 2019 & 2032
- Table 81: Global Canned Food Market Revenue Million Forecast, by Country 2019 & 2032
- Table 82: Global Canned Food Market Volume K Tons Forecast, by Country 2019 & 2032
- Table 83: Spain Canned Food Market Revenue (Million) Forecast, by Application 2019 & 2032
- Table 84: Spain Canned Food Market Volume (K Tons) Forecast, by Application 2019 & 2032
- Table 85: United Kingdom Canned Food Market Revenue (Million) Forecast, by Application 2019 & 2032
- Table 86: United Kingdom Canned Food Market Volume (K Tons) Forecast, by Application 2019 & 2032
- Table 87: Germany Canned Food Market Revenue (Million) Forecast, by Application 2019 & 2032
- Table 88: Germany Canned Food Market Volume (K Tons) Forecast, by Application 2019 & 2032
- Table 89: France Canned Food Market Revenue (Million) Forecast, by Application 2019 & 2032
- Table 90: France Canned Food Market Volume (K Tons) Forecast, by Application 2019 & 2032
- Table 91: Italy Canned Food Market Revenue (Million) Forecast, by Application 2019 & 2032
- Table 92: Italy Canned Food Market Volume (K Tons) Forecast, by Application 2019 & 2032
- Table 93: Netherlands Canned Food Market Revenue (Million) Forecast, by Application 2019 & 2032
- Table 94: Netherlands Canned Food Market Volume (K Tons) Forecast, by Application 2019 & 2032
- Table 95: Rest of Europe Canned Food Market Revenue (Million) Forecast, by Application 2019 & 2032
- Table 96: Rest of Europe Canned Food Market Volume (K Tons) Forecast, by Application 2019 & 2032
- Table 97: Global Canned Food Market Revenue Million Forecast, by Type 2019 & 2032
- Table 98: Global Canned Food Market Volume K Tons Forecast, by Type 2019 & 2032
- Table 99: Global Canned Food Market Revenue Million Forecast, by Distribution Channel 2019 & 2032
- Table 100: Global Canned Food Market Volume K Tons Forecast, by Distribution Channel 2019 & 2032
- Table 101: Global Canned Food Market Revenue Million Forecast, by Country 2019 & 2032
- Table 102: Global Canned Food Market Volume K Tons Forecast, by Country 2019 & 2032
- Table 103: China Canned Food Market Revenue (Million) Forecast, by Application 2019 & 2032
- Table 104: China Canned Food Market Volume (K Tons) Forecast, by Application 2019 & 2032
- Table 105: Japan Canned Food Market Revenue (Million) Forecast, by Application 2019 & 2032
- Table 106: Japan Canned Food Market Volume (K Tons) Forecast, by Application 2019 & 2032
- Table 107: India Canned Food Market Revenue (Million) Forecast, by Application 2019 & 2032
- Table 108: India Canned Food Market Volume (K Tons) Forecast, by Application 2019 & 2032
- Table 109: Australia Canned Food Market Revenue (Million) Forecast, by Application 2019 & 2032
- Table 110: Australia Canned Food Market Volume (K Tons) Forecast, by Application 2019 & 2032
- Table 111: Rest of Asia Pacific Canned Food Market Revenue (Million) Forecast, by Application 2019 & 2032
- Table 112: Rest of Asia Pacific Canned Food Market Volume (K Tons) Forecast, by Application 2019 & 2032
- Table 113: Global Canned Food Market Revenue Million Forecast, by Type 2019 & 2032
- Table 114: Global Canned Food Market Volume K Tons Forecast, by Type 2019 & 2032
- Table 115: Global Canned Food Market Revenue Million Forecast, by Distribution Channel 2019 & 2032
- Table 116: Global Canned Food Market Volume K Tons Forecast, by Distribution Channel 2019 & 2032
- Table 117: Global Canned Food Market Revenue Million Forecast, by Country 2019 & 2032
- Table 118: Global Canned Food Market Volume K Tons Forecast, by Country 2019 & 2032
- Table 119: Brazil Canned Food Market Revenue (Million) Forecast, by Application 2019 & 2032
- Table 120: Brazil Canned Food Market Volume (K Tons) Forecast, by Application 2019 & 2032
- Table 121: Argentina Canned Food Market Revenue (Million) Forecast, by Application 2019 & 2032
- Table 122: Argentina Canned Food Market Volume (K Tons) Forecast, by Application 2019 & 2032
- Table 123: Rest of South America Canned Food Market Revenue (Million) Forecast, by Application 2019 & 2032
- Table 124: Rest of South America Canned Food Market Volume (K Tons) Forecast, by Application 2019 & 2032
- Table 125: Global Canned Food Market Revenue Million Forecast, by Type 2019 & 2032
- Table 126: Global Canned Food Market Volume K Tons Forecast, by Type 2019 & 2032
- Table 127: Global Canned Food Market Revenue Million Forecast, by Distribution Channel 2019 & 2032
- Table 128: Global Canned Food Market Volume K Tons Forecast, by Distribution Channel 2019 & 2032
- Table 129: Global Canned Food Market Revenue Million Forecast, by Country 2019 & 2032
- Table 130: Global Canned Food Market Volume K Tons Forecast, by Country 2019 & 2032
- Table 131: South Africa Canned Food Market Revenue (Million) Forecast, by Application 2019 & 2032
- Table 132: South Africa Canned Food Market Volume (K Tons) Forecast, by Application 2019 & 2032
- Table 133: Saudi Arabia Canned Food Market Revenue (Million) Forecast, by Application 2019 & 2032
- Table 134: Saudi Arabia Canned Food Market Volume (K Tons) Forecast, by Application 2019 & 2032
- Table 135: Rest of Middle East and Africa Canned Food Market Revenue (Million) Forecast, by Application 2019 & 2032
- Table 136: Rest of Middle East and Africa Canned Food Market Volume (K Tons) Forecast, by Application 2019 & 2032
Frequently Asked Questions
1. What is the projected Compound Annual Growth Rate (CAGR) of the Canned Food Market?
The projected CAGR is approximately 4.05%.
2. Which companies are prominent players in the Canned Food Market?
Key companies in the market include Del Monte Pacific Limited, The Bolton Group, Conagra Brands Inc, Campbell Soup Company, Century Pacific Food Inc, Thai Union Group PCL, Dole Holding Company LLC, JBS S A (SAMPCO), Bonduelle SA, Kraft Heinz Company.
3. What are the main segments of the Canned Food Market?
The market segments include Type, Distribution Channel.
4. Can you provide details about the market size?
The market size is estimated to be USD 89.03 Million as of 2022.
5. What are some drivers contributing to market growth?
Increasing urbanization and globalization contribute to changing dietary habits and a greater demand for convenient food options.
6. What are the notable trends driving market growth?
Increasing variety of canned foods including gourmet and premium options.
7. Are there any restraints impacting market growth?
Shelf Life Limitations and Changing Consumer Preferences.
8. Can you provide examples of recent developments in the market?
In October 2022, Campbell Soup Company's Chunky Soup launched four new flavors named Spicy Chicken Noodle, Spicy Steak n' Potato, Spicy Sirloin Burger, and Spicy Chicken and Sausage Gumbo.
9. What pricing options are available for accessing the report?
Pricing options include single-user, multi-user, and enterprise licenses priced at USD 4750, USD 5250, and USD 8750 respectively.
10. Is the market size provided in terms of value or volume?
The market size is provided in terms of value, measured in Million and volume, measured in K Tons.
11. Are there any specific market keywords associated with the report?
Yes, the market keyword associated with the report is "Canned Food Market," which aids in identifying and referencing the specific market segment covered.
12. How do I determine which pricing option suits my needs best?
The pricing options vary based on user requirements and access needs. Individual users may opt for single-user licenses, while businesses requiring broader access may choose multi-user or enterprise licenses for cost-effective access to the report.
13. Are there any additional resources or data provided in the Canned Food Market report?
While the report offers comprehensive insights, it's advisable to review the specific contents or supplementary materials provided to ascertain if additional resources or data are available.
14. How can I stay updated on further developments or reports in the Canned Food Market?
To stay informed about further developments, trends, and reports in the Canned Food Market, consider subscribing to industry newsletters, following relevant companies and organizations, or regularly checking reputable industry news sources and publications.
Methodology
Step 1 - Identification of Relevant Samples Size from Population Database


Step 2 - Approaches for Defining Global Market Size (Value, Volume* & Price*)

Note*: In applicable scenarios
Step 3 - Data Sources
Primary Research
- Web Analytics
- Survey Reports
- Research Institute
- Latest Research Reports
- Opinion Leaders
Secondary Research
- Annual Reports
- White Paper
- Latest Press Release
- Industry Association
- Paid Database
- Investor Presentations

Step 4 - Data Triangulation
Involves using different sources of information in order to increase the validity of a study
These sources are likely to be stakeholders in a program - participants, other researchers, program staff, other community members, and so on.
Then we put all data in single framework & apply various statistical tools to find out the dynamic on the market.
During the analysis stage, feedback from the stakeholder groups would be compared to determine areas of agreement as well as areas of divergence


