
Key Insights
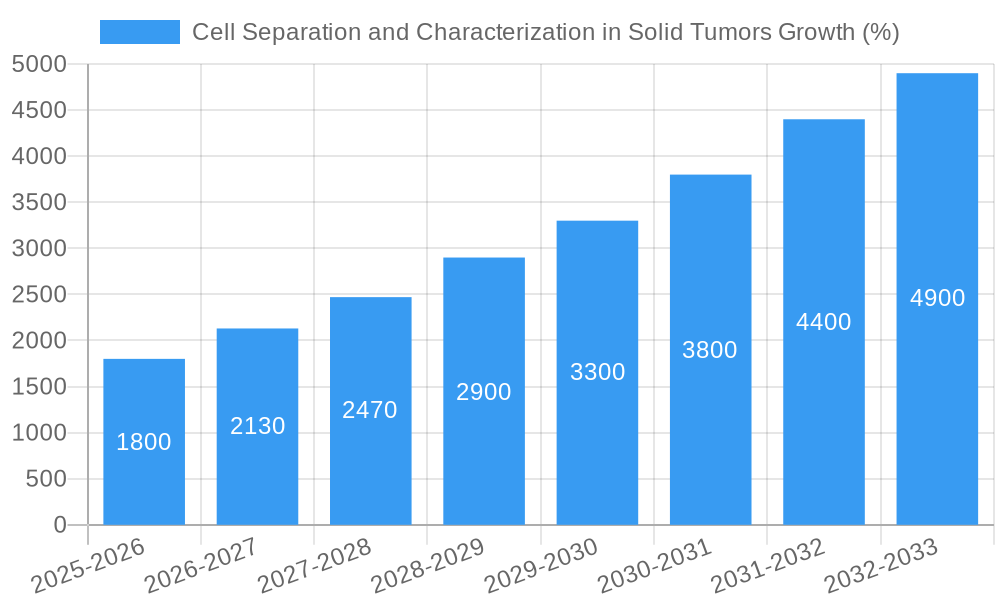
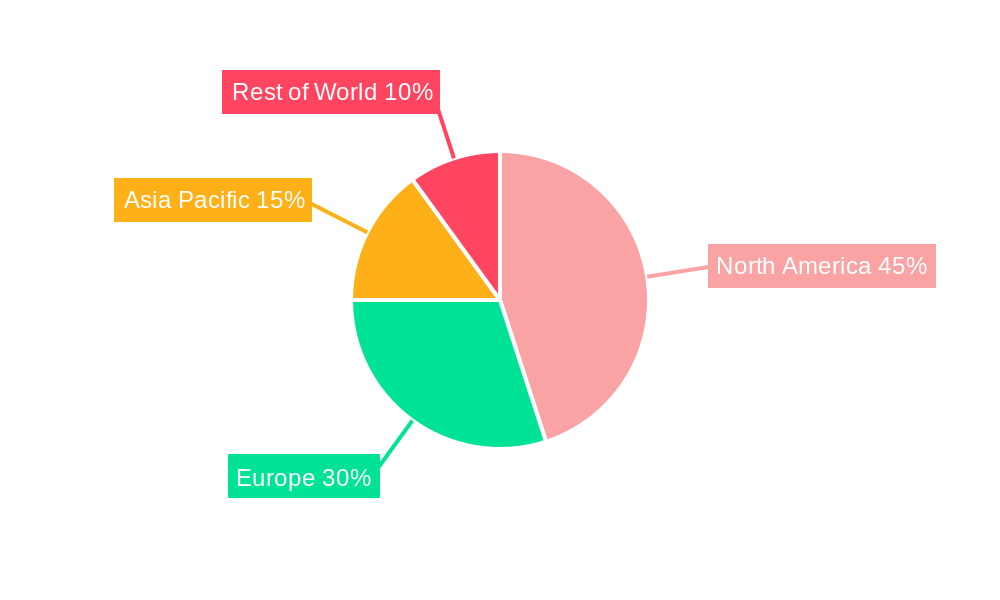
The global market for cell separation and characterization in solid tumors is experiencing robust growth, driven by the increasing prevalence of cancer, advancements in research techniques, and the rising demand for personalized medicine. The market's compound annual growth rate (CAGR) is estimated to be around 15% between 2025 and 2033, propelled by factors such as the development of novel cancer therapies tailored to specific tumor types and the increasing adoption of advanced cell separation and characterization technologies. Key players like AbbVie, AstraZeneca, Illumina, and Thermo Fisher Scientific are actively investing in research and development, leading to innovative solutions that improve the accuracy and efficiency of tumor cell analysis. This allows for better diagnostics, more effective treatment strategies, and improved patient outcomes. The market segmentation is largely driven by the specific technology employed (e.g., flow cytometry, microfluidics, laser capture microdissection), with flow cytometry currently holding a significant market share due to its established track record and wide accessibility. However, advancements in microfluidics and other emerging techniques are expected to fuel significant growth in these segments over the forecast period. Geographic regions such as North America and Europe currently dominate the market, owing to advanced healthcare infrastructure and strong research funding. However, growth in Asia-Pacific is expected to accelerate significantly due to increasing healthcare spending and a growing awareness of advanced diagnostic techniques in these regions.
Market restraints include the high cost of advanced technologies and specialized expertise needed for accurate cell separation and characterization. Regulatory hurdles related to the approval and adoption of new technologies also pose a challenge to market expansion. Despite these challenges, the considerable unmet clinical needs within oncology and the potential for improved treatment outcomes will continue to drive investment and innovation, pushing the market toward sustained growth in the coming years. The focus on liquid biopsies and minimally invasive procedures further contributes to this upward trajectory, reducing the need for extensive surgical interventions. This market is primed for disruptive innovation, with advancements in artificial intelligence and machine learning poised to improve automation and data analysis, further accelerating growth in the years to come.

Cell Separation and Characterization in Solid Tumors: Market Analysis & Forecast (2019-2033)
This comprehensive report provides a detailed analysis of the global Cell Separation and Characterization in Solid Tumors market, offering invaluable insights for industry professionals, investors, and researchers. The study period spans from 2019 to 2033, with a base year of 2025 and a forecast period from 2025 to 2033. The report leverages extensive market data to illuminate growth trajectories, emerging trends, and competitive dynamics within this rapidly evolving sector. Key players such as AbbVie, Abcodia, AstraZeneca, Illumina, Merck, Miltenyi Biotech, Pfizer, and Thermo Fisher Scientific are analyzed, providing a granular understanding of market share, innovation strategies, and future prospects. The report projects a market valued at $xx million in 2025, exhibiting a CAGR of xx% during the forecast period.
Cell Separation and Characterization in Solid Tumors Market Structure & Innovation Trends
The global Cell Separation and Characterization in Solid Tumors market exhibits a moderately concentrated structure, with a few key players holding significant market share. AbbVie, Illumina, and Thermo Fisher Scientific are among the leading companies, collectively accounting for an estimated xx% of the market in 2025. However, the market also features a number of smaller, specialized players driving innovation and competition.
- Market Concentration: High concentration in the segment with xx million revenue from top 5 players in 2025.
- Innovation Drivers: Advancements in technologies like microfluidics, flow cytometry, and single-cell genomics are major drivers. Regulatory approvals for novel cell separation and characterization techniques are also crucial.
- Regulatory Frameworks: Stringent regulatory requirements, particularly in the development and approval of new therapies, impact market growth. Variations in regulatory landscapes across different countries add complexity.
- Product Substitutes: While limited direct substitutes exist, the development of alternative approaches for tumor analysis could potentially impact market growth.
- M&A Activity: The market has witnessed significant M&A activity in recent years, with deals valued at approximately $xx million in the historical period (2019-2024). This consolidates market share and accelerates innovation.
Cell Separation and Characterization in Solid Tumors Market Dynamics & Trends
The Cell Separation and Characterization in Solid Tumors market is experiencing robust growth, driven primarily by the increasing prevalence of solid tumors globally, advancements in personalized medicine, and the growing demand for more effective cancer therapies. The rising adoption of advanced diagnostic techniques, including liquid biopsies, significantly contributes to market expansion. Technological disruptions, such as the introduction of next-generation sequencing technologies and AI-powered analysis tools, are reshaping the landscape. The market penetration of advanced cell separation techniques is increasing at an accelerated rate, with a projected xx% increase in the next 5 years. Competitive dynamics are characterized by both intense rivalry among established players and the emergence of innovative startups. This competitive pressure fosters continuous innovation and improves the accessibility and affordability of these technologies. The overall market growth is influenced by a complex interplay of factors, resulting in a compound annual growth rate (CAGR) of xx% from 2025-2033.
Dominant Regions & Segments in Cell Separation and Characterization in Solid Tumors
North America currently dominates the Cell Separation and Characterization in Solid Tumors market, driven by factors such as:
- Robust Healthcare Infrastructure: Extensive research and development facilities, advanced healthcare infrastructure, and high healthcare expenditure contribute significantly.
- Early Adoption of Novel Technologies: North America shows a high rate of adoption for advanced cell separation technologies due to high awareness among clinicians and researchers.
- Strong Regulatory Support: Favourable regulatory environment and funding opportunities promote technological development and market growth.
While North America leads, Europe and Asia Pacific are also exhibiting strong growth potential, fuelled by increasing investments in healthcare infrastructure and a growing prevalence of solid tumors. Specific countries such as Germany, Japan, and China are experiencing particularly rapid growth in this segment.
Cell Separation and Characterization in Solid Tumors Product Innovations
Recent years have witnessed significant advancements in cell separation and characterization technologies, including the development of high-throughput platforms, improved cell sorting techniques, and the integration of advanced analytical tools. These innovations enable more precise characterization of tumor cells, facilitating personalized medicine approaches and contributing to improved cancer treatment outcomes. Microfluidic devices are gaining significant traction due to their ability to process large volumes of samples with high efficiency and precision.
Report Scope & Segmentation Analysis
This report provides a detailed segmentation of the Cell Separation and Characterization in Solid Tumors market based on technology (e.g., flow cytometry, magnetic cell sorting, microfluidics), application (e.g., diagnostics, research, therapeutics), and end-user (e.g., hospitals, research institutions, pharmaceutical companies). Each segment's growth projections, market size, and competitive dynamics are analyzed, providing a comprehensive understanding of the market structure and potential growth opportunities. The market size for each segment will reach xx million by 2033.
Key Drivers of Cell Separation and Characterization in Solid Tumors Growth
The growth of the Cell Separation and Characterization in Solid Tumors market is driven by several factors including:
- Technological Advancements: Continuous innovations in cell separation and characterization techniques, such as microfluidics and single-cell analysis, improve efficiency and precision.
- Rise of Personalized Medicine: The increasing adoption of personalized medicine approaches necessitates precise characterization of tumor cells for targeted therapies.
- Increased Cancer Prevalence: The rising incidence of solid tumors globally fuels the demand for advanced diagnostic and therapeutic tools.
Challenges in the Cell Separation and Characterization in Solid Tumors Sector
Several challenges hinder the growth of the Cell Separation and Characterization in Solid Tumors market:
- High Costs of Technologies: The high cost of advanced technologies limits their accessibility, particularly in resource-constrained settings.
- Complex Regulatory Processes: Stringent regulatory requirements increase the time and cost associated with bringing new products to market.
- Data Analysis Complexity: Analyzing the large amounts of data generated by advanced technologies requires sophisticated bioinformatics tools and expertise.
Emerging Opportunities in Cell Separation and Characterization in Solid Tumors
The Cell Separation and Characterization in Solid Tumors market presents several emerging opportunities, including:
- Liquid Biopsies: Liquid biopsy technology offers a minimally invasive approach to tumor analysis, opening up new possibilities for early detection and monitoring of cancer.
- Artificial Intelligence (AI): The integration of AI and machine learning into data analysis improves the speed and accuracy of tumor cell characterization.
- Expansion into Emerging Markets: Developing countries present a significant untapped market for affordable and accessible cell separation and characterization technologies.
Leading Players in the Cell Separation and Characterization in Solid Tumors Market
Key Developments in Cell Separation and Characterization in Solid Tumors Industry
- January 2023: Company X launches a new microfluidic device for high-throughput cell separation.
- June 2022: Company Y receives FDA approval for a novel cell characterization assay.
- October 2021: Company Z announces a strategic partnership to develop AI-powered diagnostic tools. (Note: Specific examples require access to a database of industry news and developments. This is illustrative only.)
Future Outlook for Cell Separation and Characterization in Solid Tumors Market
The future outlook for the Cell Separation and Characterization in Solid Tumors market is exceptionally promising. Continuous technological innovation, increasing adoption of personalized medicine, and the growing prevalence of solid tumors will fuel market expansion. Strategic partnerships, mergers and acquisitions, and the development of novel diagnostic and therapeutic applications will further drive growth and shape the competitive landscape in the coming years. The market is poised for significant expansion, with substantial opportunities for innovation and market penetration.
Cell Separation and Characterization in Solid Tumors Segmentation
-
1. Application
- 1.1. Diagnostics and Testing Laboratories
- 1.2. Academic and Research Organizations
- 1.3. Others
-
2. Types
- 2.1. Fluorescence-Activated Cell Sorting
- 2.2. Magnet-Activated Cell Sorting
- 2.3. Density Gradient Centrifugation
- 2.4. Dielectrophoretic
- 2.5. Aqueous Two-Phase System
- 2.6. Field Flow Fractionation
Cell Separation and Characterization in Solid Tumors Segmentation By Geography
-
1. North America
- 1.1. United States
- 1.2. Canada
- 1.3. Mexico
-
2. South America
- 2.1. Brazil
- 2.2. Argentina
- 2.3. Rest of South America
-
3. Europe
- 3.1. United Kingdom
- 3.2. Germany
- 3.3. France
- 3.4. Italy
- 3.5. Spain
- 3.6. Russia
- 3.7. Benelux
- 3.8. Nordics
- 3.9. Rest of Europe
-
4. Middle East & Africa
- 4.1. Turkey
- 4.2. Israel
- 4.3. GCC
- 4.4. North Africa
- 4.5. South Africa
- 4.6. Rest of Middle East & Africa
-
5. Asia Pacific
- 5.1. China
- 5.2. India
- 5.3. Japan
- 5.4. South Korea
- 5.5. ASEAN
- 5.6. Oceania
- 5.7. Rest of Asia Pacific
Cell Separation and Characterization in Solid Tumors REPORT HIGHLIGHTS
| Aspects | Details |
|---|---|
| Study Period | 2019-2033 |
| Base Year | 2024 |
| Estimated Year | 2025 |
| Forecast Period | 2025-2033 |
| Historical Period | 2019-2024 |
| Growth Rate | CAGR of XX% from 2019-2033 |
| Segmentation |
|
Table of Contents
- 1. Introduction
- 1.1. Research Scope
- 1.2. Market Segmentation
- 1.3. Research Methodology
- 1.4. Definitions and Assumptions
- 2. Executive Summary
- 2.1. Introduction
- 3. Market Dynamics
- 3.1. Introduction
- 3.2. Market Drivers
- 3.3. Market Restrains
- 3.4. Market Trends
- 4. Market Factor Analysis
- 4.1. Porters Five Forces
- 4.2. Supply/Value Chain
- 4.3. PESTEL analysis
- 4.4. Market Entropy
- 4.5. Patent/Trademark Analysis
- 5. Global Cell Separation and Characterization in Solid Tumors Analysis, Insights and Forecast, 2019-2031
- 5.1. Market Analysis, Insights and Forecast - by Application
- 5.1.1. Diagnostics and Testing Laboratories
- 5.1.2. Academic and Research Organizations
- 5.1.3. Others
- 5.2. Market Analysis, Insights and Forecast - by Types
- 5.2.1. Fluorescence-Activated Cell Sorting
- 5.2.2. Magnet-Activated Cell Sorting
- 5.2.3. Density Gradient Centrifugation
- 5.2.4. Dielectrophoretic
- 5.2.5. Aqueous Two-Phase System
- 5.2.6. Field Flow Fractionation
- 5.3. Market Analysis, Insights and Forecast - by Region
- 5.3.1. North America
- 5.3.2. South America
- 5.3.3. Europe
- 5.3.4. Middle East & Africa
- 5.3.5. Asia Pacific
- 5.1. Market Analysis, Insights and Forecast - by Application
- 6. North America Cell Separation and Characterization in Solid Tumors Analysis, Insights and Forecast, 2019-2031
- 6.1. Market Analysis, Insights and Forecast - by Application
- 6.1.1. Diagnostics and Testing Laboratories
- 6.1.2. Academic and Research Organizations
- 6.1.3. Others
- 6.2. Market Analysis, Insights and Forecast - by Types
- 6.2.1. Fluorescence-Activated Cell Sorting
- 6.2.2. Magnet-Activated Cell Sorting
- 6.2.3. Density Gradient Centrifugation
- 6.2.4. Dielectrophoretic
- 6.2.5. Aqueous Two-Phase System
- 6.2.6. Field Flow Fractionation
- 6.1. Market Analysis, Insights and Forecast - by Application
- 7. South America Cell Separation and Characterization in Solid Tumors Analysis, Insights and Forecast, 2019-2031
- 7.1. Market Analysis, Insights and Forecast - by Application
- 7.1.1. Diagnostics and Testing Laboratories
- 7.1.2. Academic and Research Organizations
- 7.1.3. Others
- 7.2. Market Analysis, Insights and Forecast - by Types
- 7.2.1. Fluorescence-Activated Cell Sorting
- 7.2.2. Magnet-Activated Cell Sorting
- 7.2.3. Density Gradient Centrifugation
- 7.2.4. Dielectrophoretic
- 7.2.5. Aqueous Two-Phase System
- 7.2.6. Field Flow Fractionation
- 7.1. Market Analysis, Insights and Forecast - by Application
- 8. Europe Cell Separation and Characterization in Solid Tumors Analysis, Insights and Forecast, 2019-2031
- 8.1. Market Analysis, Insights and Forecast - by Application
- 8.1.1. Diagnostics and Testing Laboratories
- 8.1.2. Academic and Research Organizations
- 8.1.3. Others
- 8.2. Market Analysis, Insights and Forecast - by Types
- 8.2.1. Fluorescence-Activated Cell Sorting
- 8.2.2. Magnet-Activated Cell Sorting
- 8.2.3. Density Gradient Centrifugation
- 8.2.4. Dielectrophoretic
- 8.2.5. Aqueous Two-Phase System
- 8.2.6. Field Flow Fractionation
- 8.1. Market Analysis, Insights and Forecast - by Application
- 9. Middle East & Africa Cell Separation and Characterization in Solid Tumors Analysis, Insights and Forecast, 2019-2031
- 9.1. Market Analysis, Insights and Forecast - by Application
- 9.1.1. Diagnostics and Testing Laboratories
- 9.1.2. Academic and Research Organizations
- 9.1.3. Others
- 9.2. Market Analysis, Insights and Forecast - by Types
- 9.2.1. Fluorescence-Activated Cell Sorting
- 9.2.2. Magnet-Activated Cell Sorting
- 9.2.3. Density Gradient Centrifugation
- 9.2.4. Dielectrophoretic
- 9.2.5. Aqueous Two-Phase System
- 9.2.6. Field Flow Fractionation
- 9.1. Market Analysis, Insights and Forecast - by Application
- 10. Asia Pacific Cell Separation and Characterization in Solid Tumors Analysis, Insights and Forecast, 2019-2031
- 10.1. Market Analysis, Insights and Forecast - by Application
- 10.1.1. Diagnostics and Testing Laboratories
- 10.1.2. Academic and Research Organizations
- 10.1.3. Others
- 10.2. Market Analysis, Insights and Forecast - by Types
- 10.2.1. Fluorescence-Activated Cell Sorting
- 10.2.2. Magnet-Activated Cell Sorting
- 10.2.3. Density Gradient Centrifugation
- 10.2.4. Dielectrophoretic
- 10.2.5. Aqueous Two-Phase System
- 10.2.6. Field Flow Fractionation
- 10.1. Market Analysis, Insights and Forecast - by Application
- 11. Competitive Analysis
- 11.1. Global Market Share Analysis 2024
- 11.2. Company Profiles
- 11.2.1 AbbVie
- 11.2.1.1. Overview
- 11.2.1.2. Products
- 11.2.1.3. SWOT Analysis
- 11.2.1.4. Recent Developments
- 11.2.1.5. Financials (Based on Availability)
- 11.2.2 Abcodia
- 11.2.2.1. Overview
- 11.2.2.2. Products
- 11.2.2.3. SWOT Analysis
- 11.2.2.4. Recent Developments
- 11.2.2.5. Financials (Based on Availability)
- 11.2.3 AstraZeneca
- 11.2.3.1. Overview
- 11.2.3.2. Products
- 11.2.3.3. SWOT Analysis
- 11.2.3.4. Recent Developments
- 11.2.3.5. Financials (Based on Availability)
- 11.2.4 Illumina
- 11.2.4.1. Overview
- 11.2.4.2. Products
- 11.2.4.3. SWOT Analysis
- 11.2.4.4. Recent Developments
- 11.2.4.5. Financials (Based on Availability)
- 11.2.5 Merck
- 11.2.5.1. Overview
- 11.2.5.2. Products
- 11.2.5.3. SWOT Analysis
- 11.2.5.4. Recent Developments
- 11.2.5.5. Financials (Based on Availability)
- 11.2.6 Miltenyi Biotech
- 11.2.6.1. Overview
- 11.2.6.2. Products
- 11.2.6.3. SWOT Analysis
- 11.2.6.4. Recent Developments
- 11.2.6.5. Financials (Based on Availability)
- 11.2.7 Pfizer
- 11.2.7.1. Overview
- 11.2.7.2. Products
- 11.2.7.3. SWOT Analysis
- 11.2.7.4. Recent Developments
- 11.2.7.5. Financials (Based on Availability)
- 11.2.8 Thermo Fisher Scientific
- 11.2.8.1. Overview
- 11.2.8.2. Products
- 11.2.8.3. SWOT Analysis
- 11.2.8.4. Recent Developments
- 11.2.8.5. Financials (Based on Availability)
- 11.2.1 AbbVie
List of Figures
- Figure 1: Global Cell Separation and Characterization in Solid Tumors Revenue Breakdown (million, %) by Region 2024 & 2032
- Figure 2: North America Cell Separation and Characterization in Solid Tumors Revenue (million), by Application 2024 & 2032
- Figure 3: North America Cell Separation and Characterization in Solid Tumors Revenue Share (%), by Application 2024 & 2032
- Figure 4: North America Cell Separation and Characterization in Solid Tumors Revenue (million), by Types 2024 & 2032
- Figure 5: North America Cell Separation and Characterization in Solid Tumors Revenue Share (%), by Types 2024 & 2032
- Figure 6: North America Cell Separation and Characterization in Solid Tumors Revenue (million), by Country 2024 & 2032
- Figure 7: North America Cell Separation and Characterization in Solid Tumors Revenue Share (%), by Country 2024 & 2032
- Figure 8: South America Cell Separation and Characterization in Solid Tumors Revenue (million), by Application 2024 & 2032
- Figure 9: South America Cell Separation and Characterization in Solid Tumors Revenue Share (%), by Application 2024 & 2032
- Figure 10: South America Cell Separation and Characterization in Solid Tumors Revenue (million), by Types 2024 & 2032
- Figure 11: South America Cell Separation and Characterization in Solid Tumors Revenue Share (%), by Types 2024 & 2032
- Figure 12: South America Cell Separation and Characterization in Solid Tumors Revenue (million), by Country 2024 & 2032
- Figure 13: South America Cell Separation and Characterization in Solid Tumors Revenue Share (%), by Country 2024 & 2032
- Figure 14: Europe Cell Separation and Characterization in Solid Tumors Revenue (million), by Application 2024 & 2032
- Figure 15: Europe Cell Separation and Characterization in Solid Tumors Revenue Share (%), by Application 2024 & 2032
- Figure 16: Europe Cell Separation and Characterization in Solid Tumors Revenue (million), by Types 2024 & 2032
- Figure 17: Europe Cell Separation and Characterization in Solid Tumors Revenue Share (%), by Types 2024 & 2032
- Figure 18: Europe Cell Separation and Characterization in Solid Tumors Revenue (million), by Country 2024 & 2032
- Figure 19: Europe Cell Separation and Characterization in Solid Tumors Revenue Share (%), by Country 2024 & 2032
- Figure 20: Middle East & Africa Cell Separation and Characterization in Solid Tumors Revenue (million), by Application 2024 & 2032
- Figure 21: Middle East & Africa Cell Separation and Characterization in Solid Tumors Revenue Share (%), by Application 2024 & 2032
- Figure 22: Middle East & Africa Cell Separation and Characterization in Solid Tumors Revenue (million), by Types 2024 & 2032
- Figure 23: Middle East & Africa Cell Separation and Characterization in Solid Tumors Revenue Share (%), by Types 2024 & 2032
- Figure 24: Middle East & Africa Cell Separation and Characterization in Solid Tumors Revenue (million), by Country 2024 & 2032
- Figure 25: Middle East & Africa Cell Separation and Characterization in Solid Tumors Revenue Share (%), by Country 2024 & 2032
- Figure 26: Asia Pacific Cell Separation and Characterization in Solid Tumors Revenue (million), by Application 2024 & 2032
- Figure 27: Asia Pacific Cell Separation and Characterization in Solid Tumors Revenue Share (%), by Application 2024 & 2032
- Figure 28: Asia Pacific Cell Separation and Characterization in Solid Tumors Revenue (million), by Types 2024 & 2032
- Figure 29: Asia Pacific Cell Separation and Characterization in Solid Tumors Revenue Share (%), by Types 2024 & 2032
- Figure 30: Asia Pacific Cell Separation and Characterization in Solid Tumors Revenue (million), by Country 2024 & 2032
- Figure 31: Asia Pacific Cell Separation and Characterization in Solid Tumors Revenue Share (%), by Country 2024 & 2032
List of Tables
- Table 1: Global Cell Separation and Characterization in Solid Tumors Revenue million Forecast, by Region 2019 & 2032
- Table 2: Global Cell Separation and Characterization in Solid Tumors Revenue million Forecast, by Application 2019 & 2032
- Table 3: Global Cell Separation and Characterization in Solid Tumors Revenue million Forecast, by Types 2019 & 2032
- Table 4: Global Cell Separation and Characterization in Solid Tumors Revenue million Forecast, by Region 2019 & 2032
- Table 5: Global Cell Separation and Characterization in Solid Tumors Revenue million Forecast, by Application 2019 & 2032
- Table 6: Global Cell Separation and Characterization in Solid Tumors Revenue million Forecast, by Types 2019 & 2032
- Table 7: Global Cell Separation and Characterization in Solid Tumors Revenue million Forecast, by Country 2019 & 2032
- Table 8: United States Cell Separation and Characterization in Solid Tumors Revenue (million) Forecast, by Application 2019 & 2032
- Table 9: Canada Cell Separation and Characterization in Solid Tumors Revenue (million) Forecast, by Application 2019 & 2032
- Table 10: Mexico Cell Separation and Characterization in Solid Tumors Revenue (million) Forecast, by Application 2019 & 2032
- Table 11: Global Cell Separation and Characterization in Solid Tumors Revenue million Forecast, by Application 2019 & 2032
- Table 12: Global Cell Separation and Characterization in Solid Tumors Revenue million Forecast, by Types 2019 & 2032
- Table 13: Global Cell Separation and Characterization in Solid Tumors Revenue million Forecast, by Country 2019 & 2032
- Table 14: Brazil Cell Separation and Characterization in Solid Tumors Revenue (million) Forecast, by Application 2019 & 2032
- Table 15: Argentina Cell Separation and Characterization in Solid Tumors Revenue (million) Forecast, by Application 2019 & 2032
- Table 16: Rest of South America Cell Separation and Characterization in Solid Tumors Revenue (million) Forecast, by Application 2019 & 2032
- Table 17: Global Cell Separation and Characterization in Solid Tumors Revenue million Forecast, by Application 2019 & 2032
- Table 18: Global Cell Separation and Characterization in Solid Tumors Revenue million Forecast, by Types 2019 & 2032
- Table 19: Global Cell Separation and Characterization in Solid Tumors Revenue million Forecast, by Country 2019 & 2032
- Table 20: United Kingdom Cell Separation and Characterization in Solid Tumors Revenue (million) Forecast, by Application 2019 & 2032
- Table 21: Germany Cell Separation and Characterization in Solid Tumors Revenue (million) Forecast, by Application 2019 & 2032
- Table 22: France Cell Separation and Characterization in Solid Tumors Revenue (million) Forecast, by Application 2019 & 2032
- Table 23: Italy Cell Separation and Characterization in Solid Tumors Revenue (million) Forecast, by Application 2019 & 2032
- Table 24: Spain Cell Separation and Characterization in Solid Tumors Revenue (million) Forecast, by Application 2019 & 2032
- Table 25: Russia Cell Separation and Characterization in Solid Tumors Revenue (million) Forecast, by Application 2019 & 2032
- Table 26: Benelux Cell Separation and Characterization in Solid Tumors Revenue (million) Forecast, by Application 2019 & 2032
- Table 27: Nordics Cell Separation and Characterization in Solid Tumors Revenue (million) Forecast, by Application 2019 & 2032
- Table 28: Rest of Europe Cell Separation and Characterization in Solid Tumors Revenue (million) Forecast, by Application 2019 & 2032
- Table 29: Global Cell Separation and Characterization in Solid Tumors Revenue million Forecast, by Application 2019 & 2032
- Table 30: Global Cell Separation and Characterization in Solid Tumors Revenue million Forecast, by Types 2019 & 2032
- Table 31: Global Cell Separation and Characterization in Solid Tumors Revenue million Forecast, by Country 2019 & 2032
- Table 32: Turkey Cell Separation and Characterization in Solid Tumors Revenue (million) Forecast, by Application 2019 & 2032
- Table 33: Israel Cell Separation and Characterization in Solid Tumors Revenue (million) Forecast, by Application 2019 & 2032
- Table 34: GCC Cell Separation and Characterization in Solid Tumors Revenue (million) Forecast, by Application 2019 & 2032
- Table 35: North Africa Cell Separation and Characterization in Solid Tumors Revenue (million) Forecast, by Application 2019 & 2032
- Table 36: South Africa Cell Separation and Characterization in Solid Tumors Revenue (million) Forecast, by Application 2019 & 2032
- Table 37: Rest of Middle East & Africa Cell Separation and Characterization in Solid Tumors Revenue (million) Forecast, by Application 2019 & 2032
- Table 38: Global Cell Separation and Characterization in Solid Tumors Revenue million Forecast, by Application 2019 & 2032
- Table 39: Global Cell Separation and Characterization in Solid Tumors Revenue million Forecast, by Types 2019 & 2032
- Table 40: Global Cell Separation and Characterization in Solid Tumors Revenue million Forecast, by Country 2019 & 2032
- Table 41: China Cell Separation and Characterization in Solid Tumors Revenue (million) Forecast, by Application 2019 & 2032
- Table 42: India Cell Separation and Characterization in Solid Tumors Revenue (million) Forecast, by Application 2019 & 2032
- Table 43: Japan Cell Separation and Characterization in Solid Tumors Revenue (million) Forecast, by Application 2019 & 2032
- Table 44: South Korea Cell Separation and Characterization in Solid Tumors Revenue (million) Forecast, by Application 2019 & 2032
- Table 45: ASEAN Cell Separation and Characterization in Solid Tumors Revenue (million) Forecast, by Application 2019 & 2032
- Table 46: Oceania Cell Separation and Characterization in Solid Tumors Revenue (million) Forecast, by Application 2019 & 2032
- Table 47: Rest of Asia Pacific Cell Separation and Characterization in Solid Tumors Revenue (million) Forecast, by Application 2019 & 2032
Frequently Asked Questions
1. What is the projected Compound Annual Growth Rate (CAGR) of the Cell Separation and Characterization in Solid Tumors?
The projected CAGR is approximately XX%.
2. Which companies are prominent players in the Cell Separation and Characterization in Solid Tumors?
Key companies in the market include AbbVie, Abcodia, AstraZeneca, Illumina, Merck, Miltenyi Biotech, Pfizer, Thermo Fisher Scientific.
3. What are the main segments of the Cell Separation and Characterization in Solid Tumors?
The market segments include Application, Types.
4. Can you provide details about the market size?
The market size is estimated to be USD XXX million as of 2022.
5. What are some drivers contributing to market growth?
N/A
6. What are the notable trends driving market growth?
N/A
7. Are there any restraints impacting market growth?
N/A
8. Can you provide examples of recent developments in the market?
N/A
9. What pricing options are available for accessing the report?
Pricing options include single-user, multi-user, and enterprise licenses priced at USD 2900.00, USD 4350.00, and USD 5800.00 respectively.
10. Is the market size provided in terms of value or volume?
The market size is provided in terms of value, measured in million.
11. Are there any specific market keywords associated with the report?
Yes, the market keyword associated with the report is "Cell Separation and Characterization in Solid Tumors," which aids in identifying and referencing the specific market segment covered.
12. How do I determine which pricing option suits my needs best?
The pricing options vary based on user requirements and access needs. Individual users may opt for single-user licenses, while businesses requiring broader access may choose multi-user or enterprise licenses for cost-effective access to the report.
13. Are there any additional resources or data provided in the Cell Separation and Characterization in Solid Tumors report?
While the report offers comprehensive insights, it's advisable to review the specific contents or supplementary materials provided to ascertain if additional resources or data are available.
14. How can I stay updated on further developments or reports in the Cell Separation and Characterization in Solid Tumors?
To stay informed about further developments, trends, and reports in the Cell Separation and Characterization in Solid Tumors, consider subscribing to industry newsletters, following relevant companies and organizations, or regularly checking reputable industry news sources and publications.
Methodology
Step 1 - Identification of Relevant Samples Size from Population Database


Step 2 - Approaches for Defining Global Market Size (Value, Volume* & Price*)

Note*: In applicable scenarios
Step 3 - Data Sources
Primary Research
- Web Analytics
- Survey Reports
- Research Institute
- Latest Research Reports
- Opinion Leaders
Secondary Research
- Annual Reports
- White Paper
- Latest Press Release
- Industry Association
- Paid Database
- Investor Presentations

Step 4 - Data Triangulation
Involves using different sources of information in order to increase the validity of a study
These sources are likely to be stakeholders in a program - participants, other researchers, program staff, other community members, and so on.
Then we put all data in single framework & apply various statistical tools to find out the dynamic on the market.
During the analysis stage, feedback from the stakeholder groups would be compared to determine areas of agreement as well as areas of divergence


