
Key Insights
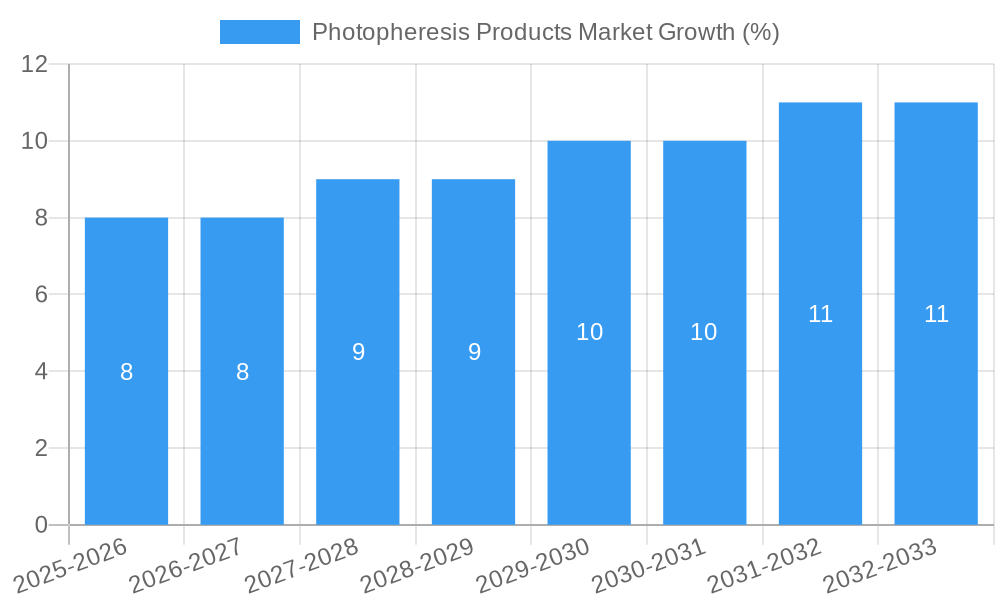
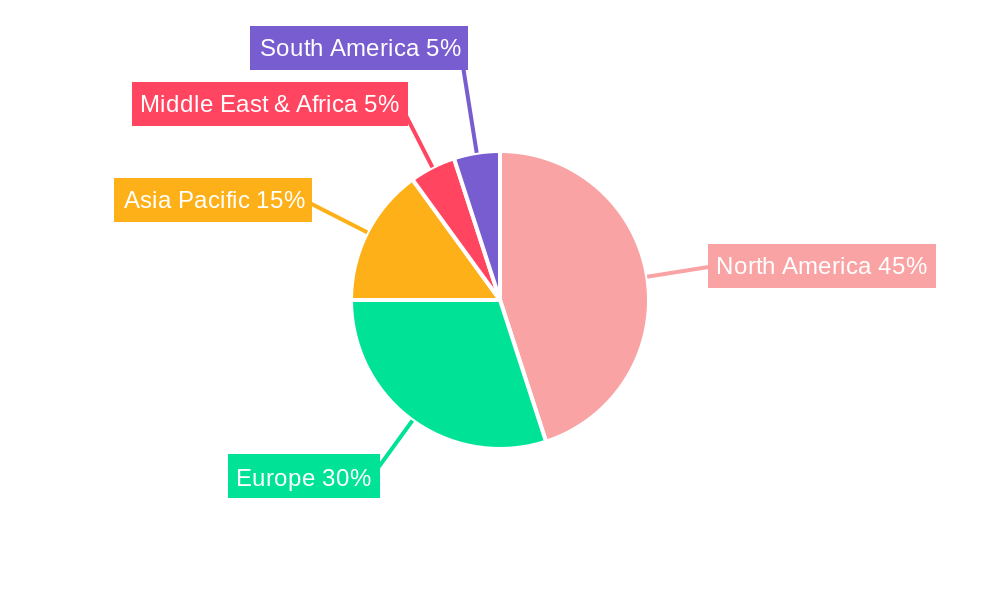
The global photopheresis products market, valued at approximately $XX million in 2025, is projected to experience robust growth, driven by a compound annual growth rate (CAGR) of 5.30% from 2025 to 2033. This expansion is fueled by several key factors. The increasing prevalence of autoimmune diseases like lupus and rheumatoid arthritis, along with a rising number of organ transplant procedures necessitating graft-versus-host disease (GvHD) prevention, significantly boosts demand for photopheresis therapies. Furthermore, advancements in photopheresis technology, leading to more efficient and less invasive procedures, contribute to market growth. The development of closed systems, offering improved safety and reduced risk of contamination, is another significant driver. The market is segmented by application (GvHD, cutaneous T-cell lymphoma, transplant rejections, autoimmune diseases), end-user (hospitals, ambulatory centers, other end-users), and product type (open and closed systems). North America currently holds a substantial market share due to high healthcare expenditure and technological advancements, but the Asia-Pacific region is expected to witness significant growth owing to rising healthcare infrastructure and increasing awareness of photopheresis therapies.
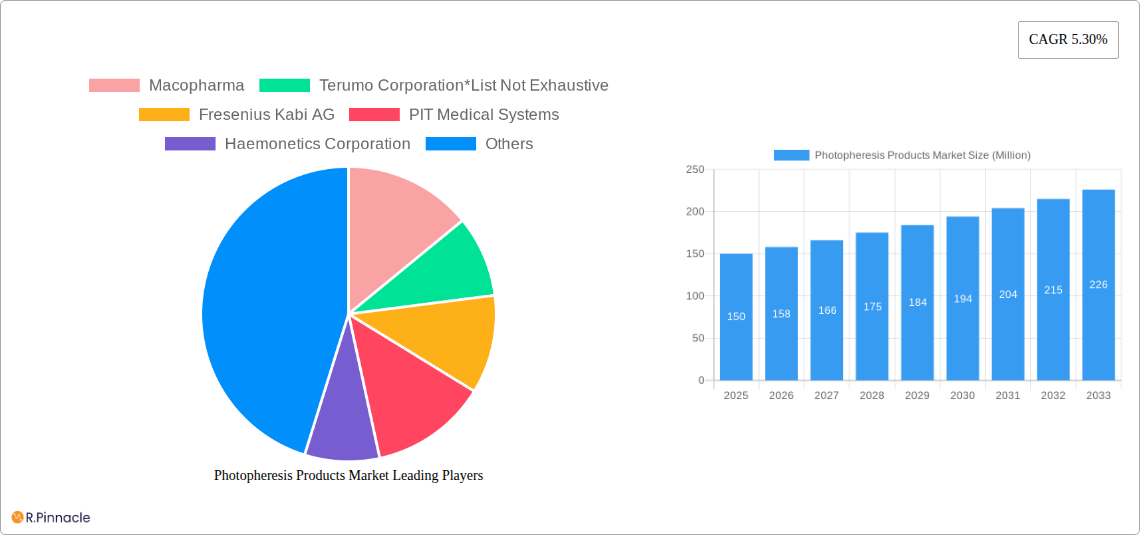
The competitive landscape comprises both established players like Macopharma, Terumo Corporation, Fresenius Kabi AG, PIT Medical Systems, Haemonetics Corporation, and Mallinckrodt Pharmaceuticals, and emerging companies focusing on innovative product development. While the market faces challenges such as high treatment costs and the availability of alternative therapies, the overall positive outlook is driven by increasing disease prevalence and technological improvements. The continued focus on research and development to enhance efficacy and accessibility of photopheresis, coupled with strategic partnerships and collaborations within the industry, is likely to further shape the market's trajectory in the coming years. Growth will likely be uneven across regions, with developed markets maintaining a steady pace while emerging economies experience faster growth as access to healthcare improves.
This comprehensive report provides a detailed analysis of the Photopheresis Products Market, offering invaluable insights for industry professionals, investors, and strategic decision-makers. With a study period spanning 2019-2033, a base year of 2025, and a forecast period of 2025-2033, this report offers a complete understanding of past performance, current market dynamics, and future growth potential. The market is segmented by application, end-user, and product type, providing a granular view of the market landscape. The report's value lies in its actionable insights, leveraging data-driven analysis to illuminate key trends and opportunities within this specialized medical technology sector. The global market size is estimated to be xx Million in 2025, projected to reach xx Million by 2033, demonstrating significant growth potential.
Photopheresis Products Market Market Structure & Innovation Trends
The Photopheresis Products Market exhibits a moderately concentrated structure, with key players such as Macopharma, Terumo Corporation, Fresenius Kabi AG, PIT Medical Systems, Haemonetics Corporation, and Mallinckrodt Pharmaceuticals holding significant market share. However, the market also includes several smaller, specialized companies. Market share dynamics are influenced by factors such as technological innovation, regulatory approvals, and strategic partnerships. Innovation is driven by the need for improved efficiency, reduced treatment times, and enhanced patient outcomes. Regulatory frameworks, particularly those related to medical device approvals and reimbursement policies, play a crucial role in shaping market growth. Product substitutes, while limited, include alternative treatment modalities for the conditions addressed by photopheresis. M&A activities in the sector are characterized by strategic acquisitions aimed at expanding product portfolios and enhancing market access. The total value of M&A deals in the last five years is estimated to be around xx Million.
- Market Concentration: Moderately Concentrated
- Innovation Drivers: Improved efficiency, reduced treatment times, enhanced patient outcomes
- Regulatory Frameworks: Significant impact on market growth, varying by region.
- Product Substitutes: Limited, but alternative treatment modalities exist.
- M&A Activity: Strategic acquisitions driving market consolidation; estimated value of xx Million in the last 5 years.
Photopheresis Products Market Market Dynamics & Trends
The Photopheresis Products Market is characterized by steady growth driven by increasing prevalence of target diseases such as graft-versus-host disease (GvHD), cutaneous T-cell lymphoma (CTCL), and transplant rejections. Technological advancements, particularly in closed-system photopheresis devices, are improving treatment efficiency and safety. Consumer preferences are shifting towards minimally invasive and less time-consuming procedures. Competitive dynamics are primarily shaped by technological innovation, product differentiation, and strategic partnerships. The market is expected to experience a Compound Annual Growth Rate (CAGR) of xx% during the forecast period (2025-2033). Market penetration is expected to increase, particularly in emerging markets with growing healthcare infrastructure. The rising awareness of photopheresis as a therapeutic option further contributes to market expansion. Technological disruptions include the introduction of more automated and integrated systems, along with the development of novel light sources.
Dominant Regions & Segments in Photopheresis Products Market
The North American region currently dominates the Photopheresis Products Market, driven by high healthcare expenditure, advanced medical infrastructure, and a high prevalence of target diseases. However, markets in Europe and Asia-Pacific are expected to show significant growth in the coming years.
By Application:
- Graft versus Host Disease (GvHD): Largest segment due to high prevalence and significant treatment need.
- Cutaneous T-Cell Lymphoma (CTCL): Significant market share with increasing diagnosis rates.
- Transplant Rejections: Steady growth driven by organ transplantation procedures.
- Autoimmune Diseases: Emerging segment with expanding application.
By End-User:
- Hospitals: Major segment due to availability of specialized equipment and expertise.
- Ambulatory Centers: Growing segment with increasing adoption of outpatient procedures.
- Other End-Users: Smaller segment comprising research institutions and specialized clinics.
By Product Type:
- Closed System: Growing segment due to enhanced safety and reduced risk of contamination.
- Open System: Mature segment with established use but facing competition from closed systems.
Key Drivers by Region:
- North America: High healthcare spending, well-established healthcare infrastructure.
- Europe: Growing adoption of advanced therapies, robust regulatory frameworks.
- Asia-Pacific: Increasing healthcare expenditure, rising prevalence of target diseases, emerging markets offering high growth potential.
Photopheresis Products Market Product Innovations
Recent innovations in photopheresis technology focus on developing closed systems that streamline the procedure, minimize the risk of contamination, and improve efficiency. The THERAKOS CELLEX Photopheresis System launched by Mallinckrodt Pharmaceuticals in Australia is an example of this trend. These advancements cater to the growing demand for safer, more convenient, and effective photopheresis treatments, which enhances patient outcomes and improves market fit.
Report Scope & Segmentation Analysis
This report provides a comprehensive analysis of the Photopheresis Products Market, segmented by application (GvHD, CTCL, transplant rejections, autoimmune diseases), end-user (hospitals, ambulatory centers, other end-users), and product type (open system, closed system). Each segment’s growth projections, market size, and competitive dynamics are analyzed individually. The report considers historical data from 2019 to 2024, a base year of 2025, and a forecast period extending to 2033, providing a complete overview of past trends, current market conditions, and future growth prospects.
Key Drivers of Photopheresis Products Market Growth
The Photopheresis Products Market is driven by factors such as the rising prevalence of autoimmune diseases and organ transplant procedures, advancements in photopheresis technology leading to improved efficacy and safety, and increased awareness among healthcare professionals about the benefits of photopheresis. Favorable reimbursement policies and supportive regulatory environments in developed markets also contribute significantly to market growth.
Challenges in the Photopheresis Products Market Sector
Challenges facing the Photopheresis Products Market include high equipment costs limiting accessibility, stringent regulatory requirements for medical device approvals, the need for specialized trained personnel, and the competitive landscape with various established players. These factors can affect market growth rates and require innovative solutions for wider market penetration.
Emerging Opportunities in Photopheresis Products Market
Emerging opportunities include the expansion into emerging markets with growing healthcare infrastructure, the development of personalized photopheresis treatments, and the integration of advanced technologies such as AI for improved treatment efficacy. Furthermore, exploring new therapeutic applications for photopheresis beyond its current indications presents a significant growth avenue.
Leading Players in the Photopheresis Products Market Market
- Macopharma
- Terumo Corporation
- Fresenius Kabi AG
- PIT Medical Systems
- Haemonetics Corporation
- Mallinckrodt Pharmaceuticals
Key Developments in Photopheresis Products Market Industry
- September 2022: Opening of a new apheresis unit at Sheikh Shakhbout Medical City (SSMC) in the UAE, expanding treatment access for diseases including rare lymphoma.
- August 2022: Launch of the THERAKOS CELLEX Photopheresis System by Ikaria Australia Pty Ltd (Mallinckrodt Pharmaceuticals) in the Australian market, introducing a closed-system photopheresis device.
Future Outlook for Photopheresis Products Market Market
The Photopheresis Products Market is poised for substantial growth in the coming years, driven by technological innovations, expanding applications, and increasing demand in both developed and emerging markets. Strategic partnerships, product diversification, and focused R&D efforts will be crucial for companies aiming to capitalize on the market's potential. The consistent increase in prevalence of target diseases guarantees continuous demand for efficient and safe photopheresis procedures.
Photopheresis Products Market Segmentation
-
1. Product Type
- 1.1. Open System
- 1.2. Closed System
-
2. Application
- 2.1. Graft versus Host Disease
- 2.2. Cutaneous T-Cell Lymphoma
- 2.3. Transplant Rejections
- 2.4. Autoimmune Diseases
-
3. End User
- 3.1. Hospitals
- 3.2. Ambulatory Centers
- 3.3. Other End Users
Photopheresis Products Market Segmentation By Geography
-
1. North America
- 1.1. United States
- 1.2. Canada
- 1.3. Mexico
-
2. Europe
- 2.1. Germany
- 2.2. United Kingdom
- 2.3. France
- 2.4. Italy
- 2.5. Spain
- 2.6. Rest of Europe
-
3. Asia Pacific
- 3.1. China
- 3.2. Japan
- 3.3. India
- 3.4. Australia
- 3.5. South Korea
- 3.6. Rest of Asia Pacific
-
4. Middle East and Africa
- 4.1. GCC
- 4.2. South Africa
- 4.3. Rest of Middle East and Africa
-
5. South America
- 5.1. Brazil
- 5.2. Argentina
- 5.3. Rest of South America
Photopheresis Products Market REPORT HIGHLIGHTS
| Aspects | Details |
|---|---|
| Study Period | 2019-2033 |
| Base Year | 2024 |
| Estimated Year | 2025 |
| Forecast Period | 2025-2033 |
| Historical Period | 2019-2024 |
| Growth Rate | CAGR of 5.30% from 2019-2033 |
| Segmentation |
|
Table of Contents
- 1. Introduction
- 1.1. Research Scope
- 1.2. Market Segmentation
- 1.3. Research Methodology
- 1.4. Definitions and Assumptions
- 2. Executive Summary
- 2.1. Introduction
- 3. Market Dynamics
- 3.1. Introduction
- 3.2. Market Drivers
- 3.2.1. Rise in Prevalence of Autoimmune Diseases; Increasing Technological Advancements
- 3.3. Market Restrains
- 3.3.1. Low Adoption of Photopheresis in Pediatric Patients and Lack of Skilled Professionals
- 3.4. Market Trends
- 3.4.1. Chronic Graft Versus Host Disease (GvHD) is Expected to Hold a Significant Market Share in the Market Studied.
- 4. Market Factor Analysis
- 4.1. Porters Five Forces
- 4.2. Supply/Value Chain
- 4.3. PESTEL analysis
- 4.4. Market Entropy
- 4.5. Patent/Trademark Analysis
- 5. Global Photopheresis Products Market Analysis, Insights and Forecast, 2019-2031
- 5.1. Market Analysis, Insights and Forecast - by Product Type
- 5.1.1. Open System
- 5.1.2. Closed System
- 5.2. Market Analysis, Insights and Forecast - by Application
- 5.2.1. Graft versus Host Disease
- 5.2.2. Cutaneous T-Cell Lymphoma
- 5.2.3. Transplant Rejections
- 5.2.4. Autoimmune Diseases
- 5.3. Market Analysis, Insights and Forecast - by End User
- 5.3.1. Hospitals
- 5.3.2. Ambulatory Centers
- 5.3.3. Other End Users
- 5.4. Market Analysis, Insights and Forecast - by Region
- 5.4.1. North America
- 5.4.2. Europe
- 5.4.3. Asia Pacific
- 5.4.4. Middle East and Africa
- 5.4.5. South America
- 5.1. Market Analysis, Insights and Forecast - by Product Type
- 6. North America Photopheresis Products Market Analysis, Insights and Forecast, 2019-2031
- 6.1. Market Analysis, Insights and Forecast - by Product Type
- 6.1.1. Open System
- 6.1.2. Closed System
- 6.2. Market Analysis, Insights and Forecast - by Application
- 6.2.1. Graft versus Host Disease
- 6.2.2. Cutaneous T-Cell Lymphoma
- 6.2.3. Transplant Rejections
- 6.2.4. Autoimmune Diseases
- 6.3. Market Analysis, Insights and Forecast - by End User
- 6.3.1. Hospitals
- 6.3.2. Ambulatory Centers
- 6.3.3. Other End Users
- 6.1. Market Analysis, Insights and Forecast - by Product Type
- 7. Europe Photopheresis Products Market Analysis, Insights and Forecast, 2019-2031
- 7.1. Market Analysis, Insights and Forecast - by Product Type
- 7.1.1. Open System
- 7.1.2. Closed System
- 7.2. Market Analysis, Insights and Forecast - by Application
- 7.2.1. Graft versus Host Disease
- 7.2.2. Cutaneous T-Cell Lymphoma
- 7.2.3. Transplant Rejections
- 7.2.4. Autoimmune Diseases
- 7.3. Market Analysis, Insights and Forecast - by End User
- 7.3.1. Hospitals
- 7.3.2. Ambulatory Centers
- 7.3.3. Other End Users
- 7.1. Market Analysis, Insights and Forecast - by Product Type
- 8. Asia Pacific Photopheresis Products Market Analysis, Insights and Forecast, 2019-2031
- 8.1. Market Analysis, Insights and Forecast - by Product Type
- 8.1.1. Open System
- 8.1.2. Closed System
- 8.2. Market Analysis, Insights and Forecast - by Application
- 8.2.1. Graft versus Host Disease
- 8.2.2. Cutaneous T-Cell Lymphoma
- 8.2.3. Transplant Rejections
- 8.2.4. Autoimmune Diseases
- 8.3. Market Analysis, Insights and Forecast - by End User
- 8.3.1. Hospitals
- 8.3.2. Ambulatory Centers
- 8.3.3. Other End Users
- 8.1. Market Analysis, Insights and Forecast - by Product Type
- 9. Middle East and Africa Photopheresis Products Market Analysis, Insights and Forecast, 2019-2031
- 9.1. Market Analysis, Insights and Forecast - by Product Type
- 9.1.1. Open System
- 9.1.2. Closed System
- 9.2. Market Analysis, Insights and Forecast - by Application
- 9.2.1. Graft versus Host Disease
- 9.2.2. Cutaneous T-Cell Lymphoma
- 9.2.3. Transplant Rejections
- 9.2.4. Autoimmune Diseases
- 9.3. Market Analysis, Insights and Forecast - by End User
- 9.3.1. Hospitals
- 9.3.2. Ambulatory Centers
- 9.3.3. Other End Users
- 9.1. Market Analysis, Insights and Forecast - by Product Type
- 10. South America Photopheresis Products Market Analysis, Insights and Forecast, 2019-2031
- 10.1. Market Analysis, Insights and Forecast - by Product Type
- 10.1.1. Open System
- 10.1.2. Closed System
- 10.2. Market Analysis, Insights and Forecast - by Application
- 10.2.1. Graft versus Host Disease
- 10.2.2. Cutaneous T-Cell Lymphoma
- 10.2.3. Transplant Rejections
- 10.2.4. Autoimmune Diseases
- 10.3. Market Analysis, Insights and Forecast - by End User
- 10.3.1. Hospitals
- 10.3.2. Ambulatory Centers
- 10.3.3. Other End Users
- 10.1. Market Analysis, Insights and Forecast - by Product Type
- 11. North America Photopheresis Products Market Analysis, Insights and Forecast, 2019-2031
- 11.1. Market Analysis, Insights and Forecast - By Country/Sub-region
- 11.1.1 United States
- 11.1.2 Canada
- 11.1.3 Mexico
- 12. Europe Photopheresis Products Market Analysis, Insights and Forecast, 2019-2031
- 12.1. Market Analysis, Insights and Forecast - By Country/Sub-region
- 12.1.1 Germany
- 12.1.2 United Kingdom
- 12.1.3 France
- 12.1.4 Italy
- 12.1.5 Spain
- 12.1.6 Rest of Europe
- 13. Asia Pacific Photopheresis Products Market Analysis, Insights and Forecast, 2019-2031
- 13.1. Market Analysis, Insights and Forecast - By Country/Sub-region
- 13.1.1 China
- 13.1.2 Japan
- 13.1.3 India
- 13.1.4 Australia
- 13.1.5 South Korea
- 13.1.6 Rest of Asia Pacific
- 14. Middle East and Africa Photopheresis Products Market Analysis, Insights and Forecast, 2019-2031
- 14.1. Market Analysis, Insights and Forecast - By Country/Sub-region
- 14.1.1 GCC
- 14.1.2 South Africa
- 14.1.3 Rest of Middle East and Africa
- 15. South America Photopheresis Products Market Analysis, Insights and Forecast, 2019-2031
- 15.1. Market Analysis, Insights and Forecast - By Country/Sub-region
- 15.1.1 Brazil
- 15.1.2 Argentina
- 15.1.3 Rest of South America
- 16. Competitive Analysis
- 16.1. Global Market Share Analysis 2024
- 16.2. Company Profiles
- 16.2.1 Macopharma
- 16.2.1.1. Overview
- 16.2.1.2. Products
- 16.2.1.3. SWOT Analysis
- 16.2.1.4. Recent Developments
- 16.2.1.5. Financials (Based on Availability)
- 16.2.2 Terumo Corporation*List Not Exhaustive
- 16.2.2.1. Overview
- 16.2.2.2. Products
- 16.2.2.3. SWOT Analysis
- 16.2.2.4. Recent Developments
- 16.2.2.5. Financials (Based on Availability)
- 16.2.3 Fresenius Kabi AG
- 16.2.3.1. Overview
- 16.2.3.2. Products
- 16.2.3.3. SWOT Analysis
- 16.2.3.4. Recent Developments
- 16.2.3.5. Financials (Based on Availability)
- 16.2.4 PIT Medical Systems
- 16.2.4.1. Overview
- 16.2.4.2. Products
- 16.2.4.3. SWOT Analysis
- 16.2.4.4. Recent Developments
- 16.2.4.5. Financials (Based on Availability)
- 16.2.5 Haemonetics Corporation
- 16.2.5.1. Overview
- 16.2.5.2. Products
- 16.2.5.3. SWOT Analysis
- 16.2.5.4. Recent Developments
- 16.2.5.5. Financials (Based on Availability)
- 16.2.6 Mallinckrodt Pharmaceuticals
- 16.2.6.1. Overview
- 16.2.6.2. Products
- 16.2.6.3. SWOT Analysis
- 16.2.6.4. Recent Developments
- 16.2.6.5. Financials (Based on Availability)
- 16.2.1 Macopharma
List of Figures
- Figure 1: Global Photopheresis Products Market Revenue Breakdown (Million, %) by Region 2024 & 2032
- Figure 2: North America Photopheresis Products Market Revenue (Million), by Country 2024 & 2032
- Figure 3: North America Photopheresis Products Market Revenue Share (%), by Country 2024 & 2032
- Figure 4: Europe Photopheresis Products Market Revenue (Million), by Country 2024 & 2032
- Figure 5: Europe Photopheresis Products Market Revenue Share (%), by Country 2024 & 2032
- Figure 6: Asia Pacific Photopheresis Products Market Revenue (Million), by Country 2024 & 2032
- Figure 7: Asia Pacific Photopheresis Products Market Revenue Share (%), by Country 2024 & 2032
- Figure 8: Middle East and Africa Photopheresis Products Market Revenue (Million), by Country 2024 & 2032
- Figure 9: Middle East and Africa Photopheresis Products Market Revenue Share (%), by Country 2024 & 2032
- Figure 10: South America Photopheresis Products Market Revenue (Million), by Country 2024 & 2032
- Figure 11: South America Photopheresis Products Market Revenue Share (%), by Country 2024 & 2032
- Figure 12: North America Photopheresis Products Market Revenue (Million), by Product Type 2024 & 2032
- Figure 13: North America Photopheresis Products Market Revenue Share (%), by Product Type 2024 & 2032
- Figure 14: North America Photopheresis Products Market Revenue (Million), by Application 2024 & 2032
- Figure 15: North America Photopheresis Products Market Revenue Share (%), by Application 2024 & 2032
- Figure 16: North America Photopheresis Products Market Revenue (Million), by End User 2024 & 2032
- Figure 17: North America Photopheresis Products Market Revenue Share (%), by End User 2024 & 2032
- Figure 18: North America Photopheresis Products Market Revenue (Million), by Country 2024 & 2032
- Figure 19: North America Photopheresis Products Market Revenue Share (%), by Country 2024 & 2032
- Figure 20: Europe Photopheresis Products Market Revenue (Million), by Product Type 2024 & 2032
- Figure 21: Europe Photopheresis Products Market Revenue Share (%), by Product Type 2024 & 2032
- Figure 22: Europe Photopheresis Products Market Revenue (Million), by Application 2024 & 2032
- Figure 23: Europe Photopheresis Products Market Revenue Share (%), by Application 2024 & 2032
- Figure 24: Europe Photopheresis Products Market Revenue (Million), by End User 2024 & 2032
- Figure 25: Europe Photopheresis Products Market Revenue Share (%), by End User 2024 & 2032
- Figure 26: Europe Photopheresis Products Market Revenue (Million), by Country 2024 & 2032
- Figure 27: Europe Photopheresis Products Market Revenue Share (%), by Country 2024 & 2032
- Figure 28: Asia Pacific Photopheresis Products Market Revenue (Million), by Product Type 2024 & 2032
- Figure 29: Asia Pacific Photopheresis Products Market Revenue Share (%), by Product Type 2024 & 2032
- Figure 30: Asia Pacific Photopheresis Products Market Revenue (Million), by Application 2024 & 2032
- Figure 31: Asia Pacific Photopheresis Products Market Revenue Share (%), by Application 2024 & 2032
- Figure 32: Asia Pacific Photopheresis Products Market Revenue (Million), by End User 2024 & 2032
- Figure 33: Asia Pacific Photopheresis Products Market Revenue Share (%), by End User 2024 & 2032
- Figure 34: Asia Pacific Photopheresis Products Market Revenue (Million), by Country 2024 & 2032
- Figure 35: Asia Pacific Photopheresis Products Market Revenue Share (%), by Country 2024 & 2032
- Figure 36: Middle East and Africa Photopheresis Products Market Revenue (Million), by Product Type 2024 & 2032
- Figure 37: Middle East and Africa Photopheresis Products Market Revenue Share (%), by Product Type 2024 & 2032
- Figure 38: Middle East and Africa Photopheresis Products Market Revenue (Million), by Application 2024 & 2032
- Figure 39: Middle East and Africa Photopheresis Products Market Revenue Share (%), by Application 2024 & 2032
- Figure 40: Middle East and Africa Photopheresis Products Market Revenue (Million), by End User 2024 & 2032
- Figure 41: Middle East and Africa Photopheresis Products Market Revenue Share (%), by End User 2024 & 2032
- Figure 42: Middle East and Africa Photopheresis Products Market Revenue (Million), by Country 2024 & 2032
- Figure 43: Middle East and Africa Photopheresis Products Market Revenue Share (%), by Country 2024 & 2032
- Figure 44: South America Photopheresis Products Market Revenue (Million), by Product Type 2024 & 2032
- Figure 45: South America Photopheresis Products Market Revenue Share (%), by Product Type 2024 & 2032
- Figure 46: South America Photopheresis Products Market Revenue (Million), by Application 2024 & 2032
- Figure 47: South America Photopheresis Products Market Revenue Share (%), by Application 2024 & 2032
- Figure 48: South America Photopheresis Products Market Revenue (Million), by End User 2024 & 2032
- Figure 49: South America Photopheresis Products Market Revenue Share (%), by End User 2024 & 2032
- Figure 50: South America Photopheresis Products Market Revenue (Million), by Country 2024 & 2032
- Figure 51: South America Photopheresis Products Market Revenue Share (%), by Country 2024 & 2032
List of Tables
- Table 1: Global Photopheresis Products Market Revenue Million Forecast, by Region 2019 & 2032
- Table 2: Global Photopheresis Products Market Revenue Million Forecast, by Product Type 2019 & 2032
- Table 3: Global Photopheresis Products Market Revenue Million Forecast, by Application 2019 & 2032
- Table 4: Global Photopheresis Products Market Revenue Million Forecast, by End User 2019 & 2032
- Table 5: Global Photopheresis Products Market Revenue Million Forecast, by Region 2019 & 2032
- Table 6: Global Photopheresis Products Market Revenue Million Forecast, by Country 2019 & 2032
- Table 7: United States Photopheresis Products Market Revenue (Million) Forecast, by Application 2019 & 2032
- Table 8: Canada Photopheresis Products Market Revenue (Million) Forecast, by Application 2019 & 2032
- Table 9: Mexico Photopheresis Products Market Revenue (Million) Forecast, by Application 2019 & 2032
- Table 10: Global Photopheresis Products Market Revenue Million Forecast, by Country 2019 & 2032
- Table 11: Germany Photopheresis Products Market Revenue (Million) Forecast, by Application 2019 & 2032
- Table 12: United Kingdom Photopheresis Products Market Revenue (Million) Forecast, by Application 2019 & 2032
- Table 13: France Photopheresis Products Market Revenue (Million) Forecast, by Application 2019 & 2032
- Table 14: Italy Photopheresis Products Market Revenue (Million) Forecast, by Application 2019 & 2032
- Table 15: Spain Photopheresis Products Market Revenue (Million) Forecast, by Application 2019 & 2032
- Table 16: Rest of Europe Photopheresis Products Market Revenue (Million) Forecast, by Application 2019 & 2032
- Table 17: Global Photopheresis Products Market Revenue Million Forecast, by Country 2019 & 2032
- Table 18: China Photopheresis Products Market Revenue (Million) Forecast, by Application 2019 & 2032
- Table 19: Japan Photopheresis Products Market Revenue (Million) Forecast, by Application 2019 & 2032
- Table 20: India Photopheresis Products Market Revenue (Million) Forecast, by Application 2019 & 2032
- Table 21: Australia Photopheresis Products Market Revenue (Million) Forecast, by Application 2019 & 2032
- Table 22: South Korea Photopheresis Products Market Revenue (Million) Forecast, by Application 2019 & 2032
- Table 23: Rest of Asia Pacific Photopheresis Products Market Revenue (Million) Forecast, by Application 2019 & 2032
- Table 24: Global Photopheresis Products Market Revenue Million Forecast, by Country 2019 & 2032
- Table 25: GCC Photopheresis Products Market Revenue (Million) Forecast, by Application 2019 & 2032
- Table 26: South Africa Photopheresis Products Market Revenue (Million) Forecast, by Application 2019 & 2032
- Table 27: Rest of Middle East and Africa Photopheresis Products Market Revenue (Million) Forecast, by Application 2019 & 2032
- Table 28: Global Photopheresis Products Market Revenue Million Forecast, by Country 2019 & 2032
- Table 29: Brazil Photopheresis Products Market Revenue (Million) Forecast, by Application 2019 & 2032
- Table 30: Argentina Photopheresis Products Market Revenue (Million) Forecast, by Application 2019 & 2032
- Table 31: Rest of South America Photopheresis Products Market Revenue (Million) Forecast, by Application 2019 & 2032
- Table 32: Global Photopheresis Products Market Revenue Million Forecast, by Product Type 2019 & 2032
- Table 33: Global Photopheresis Products Market Revenue Million Forecast, by Application 2019 & 2032
- Table 34: Global Photopheresis Products Market Revenue Million Forecast, by End User 2019 & 2032
- Table 35: Global Photopheresis Products Market Revenue Million Forecast, by Country 2019 & 2032
- Table 36: United States Photopheresis Products Market Revenue (Million) Forecast, by Application 2019 & 2032
- Table 37: Canada Photopheresis Products Market Revenue (Million) Forecast, by Application 2019 & 2032
- Table 38: Mexico Photopheresis Products Market Revenue (Million) Forecast, by Application 2019 & 2032
- Table 39: Global Photopheresis Products Market Revenue Million Forecast, by Product Type 2019 & 2032
- Table 40: Global Photopheresis Products Market Revenue Million Forecast, by Application 2019 & 2032
- Table 41: Global Photopheresis Products Market Revenue Million Forecast, by End User 2019 & 2032
- Table 42: Global Photopheresis Products Market Revenue Million Forecast, by Country 2019 & 2032
- Table 43: Germany Photopheresis Products Market Revenue (Million) Forecast, by Application 2019 & 2032
- Table 44: United Kingdom Photopheresis Products Market Revenue (Million) Forecast, by Application 2019 & 2032
- Table 45: France Photopheresis Products Market Revenue (Million) Forecast, by Application 2019 & 2032
- Table 46: Italy Photopheresis Products Market Revenue (Million) Forecast, by Application 2019 & 2032
- Table 47: Spain Photopheresis Products Market Revenue (Million) Forecast, by Application 2019 & 2032
- Table 48: Rest of Europe Photopheresis Products Market Revenue (Million) Forecast, by Application 2019 & 2032
- Table 49: Global Photopheresis Products Market Revenue Million Forecast, by Product Type 2019 & 2032
- Table 50: Global Photopheresis Products Market Revenue Million Forecast, by Application 2019 & 2032
- Table 51: Global Photopheresis Products Market Revenue Million Forecast, by End User 2019 & 2032
- Table 52: Global Photopheresis Products Market Revenue Million Forecast, by Country 2019 & 2032
- Table 53: China Photopheresis Products Market Revenue (Million) Forecast, by Application 2019 & 2032
- Table 54: Japan Photopheresis Products Market Revenue (Million) Forecast, by Application 2019 & 2032
- Table 55: India Photopheresis Products Market Revenue (Million) Forecast, by Application 2019 & 2032
- Table 56: Australia Photopheresis Products Market Revenue (Million) Forecast, by Application 2019 & 2032
- Table 57: South Korea Photopheresis Products Market Revenue (Million) Forecast, by Application 2019 & 2032
- Table 58: Rest of Asia Pacific Photopheresis Products Market Revenue (Million) Forecast, by Application 2019 & 2032
- Table 59: Global Photopheresis Products Market Revenue Million Forecast, by Product Type 2019 & 2032
- Table 60: Global Photopheresis Products Market Revenue Million Forecast, by Application 2019 & 2032
- Table 61: Global Photopheresis Products Market Revenue Million Forecast, by End User 2019 & 2032
- Table 62: Global Photopheresis Products Market Revenue Million Forecast, by Country 2019 & 2032
- Table 63: GCC Photopheresis Products Market Revenue (Million) Forecast, by Application 2019 & 2032
- Table 64: South Africa Photopheresis Products Market Revenue (Million) Forecast, by Application 2019 & 2032
- Table 65: Rest of Middle East and Africa Photopheresis Products Market Revenue (Million) Forecast, by Application 2019 & 2032
- Table 66: Global Photopheresis Products Market Revenue Million Forecast, by Product Type 2019 & 2032
- Table 67: Global Photopheresis Products Market Revenue Million Forecast, by Application 2019 & 2032
- Table 68: Global Photopheresis Products Market Revenue Million Forecast, by End User 2019 & 2032
- Table 69: Global Photopheresis Products Market Revenue Million Forecast, by Country 2019 & 2032
- Table 70: Brazil Photopheresis Products Market Revenue (Million) Forecast, by Application 2019 & 2032
- Table 71: Argentina Photopheresis Products Market Revenue (Million) Forecast, by Application 2019 & 2032
- Table 72: Rest of South America Photopheresis Products Market Revenue (Million) Forecast, by Application 2019 & 2032
Frequently Asked Questions
1. What is the projected Compound Annual Growth Rate (CAGR) of the Photopheresis Products Market?
The projected CAGR is approximately 5.30%.
2. Which companies are prominent players in the Photopheresis Products Market?
Key companies in the market include Macopharma, Terumo Corporation*List Not Exhaustive, Fresenius Kabi AG, PIT Medical Systems, Haemonetics Corporation, Mallinckrodt Pharmaceuticals.
3. What are the main segments of the Photopheresis Products Market?
The market segments include Product Type, Application, End User.
4. Can you provide details about the market size?
The market size is estimated to be USD XX Million as of 2022.
5. What are some drivers contributing to market growth?
Rise in Prevalence of Autoimmune Diseases; Increasing Technological Advancements.
6. What are the notable trends driving market growth?
Chronic Graft Versus Host Disease (GvHD) is Expected to Hold a Significant Market Share in the Market Studied..
7. Are there any restraints impacting market growth?
Low Adoption of Photopheresis in Pediatric Patients and Lack of Skilled Professionals.
8. Can you provide examples of recent developments in the market?
In September 2022, UAE opened a new apheresis unit in the Sheikh Shakhbout Medical City (SSMC) as a collaboration between Abu Dhabi Health Services Company (SEHA) and Mayo Clinic. Sheikh Shakhbout Medical City widens the treatment scope for diseases, including rare lymphoma of the skin.
9. What pricing options are available for accessing the report?
Pricing options include single-user, multi-user, and enterprise licenses priced at USD 4750, USD 5250, and USD 8750 respectively.
10. Is the market size provided in terms of value or volume?
The market size is provided in terms of value, measured in Million.
11. Are there any specific market keywords associated with the report?
Yes, the market keyword associated with the report is "Photopheresis Products Market," which aids in identifying and referencing the specific market segment covered.
12. How do I determine which pricing option suits my needs best?
The pricing options vary based on user requirements and access needs. Individual users may opt for single-user licenses, while businesses requiring broader access may choose multi-user or enterprise licenses for cost-effective access to the report.
13. Are there any additional resources or data provided in the Photopheresis Products Market report?
While the report offers comprehensive insights, it's advisable to review the specific contents or supplementary materials provided to ascertain if additional resources or data are available.
14. How can I stay updated on further developments or reports in the Photopheresis Products Market?
To stay informed about further developments, trends, and reports in the Photopheresis Products Market, consider subscribing to industry newsletters, following relevant companies and organizations, or regularly checking reputable industry news sources and publications.
Methodology
Step 1 - Identification of Relevant Samples Size from Population Database


Step 2 - Approaches for Defining Global Market Size (Value, Volume* & Price*)

Note*: In applicable scenarios
Step 3 - Data Sources
Primary Research
- Web Analytics
- Survey Reports
- Research Institute
- Latest Research Reports
- Opinion Leaders
Secondary Research
- Annual Reports
- White Paper
- Latest Press Release
- Industry Association
- Paid Database
- Investor Presentations

Step 4 - Data Triangulation
Involves using different sources of information in order to increase the validity of a study
These sources are likely to be stakeholders in a program - participants, other researchers, program staff, other community members, and so on.
Then we put all data in single framework & apply various statistical tools to find out the dynamic on the market.
During the analysis stage, feedback from the stakeholder groups would be compared to determine areas of agreement as well as areas of divergence


