
Key Insights
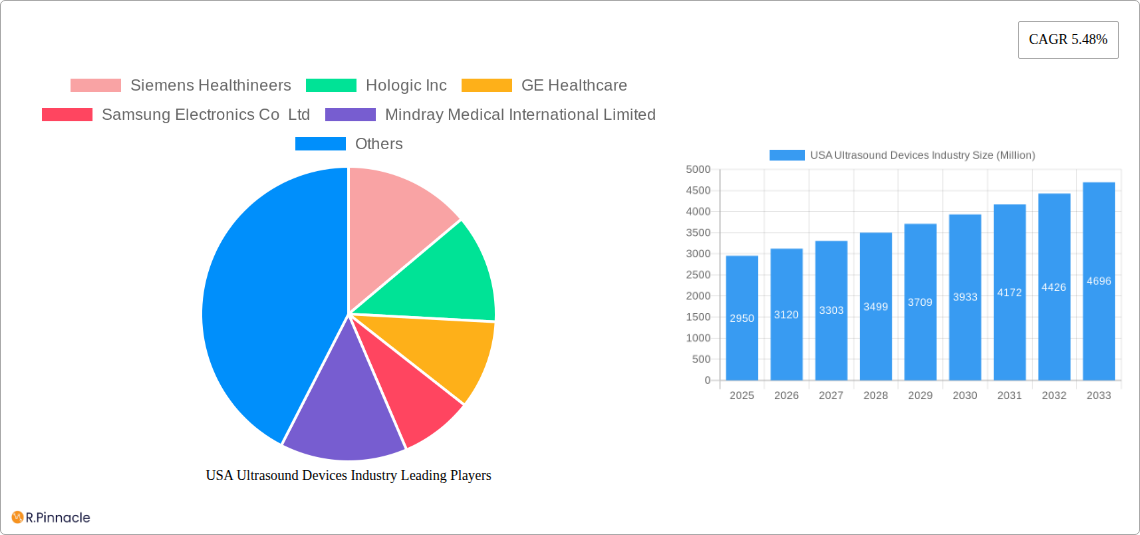
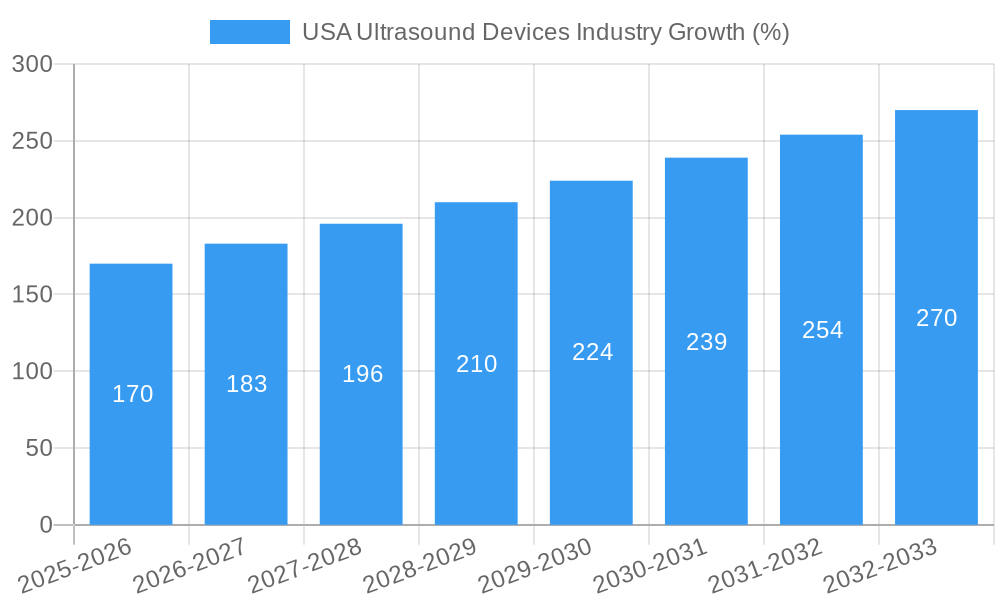
The US ultrasound devices market, valued at $2.95 billion in 2025, is projected to experience robust growth, driven by a rising geriatric population, increasing prevalence of chronic diseases requiring diagnostic imaging, and technological advancements in ultrasound technology. The market's Compound Annual Growth Rate (CAGR) of 5.48% from 2019 to 2024 suggests continued expansion through 2033. Key application segments like cardiology, radiology, and obstetrics/gynecology contribute significantly to market revenue, fueled by the demand for non-invasive diagnostic procedures and minimally invasive surgical techniques. Technological advancements such as 3D/4D imaging and high-intensity focused ultrasound (HIFU) are further boosting market growth by improving diagnostic accuracy and therapeutic capabilities. The market is dominated by major players like Siemens Healthineers, GE Healthcare, and Philips, who are constantly innovating and expanding their product portfolios to cater to evolving clinical needs. Competition is fierce, with companies focusing on enhancing image quality, portability, and integration with other medical devices. The increasing adoption of portable ultrasound systems in various settings, including point-of-care applications, is also a significant market driver. Regional variations exist within the US market, with states in the Northeast and West potentially exhibiting higher adoption rates due to factors such as higher healthcare expenditure and higher concentration of medical facilities.
The market's growth is expected to be influenced by factors such as reimbursement policies, regulatory approvals, and the ongoing development of AI-powered ultrasound technologies. While the market shows substantial promise, potential restraints include the high cost of advanced ultrasound systems, the need for skilled professionals for operation and interpretation, and potential competition from alternative imaging modalities like MRI and CT scans. However, the continuous improvements in ultrasound technology, its cost-effectiveness compared to other imaging techniques, and the increasing demand for early and accurate diagnosis are likely to outweigh these challenges, ensuring a positive outlook for the US ultrasound devices market in the coming years. The diverse applications and technological advancements ensure a dynamic and continually evolving market landscape.
USA Ultrasound Devices Industry Report: 2019-2033
This comprehensive report provides an in-depth analysis of the USA Ultrasound Devices industry, offering invaluable insights for industry professionals, investors, and strategic decision-makers. The study period covers 2019-2033, with a base year of 2025 and a forecast period of 2025-2033. The report leverages extensive market research to provide actionable intelligence on market size, growth drivers, competitive landscape, and future trends. Expect detailed segmentation analysis across applications, technology, and device type, along with profiles of key players such as Siemens Healthineers, Hologic Inc, GE Healthcare, and more.
USA Ultrasound Devices Industry Market Structure & Innovation Trends
The USA ultrasound devices market exhibits a moderately concentrated structure, with key players like Siemens Healthineers, Hologic Inc, and GE Healthcare commanding significant market share. Precise market share figures for 2024 are estimated at xx%, xx%, and xx% respectively. Innovation is driven by advancements in imaging technology (e.g., AI-powered image analysis, 3D/4D imaging), miniaturization leading to increased portability, and the rising demand for point-of-care diagnostics. Regulatory frameworks like FDA approvals heavily influence market dynamics. Product substitutes, while limited, include other medical imaging modalities like MRI and CT scans. The end-user demographic is broad, encompassing hospitals, clinics, and diagnostic imaging centers. M&A activity in the sector has been moderate, with recent deal values totaling approximately $xx Million in the last five years. Key examples include [mention specific M&A deals if available, otherwise use "xx" for values and details].
USA Ultrasound Devices Industry Market Dynamics & Trends
The USA ultrasound devices market is experiencing robust growth, driven primarily by the rising prevalence of chronic diseases requiring frequent diagnostic imaging, increasing geriatric population, technological advancements, and rising healthcare expenditure. The Compound Annual Growth Rate (CAGR) during the forecast period (2025-2033) is projected to be xx%. Market penetration is high in urban areas but remains relatively low in rural regions. Technological disruptions, such as the introduction of AI-powered diagnostic tools and cloud-based image management systems, are significantly impacting the market. Consumer preferences are shifting toward portable and wireless devices offering improved portability and ease of use. Competitive dynamics are characterized by intense rivalry among established players, along with the emergence of innovative start-ups. This competition is driving down prices and improving the quality of ultrasound devices.
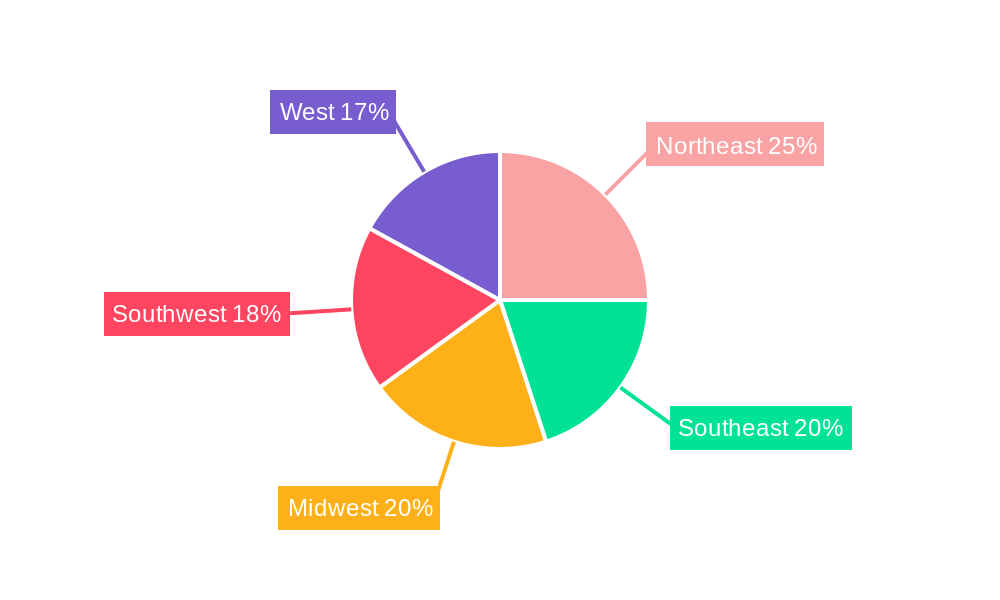
Dominant Regions & Segments in USA Ultrasound Devices Industry
The Northeast region dominates the USA ultrasound devices market, owing to higher healthcare expenditure, better infrastructure, and a higher concentration of hospitals and diagnostic imaging centers.
- Key Drivers for Northeast Region Dominance:
- High concentration of healthcare facilities
- Higher healthcare spending per capita
- Advanced medical infrastructure
- Stringent regulatory compliance encouraging technological adoption
Within the application segments, Cardiology and Gynecology/Obstetrics hold the largest market share, driven by the high prevalence of cardiovascular and reproductive health issues. In terms of technology, 2D ultrasound imaging still accounts for the largest share, but 3D/4D and Doppler imaging segments are exhibiting rapid growth. Portable ultrasound devices are gaining traction due to their flexibility and ease of use in various settings.
USA Ultrasound Devices Industry Product Innovations
Recent years have witnessed significant product innovations in the ultrasound devices market, including the integration of AI algorithms for improved image quality and automated analysis, the development of more compact and portable devices, and the introduction of new imaging modalities, such as shear wave elastography and contrast-enhanced ultrasound. These innovations are enhancing diagnostic accuracy, improving workflow efficiency, and expanding the clinical applications of ultrasound technology, ultimately driving market growth and enhancing patient care.
Report Scope & Segmentation Analysis
This report provides a comprehensive segmentation of the USA ultrasound devices market based on application (Anesthesiology, Cardiology, Gynecology/Obstetrics, Musculoskeletal, Radiology, Critical Care, Other Applications), technology (2D Ultrasound Imaging, 3D and 4D Ultrasound Imaging, Doppler Imaging, High-intensity Focused Ultrasound), and type (Stationary Ultrasound, Portable Ultrasound). Each segment's market size, growth projections, and competitive dynamics are analyzed in detail. For instance, the Cardiology application segment is projected to witness a CAGR of xx% during the forecast period due to the increasing prevalence of cardiovascular diseases, while the portable ultrasound type segment is expected to experience rapid growth due to increasing demand for point-of-care diagnostics.
Key Drivers of USA Ultrasound Devices Industry Growth
The growth of the USA ultrasound devices industry is propelled by several factors: an aging population necessitating increased diagnostic testing, rising healthcare expenditure, technological advancements leading to improved image quality and portability, increasing prevalence of chronic diseases, and favorable government regulations promoting healthcare infrastructure development. Furthermore, the growing adoption of minimally invasive procedures is increasing the demand for ultrasound guidance.
Challenges in the USA Ultrasound Devices Industry Sector
The USA ultrasound devices industry faces challenges including stringent regulatory approvals, which can delay product launches and increase development costs, high initial investment costs for advanced systems, the potential for reimbursement issues and price competition from emerging market players. Supply chain disruptions can also impact device availability and manufacturing costs.
Emerging Opportunities in USA Ultrasound Devices Industry
Emerging opportunities include the increasing demand for point-of-care ultrasound, the growing adoption of AI and machine learning in image analysis, the development of novel ultrasound applications in areas such as oncology and neurology, and the expansion into underserved rural markets. The integration of telehealth platforms with ultrasound devices also presents significant growth potential.
Leading Players in the USA Ultrasound Devices Industry Market
- Siemens Healthineers
- Hologic Inc
- GE Healthcare
- Samsung Electronics Co Ltd
- Mindray Medical International Limited
- Koninklijke Philips NV
- Canon Medical Systems Corporation
- Carestream Health Inc
- Esaote SpA
- Fujifilm Holdings Corporation
Key Developments in USA Ultrasound Devices Industry
- March 2022: Royal Philips launched Ultrasound Workspace, a vendor-neutral echocardiography solution.
- November 2021: GE Healthcare unveiled Vscan Air ultrasound, a portable point-of-care device.
These developments highlight the industry's focus on improving diagnostic capabilities and workflow efficiency.
Future Outlook for USA Ultrasound Devices Industry Market
The future of the USA ultrasound devices market appears bright, driven by continuous technological innovation, increasing demand for advanced imaging capabilities, and the expansion into new applications. The market is poised for sustained growth, presenting lucrative opportunities for established players and new entrants alike. Strategic partnerships, technological advancements, and a focus on enhancing the user experience will be key to success in this dynamic market.
USA Ultrasound Devices Industry Segmentation
-
1. Application
- 1.1. Anesthesiology
- 1.2. Cardiology
- 1.3. Gynecology/Obstetrics
- 1.4. Musculoskeletal
- 1.5. Radiology
- 1.6. Critical Care
- 1.7. Other Applications
-
2. Technology
- 2.1. 2D Ultrasound Imaging
- 2.2. 3D and 4D Ultrasound Imaging
- 2.3. Doppler Imaging
- 2.4. High-intensity Focused Ultrasound
-
3. Type
- 3.1. Stationary Ultrasound
- 3.2. Portable Ultrasound
USA Ultrasound Devices Industry Segmentation By Geography
-
1. North America
- 1.1. United States
- 1.2. Canada
- 1.3. Mexico
-
2. South America
- 2.1. Brazil
- 2.2. Argentina
- 2.3. Rest of South America
-
3. Europe
- 3.1. United Kingdom
- 3.2. Germany
- 3.3. France
- 3.4. Italy
- 3.5. Spain
- 3.6. Russia
- 3.7. Benelux
- 3.8. Nordics
- 3.9. Rest of Europe
-
4. Middle East & Africa
- 4.1. Turkey
- 4.2. Israel
- 4.3. GCC
- 4.4. North Africa
- 4.5. South Africa
- 4.6. Rest of Middle East & Africa
-
5. Asia Pacific
- 5.1. China
- 5.2. India
- 5.3. Japan
- 5.4. South Korea
- 5.5. ASEAN
- 5.6. Oceania
- 5.7. Rest of Asia Pacific
USA Ultrasound Devices Industry REPORT HIGHLIGHTS
| Aspects | Details |
|---|---|
| Study Period | 2019-2033 |
| Base Year | 2024 |
| Estimated Year | 2025 |
| Forecast Period | 2025-2033 |
| Historical Period | 2019-2024 |
| Growth Rate | CAGR of 5.48% from 2019-2033 |
| Segmentation |
|
Table of Contents
- 1. Introduction
- 1.1. Research Scope
- 1.2. Market Segmentation
- 1.3. Research Methodology
- 1.4. Definitions and Assumptions
- 2. Executive Summary
- 2.1. Introduction
- 3. Market Dynamics
- 3.1. Introduction
- 3.2. Market Drivers
- 3.2.1. Technological Advancements; Increasing Incidences of Chronic Diseases
- 3.3. Market Restrains
- 3.3.1. Strict Regulations
- 3.4. Market Trends
- 3.4.1. Anesthesiology is Expected to Witness Rapid Growth
- 4. Market Factor Analysis
- 4.1. Porters Five Forces
- 4.2. Supply/Value Chain
- 4.3. PESTEL analysis
- 4.4. Market Entropy
- 4.5. Patent/Trademark Analysis
- 5. Global USA Ultrasound Devices Industry Analysis, Insights and Forecast, 2019-2031
- 5.1. Market Analysis, Insights and Forecast - by Application
- 5.1.1. Anesthesiology
- 5.1.2. Cardiology
- 5.1.3. Gynecology/Obstetrics
- 5.1.4. Musculoskeletal
- 5.1.5. Radiology
- 5.1.6. Critical Care
- 5.1.7. Other Applications
- 5.2. Market Analysis, Insights and Forecast - by Technology
- 5.2.1. 2D Ultrasound Imaging
- 5.2.2. 3D and 4D Ultrasound Imaging
- 5.2.3. Doppler Imaging
- 5.2.4. High-intensity Focused Ultrasound
- 5.3. Market Analysis, Insights and Forecast - by Type
- 5.3.1. Stationary Ultrasound
- 5.3.2. Portable Ultrasound
- 5.4. Market Analysis, Insights and Forecast - by Region
- 5.4.1. North America
- 5.4.2. South America
- 5.4.3. Europe
- 5.4.4. Middle East & Africa
- 5.4.5. Asia Pacific
- 5.1. Market Analysis, Insights and Forecast - by Application
- 6. North America USA Ultrasound Devices Industry Analysis, Insights and Forecast, 2019-2031
- 6.1. Market Analysis, Insights and Forecast - by Application
- 6.1.1. Anesthesiology
- 6.1.2. Cardiology
- 6.1.3. Gynecology/Obstetrics
- 6.1.4. Musculoskeletal
- 6.1.5. Radiology
- 6.1.6. Critical Care
- 6.1.7. Other Applications
- 6.2. Market Analysis, Insights and Forecast - by Technology
- 6.2.1. 2D Ultrasound Imaging
- 6.2.2. 3D and 4D Ultrasound Imaging
- 6.2.3. Doppler Imaging
- 6.2.4. High-intensity Focused Ultrasound
- 6.3. Market Analysis, Insights and Forecast - by Type
- 6.3.1. Stationary Ultrasound
- 6.3.2. Portable Ultrasound
- 6.1. Market Analysis, Insights and Forecast - by Application
- 7. South America USA Ultrasound Devices Industry Analysis, Insights and Forecast, 2019-2031
- 7.1. Market Analysis, Insights and Forecast - by Application
- 7.1.1. Anesthesiology
- 7.1.2. Cardiology
- 7.1.3. Gynecology/Obstetrics
- 7.1.4. Musculoskeletal
- 7.1.5. Radiology
- 7.1.6. Critical Care
- 7.1.7. Other Applications
- 7.2. Market Analysis, Insights and Forecast - by Technology
- 7.2.1. 2D Ultrasound Imaging
- 7.2.2. 3D and 4D Ultrasound Imaging
- 7.2.3. Doppler Imaging
- 7.2.4. High-intensity Focused Ultrasound
- 7.3. Market Analysis, Insights and Forecast - by Type
- 7.3.1. Stationary Ultrasound
- 7.3.2. Portable Ultrasound
- 7.1. Market Analysis, Insights and Forecast - by Application
- 8. Europe USA Ultrasound Devices Industry Analysis, Insights and Forecast, 2019-2031
- 8.1. Market Analysis, Insights and Forecast - by Application
- 8.1.1. Anesthesiology
- 8.1.2. Cardiology
- 8.1.3. Gynecology/Obstetrics
- 8.1.4. Musculoskeletal
- 8.1.5. Radiology
- 8.1.6. Critical Care
- 8.1.7. Other Applications
- 8.2. Market Analysis, Insights and Forecast - by Technology
- 8.2.1. 2D Ultrasound Imaging
- 8.2.2. 3D and 4D Ultrasound Imaging
- 8.2.3. Doppler Imaging
- 8.2.4. High-intensity Focused Ultrasound
- 8.3. Market Analysis, Insights and Forecast - by Type
- 8.3.1. Stationary Ultrasound
- 8.3.2. Portable Ultrasound
- 8.1. Market Analysis, Insights and Forecast - by Application
- 9. Middle East & Africa USA Ultrasound Devices Industry Analysis, Insights and Forecast, 2019-2031
- 9.1. Market Analysis, Insights and Forecast - by Application
- 9.1.1. Anesthesiology
- 9.1.2. Cardiology
- 9.1.3. Gynecology/Obstetrics
- 9.1.4. Musculoskeletal
- 9.1.5. Radiology
- 9.1.6. Critical Care
- 9.1.7. Other Applications
- 9.2. Market Analysis, Insights and Forecast - by Technology
- 9.2.1. 2D Ultrasound Imaging
- 9.2.2. 3D and 4D Ultrasound Imaging
- 9.2.3. Doppler Imaging
- 9.2.4. High-intensity Focused Ultrasound
- 9.3. Market Analysis, Insights and Forecast - by Type
- 9.3.1. Stationary Ultrasound
- 9.3.2. Portable Ultrasound
- 9.1. Market Analysis, Insights and Forecast - by Application
- 10. Asia Pacific USA Ultrasound Devices Industry Analysis, Insights and Forecast, 2019-2031
- 10.1. Market Analysis, Insights and Forecast - by Application
- 10.1.1. Anesthesiology
- 10.1.2. Cardiology
- 10.1.3. Gynecology/Obstetrics
- 10.1.4. Musculoskeletal
- 10.1.5. Radiology
- 10.1.6. Critical Care
- 10.1.7. Other Applications
- 10.2. Market Analysis, Insights and Forecast - by Technology
- 10.2.1. 2D Ultrasound Imaging
- 10.2.2. 3D and 4D Ultrasound Imaging
- 10.2.3. Doppler Imaging
- 10.2.4. High-intensity Focused Ultrasound
- 10.3. Market Analysis, Insights and Forecast - by Type
- 10.3.1. Stationary Ultrasound
- 10.3.2. Portable Ultrasound
- 10.1. Market Analysis, Insights and Forecast - by Application
- 11. Northeast USA Ultrasound Devices Industry Analysis, Insights and Forecast, 2019-2031
- 12. Southeast USA Ultrasound Devices Industry Analysis, Insights and Forecast, 2019-2031
- 13. Midwest USA Ultrasound Devices Industry Analysis, Insights and Forecast, 2019-2031
- 14. Southwest USA Ultrasound Devices Industry Analysis, Insights and Forecast, 2019-2031
- 15. West USA Ultrasound Devices Industry Analysis, Insights and Forecast, 2019-2031
- 16. Competitive Analysis
- 16.1. Global Market Share Analysis 2024
- 16.2. Company Profiles
- 16.2.1 Siemens Healthineers
- 16.2.1.1. Overview
- 16.2.1.2. Products
- 16.2.1.3. SWOT Analysis
- 16.2.1.4. Recent Developments
- 16.2.1.5. Financials (Based on Availability)
- 16.2.2 Hologic Inc
- 16.2.2.1. Overview
- 16.2.2.2. Products
- 16.2.2.3. SWOT Analysis
- 16.2.2.4. Recent Developments
- 16.2.2.5. Financials (Based on Availability)
- 16.2.3 GE Healthcare
- 16.2.3.1. Overview
- 16.2.3.2. Products
- 16.2.3.3. SWOT Analysis
- 16.2.3.4. Recent Developments
- 16.2.3.5. Financials (Based on Availability)
- 16.2.4 Samsung Electronics Co Ltd
- 16.2.4.1. Overview
- 16.2.4.2. Products
- 16.2.4.3. SWOT Analysis
- 16.2.4.4. Recent Developments
- 16.2.4.5. Financials (Based on Availability)
- 16.2.5 Mindray Medical International Limited
- 16.2.5.1. Overview
- 16.2.5.2. Products
- 16.2.5.3. SWOT Analysis
- 16.2.5.4. Recent Developments
- 16.2.5.5. Financials (Based on Availability)
- 16.2.6 Koninklijke Philips NV
- 16.2.6.1. Overview
- 16.2.6.2. Products
- 16.2.6.3. SWOT Analysis
- 16.2.6.4. Recent Developments
- 16.2.6.5. Financials (Based on Availability)
- 16.2.7 Canon Medical Systems Corporation
- 16.2.7.1. Overview
- 16.2.7.2. Products
- 16.2.7.3. SWOT Analysis
- 16.2.7.4. Recent Developments
- 16.2.7.5. Financials (Based on Availability)
- 16.2.8 Carestream Health Inc
- 16.2.8.1. Overview
- 16.2.8.2. Products
- 16.2.8.3. SWOT Analysis
- 16.2.8.4. Recent Developments
- 16.2.8.5. Financials (Based on Availability)
- 16.2.9 Esaote SpA
- 16.2.9.1. Overview
- 16.2.9.2. Products
- 16.2.9.3. SWOT Analysis
- 16.2.9.4. Recent Developments
- 16.2.9.5. Financials (Based on Availability)
- 16.2.10 Fujifilm Holdings Corporation
- 16.2.10.1. Overview
- 16.2.10.2. Products
- 16.2.10.3. SWOT Analysis
- 16.2.10.4. Recent Developments
- 16.2.10.5. Financials (Based on Availability)
- 16.2.1 Siemens Healthineers
List of Figures
- Figure 1: Global USA Ultrasound Devices Industry Revenue Breakdown (Million, %) by Region 2024 & 2032
- Figure 2: Global USA Ultrasound Devices Industry Volume Breakdown (K Unit, %) by Region 2024 & 2032
- Figure 3: United states USA Ultrasound Devices Industry Revenue (Million), by Country 2024 & 2032
- Figure 4: United states USA Ultrasound Devices Industry Volume (K Unit), by Country 2024 & 2032
- Figure 5: United states USA Ultrasound Devices Industry Revenue Share (%), by Country 2024 & 2032
- Figure 6: United states USA Ultrasound Devices Industry Volume Share (%), by Country 2024 & 2032
- Figure 7: North America USA Ultrasound Devices Industry Revenue (Million), by Application 2024 & 2032
- Figure 8: North America USA Ultrasound Devices Industry Volume (K Unit), by Application 2024 & 2032
- Figure 9: North America USA Ultrasound Devices Industry Revenue Share (%), by Application 2024 & 2032
- Figure 10: North America USA Ultrasound Devices Industry Volume Share (%), by Application 2024 & 2032
- Figure 11: North America USA Ultrasound Devices Industry Revenue (Million), by Technology 2024 & 2032
- Figure 12: North America USA Ultrasound Devices Industry Volume (K Unit), by Technology 2024 & 2032
- Figure 13: North America USA Ultrasound Devices Industry Revenue Share (%), by Technology 2024 & 2032
- Figure 14: North America USA Ultrasound Devices Industry Volume Share (%), by Technology 2024 & 2032
- Figure 15: North America USA Ultrasound Devices Industry Revenue (Million), by Type 2024 & 2032
- Figure 16: North America USA Ultrasound Devices Industry Volume (K Unit), by Type 2024 & 2032
- Figure 17: North America USA Ultrasound Devices Industry Revenue Share (%), by Type 2024 & 2032
- Figure 18: North America USA Ultrasound Devices Industry Volume Share (%), by Type 2024 & 2032
- Figure 19: North America USA Ultrasound Devices Industry Revenue (Million), by Country 2024 & 2032
- Figure 20: North America USA Ultrasound Devices Industry Volume (K Unit), by Country 2024 & 2032
- Figure 21: North America USA Ultrasound Devices Industry Revenue Share (%), by Country 2024 & 2032
- Figure 22: North America USA Ultrasound Devices Industry Volume Share (%), by Country 2024 & 2032
- Figure 23: South America USA Ultrasound Devices Industry Revenue (Million), by Application 2024 & 2032
- Figure 24: South America USA Ultrasound Devices Industry Volume (K Unit), by Application 2024 & 2032
- Figure 25: South America USA Ultrasound Devices Industry Revenue Share (%), by Application 2024 & 2032
- Figure 26: South America USA Ultrasound Devices Industry Volume Share (%), by Application 2024 & 2032
- Figure 27: South America USA Ultrasound Devices Industry Revenue (Million), by Technology 2024 & 2032
- Figure 28: South America USA Ultrasound Devices Industry Volume (K Unit), by Technology 2024 & 2032
- Figure 29: South America USA Ultrasound Devices Industry Revenue Share (%), by Technology 2024 & 2032
- Figure 30: South America USA Ultrasound Devices Industry Volume Share (%), by Technology 2024 & 2032
- Figure 31: South America USA Ultrasound Devices Industry Revenue (Million), by Type 2024 & 2032
- Figure 32: South America USA Ultrasound Devices Industry Volume (K Unit), by Type 2024 & 2032
- Figure 33: South America USA Ultrasound Devices Industry Revenue Share (%), by Type 2024 & 2032
- Figure 34: South America USA Ultrasound Devices Industry Volume Share (%), by Type 2024 & 2032
- Figure 35: South America USA Ultrasound Devices Industry Revenue (Million), by Country 2024 & 2032
- Figure 36: South America USA Ultrasound Devices Industry Volume (K Unit), by Country 2024 & 2032
- Figure 37: South America USA Ultrasound Devices Industry Revenue Share (%), by Country 2024 & 2032
- Figure 38: South America USA Ultrasound Devices Industry Volume Share (%), by Country 2024 & 2032
- Figure 39: Europe USA Ultrasound Devices Industry Revenue (Million), by Application 2024 & 2032
- Figure 40: Europe USA Ultrasound Devices Industry Volume (K Unit), by Application 2024 & 2032
- Figure 41: Europe USA Ultrasound Devices Industry Revenue Share (%), by Application 2024 & 2032
- Figure 42: Europe USA Ultrasound Devices Industry Volume Share (%), by Application 2024 & 2032
- Figure 43: Europe USA Ultrasound Devices Industry Revenue (Million), by Technology 2024 & 2032
- Figure 44: Europe USA Ultrasound Devices Industry Volume (K Unit), by Technology 2024 & 2032
- Figure 45: Europe USA Ultrasound Devices Industry Revenue Share (%), by Technology 2024 & 2032
- Figure 46: Europe USA Ultrasound Devices Industry Volume Share (%), by Technology 2024 & 2032
- Figure 47: Europe USA Ultrasound Devices Industry Revenue (Million), by Type 2024 & 2032
- Figure 48: Europe USA Ultrasound Devices Industry Volume (K Unit), by Type 2024 & 2032
- Figure 49: Europe USA Ultrasound Devices Industry Revenue Share (%), by Type 2024 & 2032
- Figure 50: Europe USA Ultrasound Devices Industry Volume Share (%), by Type 2024 & 2032
- Figure 51: Europe USA Ultrasound Devices Industry Revenue (Million), by Country 2024 & 2032
- Figure 52: Europe USA Ultrasound Devices Industry Volume (K Unit), by Country 2024 & 2032
- Figure 53: Europe USA Ultrasound Devices Industry Revenue Share (%), by Country 2024 & 2032
- Figure 54: Europe USA Ultrasound Devices Industry Volume Share (%), by Country 2024 & 2032
- Figure 55: Middle East & Africa USA Ultrasound Devices Industry Revenue (Million), by Application 2024 & 2032
- Figure 56: Middle East & Africa USA Ultrasound Devices Industry Volume (K Unit), by Application 2024 & 2032
- Figure 57: Middle East & Africa USA Ultrasound Devices Industry Revenue Share (%), by Application 2024 & 2032
- Figure 58: Middle East & Africa USA Ultrasound Devices Industry Volume Share (%), by Application 2024 & 2032
- Figure 59: Middle East & Africa USA Ultrasound Devices Industry Revenue (Million), by Technology 2024 & 2032
- Figure 60: Middle East & Africa USA Ultrasound Devices Industry Volume (K Unit), by Technology 2024 & 2032
- Figure 61: Middle East & Africa USA Ultrasound Devices Industry Revenue Share (%), by Technology 2024 & 2032
- Figure 62: Middle East & Africa USA Ultrasound Devices Industry Volume Share (%), by Technology 2024 & 2032
- Figure 63: Middle East & Africa USA Ultrasound Devices Industry Revenue (Million), by Type 2024 & 2032
- Figure 64: Middle East & Africa USA Ultrasound Devices Industry Volume (K Unit), by Type 2024 & 2032
- Figure 65: Middle East & Africa USA Ultrasound Devices Industry Revenue Share (%), by Type 2024 & 2032
- Figure 66: Middle East & Africa USA Ultrasound Devices Industry Volume Share (%), by Type 2024 & 2032
- Figure 67: Middle East & Africa USA Ultrasound Devices Industry Revenue (Million), by Country 2024 & 2032
- Figure 68: Middle East & Africa USA Ultrasound Devices Industry Volume (K Unit), by Country 2024 & 2032
- Figure 69: Middle East & Africa USA Ultrasound Devices Industry Revenue Share (%), by Country 2024 & 2032
- Figure 70: Middle East & Africa USA Ultrasound Devices Industry Volume Share (%), by Country 2024 & 2032
- Figure 71: Asia Pacific USA Ultrasound Devices Industry Revenue (Million), by Application 2024 & 2032
- Figure 72: Asia Pacific USA Ultrasound Devices Industry Volume (K Unit), by Application 2024 & 2032
- Figure 73: Asia Pacific USA Ultrasound Devices Industry Revenue Share (%), by Application 2024 & 2032
- Figure 74: Asia Pacific USA Ultrasound Devices Industry Volume Share (%), by Application 2024 & 2032
- Figure 75: Asia Pacific USA Ultrasound Devices Industry Revenue (Million), by Technology 2024 & 2032
- Figure 76: Asia Pacific USA Ultrasound Devices Industry Volume (K Unit), by Technology 2024 & 2032
- Figure 77: Asia Pacific USA Ultrasound Devices Industry Revenue Share (%), by Technology 2024 & 2032
- Figure 78: Asia Pacific USA Ultrasound Devices Industry Volume Share (%), by Technology 2024 & 2032
- Figure 79: Asia Pacific USA Ultrasound Devices Industry Revenue (Million), by Type 2024 & 2032
- Figure 80: Asia Pacific USA Ultrasound Devices Industry Volume (K Unit), by Type 2024 & 2032
- Figure 81: Asia Pacific USA Ultrasound Devices Industry Revenue Share (%), by Type 2024 & 2032
- Figure 82: Asia Pacific USA Ultrasound Devices Industry Volume Share (%), by Type 2024 & 2032
- Figure 83: Asia Pacific USA Ultrasound Devices Industry Revenue (Million), by Country 2024 & 2032
- Figure 84: Asia Pacific USA Ultrasound Devices Industry Volume (K Unit), by Country 2024 & 2032
- Figure 85: Asia Pacific USA Ultrasound Devices Industry Revenue Share (%), by Country 2024 & 2032
- Figure 86: Asia Pacific USA Ultrasound Devices Industry Volume Share (%), by Country 2024 & 2032
List of Tables
- Table 1: Global USA Ultrasound Devices Industry Revenue Million Forecast, by Region 2019 & 2032
- Table 2: Global USA Ultrasound Devices Industry Volume K Unit Forecast, by Region 2019 & 2032
- Table 3: Global USA Ultrasound Devices Industry Revenue Million Forecast, by Application 2019 & 2032
- Table 4: Global USA Ultrasound Devices Industry Volume K Unit Forecast, by Application 2019 & 2032
- Table 5: Global USA Ultrasound Devices Industry Revenue Million Forecast, by Technology 2019 & 2032
- Table 6: Global USA Ultrasound Devices Industry Volume K Unit Forecast, by Technology 2019 & 2032
- Table 7: Global USA Ultrasound Devices Industry Revenue Million Forecast, by Type 2019 & 2032
- Table 8: Global USA Ultrasound Devices Industry Volume K Unit Forecast, by Type 2019 & 2032
- Table 9: Global USA Ultrasound Devices Industry Revenue Million Forecast, by Region 2019 & 2032
- Table 10: Global USA Ultrasound Devices Industry Volume K Unit Forecast, by Region 2019 & 2032
- Table 11: Global USA Ultrasound Devices Industry Revenue Million Forecast, by Country 2019 & 2032
- Table 12: Global USA Ultrasound Devices Industry Volume K Unit Forecast, by Country 2019 & 2032
- Table 13: Northeast USA Ultrasound Devices Industry Revenue (Million) Forecast, by Application 2019 & 2032
- Table 14: Northeast USA Ultrasound Devices Industry Volume (K Unit) Forecast, by Application 2019 & 2032
- Table 15: Southeast USA Ultrasound Devices Industry Revenue (Million) Forecast, by Application 2019 & 2032
- Table 16: Southeast USA Ultrasound Devices Industry Volume (K Unit) Forecast, by Application 2019 & 2032
- Table 17: Midwest USA Ultrasound Devices Industry Revenue (Million) Forecast, by Application 2019 & 2032
- Table 18: Midwest USA Ultrasound Devices Industry Volume (K Unit) Forecast, by Application 2019 & 2032
- Table 19: Southwest USA Ultrasound Devices Industry Revenue (Million) Forecast, by Application 2019 & 2032
- Table 20: Southwest USA Ultrasound Devices Industry Volume (K Unit) Forecast, by Application 2019 & 2032
- Table 21: West USA Ultrasound Devices Industry Revenue (Million) Forecast, by Application 2019 & 2032
- Table 22: West USA Ultrasound Devices Industry Volume (K Unit) Forecast, by Application 2019 & 2032
- Table 23: Global USA Ultrasound Devices Industry Revenue Million Forecast, by Application 2019 & 2032
- Table 24: Global USA Ultrasound Devices Industry Volume K Unit Forecast, by Application 2019 & 2032
- Table 25: Global USA Ultrasound Devices Industry Revenue Million Forecast, by Technology 2019 & 2032
- Table 26: Global USA Ultrasound Devices Industry Volume K Unit Forecast, by Technology 2019 & 2032
- Table 27: Global USA Ultrasound Devices Industry Revenue Million Forecast, by Type 2019 & 2032
- Table 28: Global USA Ultrasound Devices Industry Volume K Unit Forecast, by Type 2019 & 2032
- Table 29: Global USA Ultrasound Devices Industry Revenue Million Forecast, by Country 2019 & 2032
- Table 30: Global USA Ultrasound Devices Industry Volume K Unit Forecast, by Country 2019 & 2032
- Table 31: United States USA Ultrasound Devices Industry Revenue (Million) Forecast, by Application 2019 & 2032
- Table 32: United States USA Ultrasound Devices Industry Volume (K Unit) Forecast, by Application 2019 & 2032
- Table 33: Canada USA Ultrasound Devices Industry Revenue (Million) Forecast, by Application 2019 & 2032
- Table 34: Canada USA Ultrasound Devices Industry Volume (K Unit) Forecast, by Application 2019 & 2032
- Table 35: Mexico USA Ultrasound Devices Industry Revenue (Million) Forecast, by Application 2019 & 2032
- Table 36: Mexico USA Ultrasound Devices Industry Volume (K Unit) Forecast, by Application 2019 & 2032
- Table 37: Global USA Ultrasound Devices Industry Revenue Million Forecast, by Application 2019 & 2032
- Table 38: Global USA Ultrasound Devices Industry Volume K Unit Forecast, by Application 2019 & 2032
- Table 39: Global USA Ultrasound Devices Industry Revenue Million Forecast, by Technology 2019 & 2032
- Table 40: Global USA Ultrasound Devices Industry Volume K Unit Forecast, by Technology 2019 & 2032
- Table 41: Global USA Ultrasound Devices Industry Revenue Million Forecast, by Type 2019 & 2032
- Table 42: Global USA Ultrasound Devices Industry Volume K Unit Forecast, by Type 2019 & 2032
- Table 43: Global USA Ultrasound Devices Industry Revenue Million Forecast, by Country 2019 & 2032
- Table 44: Global USA Ultrasound Devices Industry Volume K Unit Forecast, by Country 2019 & 2032
- Table 45: Brazil USA Ultrasound Devices Industry Revenue (Million) Forecast, by Application 2019 & 2032
- Table 46: Brazil USA Ultrasound Devices Industry Volume (K Unit) Forecast, by Application 2019 & 2032
- Table 47: Argentina USA Ultrasound Devices Industry Revenue (Million) Forecast, by Application 2019 & 2032
- Table 48: Argentina USA Ultrasound Devices Industry Volume (K Unit) Forecast, by Application 2019 & 2032
- Table 49: Rest of South America USA Ultrasound Devices Industry Revenue (Million) Forecast, by Application 2019 & 2032
- Table 50: Rest of South America USA Ultrasound Devices Industry Volume (K Unit) Forecast, by Application 2019 & 2032
- Table 51: Global USA Ultrasound Devices Industry Revenue Million Forecast, by Application 2019 & 2032
- Table 52: Global USA Ultrasound Devices Industry Volume K Unit Forecast, by Application 2019 & 2032
- Table 53: Global USA Ultrasound Devices Industry Revenue Million Forecast, by Technology 2019 & 2032
- Table 54: Global USA Ultrasound Devices Industry Volume K Unit Forecast, by Technology 2019 & 2032
- Table 55: Global USA Ultrasound Devices Industry Revenue Million Forecast, by Type 2019 & 2032
- Table 56: Global USA Ultrasound Devices Industry Volume K Unit Forecast, by Type 2019 & 2032
- Table 57: Global USA Ultrasound Devices Industry Revenue Million Forecast, by Country 2019 & 2032
- Table 58: Global USA Ultrasound Devices Industry Volume K Unit Forecast, by Country 2019 & 2032
- Table 59: United Kingdom USA Ultrasound Devices Industry Revenue (Million) Forecast, by Application 2019 & 2032
- Table 60: United Kingdom USA Ultrasound Devices Industry Volume (K Unit) Forecast, by Application 2019 & 2032
- Table 61: Germany USA Ultrasound Devices Industry Revenue (Million) Forecast, by Application 2019 & 2032
- Table 62: Germany USA Ultrasound Devices Industry Volume (K Unit) Forecast, by Application 2019 & 2032
- Table 63: France USA Ultrasound Devices Industry Revenue (Million) Forecast, by Application 2019 & 2032
- Table 64: France USA Ultrasound Devices Industry Volume (K Unit) Forecast, by Application 2019 & 2032
- Table 65: Italy USA Ultrasound Devices Industry Revenue (Million) Forecast, by Application 2019 & 2032
- Table 66: Italy USA Ultrasound Devices Industry Volume (K Unit) Forecast, by Application 2019 & 2032
- Table 67: Spain USA Ultrasound Devices Industry Revenue (Million) Forecast, by Application 2019 & 2032
- Table 68: Spain USA Ultrasound Devices Industry Volume (K Unit) Forecast, by Application 2019 & 2032
- Table 69: Russia USA Ultrasound Devices Industry Revenue (Million) Forecast, by Application 2019 & 2032
- Table 70: Russia USA Ultrasound Devices Industry Volume (K Unit) Forecast, by Application 2019 & 2032
- Table 71: Benelux USA Ultrasound Devices Industry Revenue (Million) Forecast, by Application 2019 & 2032
- Table 72: Benelux USA Ultrasound Devices Industry Volume (K Unit) Forecast, by Application 2019 & 2032
- Table 73: Nordics USA Ultrasound Devices Industry Revenue (Million) Forecast, by Application 2019 & 2032
- Table 74: Nordics USA Ultrasound Devices Industry Volume (K Unit) Forecast, by Application 2019 & 2032
- Table 75: Rest of Europe USA Ultrasound Devices Industry Revenue (Million) Forecast, by Application 2019 & 2032
- Table 76: Rest of Europe USA Ultrasound Devices Industry Volume (K Unit) Forecast, by Application 2019 & 2032
- Table 77: Global USA Ultrasound Devices Industry Revenue Million Forecast, by Application 2019 & 2032
- Table 78: Global USA Ultrasound Devices Industry Volume K Unit Forecast, by Application 2019 & 2032
- Table 79: Global USA Ultrasound Devices Industry Revenue Million Forecast, by Technology 2019 & 2032
- Table 80: Global USA Ultrasound Devices Industry Volume K Unit Forecast, by Technology 2019 & 2032
- Table 81: Global USA Ultrasound Devices Industry Revenue Million Forecast, by Type 2019 & 2032
- Table 82: Global USA Ultrasound Devices Industry Volume K Unit Forecast, by Type 2019 & 2032
- Table 83: Global USA Ultrasound Devices Industry Revenue Million Forecast, by Country 2019 & 2032
- Table 84: Global USA Ultrasound Devices Industry Volume K Unit Forecast, by Country 2019 & 2032
- Table 85: Turkey USA Ultrasound Devices Industry Revenue (Million) Forecast, by Application 2019 & 2032
- Table 86: Turkey USA Ultrasound Devices Industry Volume (K Unit) Forecast, by Application 2019 & 2032
- Table 87: Israel USA Ultrasound Devices Industry Revenue (Million) Forecast, by Application 2019 & 2032
- Table 88: Israel USA Ultrasound Devices Industry Volume (K Unit) Forecast, by Application 2019 & 2032
- Table 89: GCC USA Ultrasound Devices Industry Revenue (Million) Forecast, by Application 2019 & 2032
- Table 90: GCC USA Ultrasound Devices Industry Volume (K Unit) Forecast, by Application 2019 & 2032
- Table 91: North Africa USA Ultrasound Devices Industry Revenue (Million) Forecast, by Application 2019 & 2032
- Table 92: North Africa USA Ultrasound Devices Industry Volume (K Unit) Forecast, by Application 2019 & 2032
- Table 93: South Africa USA Ultrasound Devices Industry Revenue (Million) Forecast, by Application 2019 & 2032
- Table 94: South Africa USA Ultrasound Devices Industry Volume (K Unit) Forecast, by Application 2019 & 2032
- Table 95: Rest of Middle East & Africa USA Ultrasound Devices Industry Revenue (Million) Forecast, by Application 2019 & 2032
- Table 96: Rest of Middle East & Africa USA Ultrasound Devices Industry Volume (K Unit) Forecast, by Application 2019 & 2032
- Table 97: Global USA Ultrasound Devices Industry Revenue Million Forecast, by Application 2019 & 2032
- Table 98: Global USA Ultrasound Devices Industry Volume K Unit Forecast, by Application 2019 & 2032
- Table 99: Global USA Ultrasound Devices Industry Revenue Million Forecast, by Technology 2019 & 2032
- Table 100: Global USA Ultrasound Devices Industry Volume K Unit Forecast, by Technology 2019 & 2032
- Table 101: Global USA Ultrasound Devices Industry Revenue Million Forecast, by Type 2019 & 2032
- Table 102: Global USA Ultrasound Devices Industry Volume K Unit Forecast, by Type 2019 & 2032
- Table 103: Global USA Ultrasound Devices Industry Revenue Million Forecast, by Country 2019 & 2032
- Table 104: Global USA Ultrasound Devices Industry Volume K Unit Forecast, by Country 2019 & 2032
- Table 105: China USA Ultrasound Devices Industry Revenue (Million) Forecast, by Application 2019 & 2032
- Table 106: China USA Ultrasound Devices Industry Volume (K Unit) Forecast, by Application 2019 & 2032
- Table 107: India USA Ultrasound Devices Industry Revenue (Million) Forecast, by Application 2019 & 2032
- Table 108: India USA Ultrasound Devices Industry Volume (K Unit) Forecast, by Application 2019 & 2032
- Table 109: Japan USA Ultrasound Devices Industry Revenue (Million) Forecast, by Application 2019 & 2032
- Table 110: Japan USA Ultrasound Devices Industry Volume (K Unit) Forecast, by Application 2019 & 2032
- Table 111: South Korea USA Ultrasound Devices Industry Revenue (Million) Forecast, by Application 2019 & 2032
- Table 112: South Korea USA Ultrasound Devices Industry Volume (K Unit) Forecast, by Application 2019 & 2032
- Table 113: ASEAN USA Ultrasound Devices Industry Revenue (Million) Forecast, by Application 2019 & 2032
- Table 114: ASEAN USA Ultrasound Devices Industry Volume (K Unit) Forecast, by Application 2019 & 2032
- Table 115: Oceania USA Ultrasound Devices Industry Revenue (Million) Forecast, by Application 2019 & 2032
- Table 116: Oceania USA Ultrasound Devices Industry Volume (K Unit) Forecast, by Application 2019 & 2032
- Table 117: Rest of Asia Pacific USA Ultrasound Devices Industry Revenue (Million) Forecast, by Application 2019 & 2032
- Table 118: Rest of Asia Pacific USA Ultrasound Devices Industry Volume (K Unit) Forecast, by Application 2019 & 2032
Frequently Asked Questions
1. What is the projected Compound Annual Growth Rate (CAGR) of the USA Ultrasound Devices Industry?
The projected CAGR is approximately 5.48%.
2. Which companies are prominent players in the USA Ultrasound Devices Industry?
Key companies in the market include Siemens Healthineers, Hologic Inc, GE Healthcare, Samsung Electronics Co Ltd, Mindray Medical International Limited, Koninklijke Philips NV, Canon Medical Systems Corporation, Carestream Health Inc, Esaote SpA, Fujifilm Holdings Corporation.
3. What are the main segments of the USA Ultrasound Devices Industry?
The market segments include Application, Technology, Type.
4. Can you provide details about the market size?
The market size is estimated to be USD 2.95 Million as of 2022.
5. What are some drivers contributing to market growth?
Technological Advancements; Increasing Incidences of Chronic Diseases.
6. What are the notable trends driving market growth?
Anesthesiology is Expected to Witness Rapid Growth.
7. Are there any restraints impacting market growth?
Strict Regulations.
8. Can you provide examples of recent developments in the market?
In March 2022, Royal Philips, a global leader in health technology, announced the launch of Ultrasound Workspace at the American College of Cardiology's Annual Scientific Session & Expo (ACC 2022). This workspace is an vendor-neutral echocardiography image analysis and reporting solution that can be accessed remotely via a browser.
9. What pricing options are available for accessing the report?
Pricing options include single-user, multi-user, and enterprise licenses priced at USD 3800, USD 4500, and USD 5800 respectively.
10. Is the market size provided in terms of value or volume?
The market size is provided in terms of value, measured in Million and volume, measured in K Unit.
11. Are there any specific market keywords associated with the report?
Yes, the market keyword associated with the report is "USA Ultrasound Devices Industry," which aids in identifying and referencing the specific market segment covered.
12. How do I determine which pricing option suits my needs best?
The pricing options vary based on user requirements and access needs. Individual users may opt for single-user licenses, while businesses requiring broader access may choose multi-user or enterprise licenses for cost-effective access to the report.
13. Are there any additional resources or data provided in the USA Ultrasound Devices Industry report?
While the report offers comprehensive insights, it's advisable to review the specific contents or supplementary materials provided to ascertain if additional resources or data are available.
14. How can I stay updated on further developments or reports in the USA Ultrasound Devices Industry?
To stay informed about further developments, trends, and reports in the USA Ultrasound Devices Industry, consider subscribing to industry newsletters, following relevant companies and organizations, or regularly checking reputable industry news sources and publications.
Methodology
Step 1 - Identification of Relevant Samples Size from Population Database


Step 2 - Approaches for Defining Global Market Size (Value, Volume* & Price*)

Note*: In applicable scenarios
Step 3 - Data Sources
Primary Research
- Web Analytics
- Survey Reports
- Research Institute
- Latest Research Reports
- Opinion Leaders
Secondary Research
- Annual Reports
- White Paper
- Latest Press Release
- Industry Association
- Paid Database
- Investor Presentations

Step 4 - Data Triangulation
Involves using different sources of information in order to increase the validity of a study
These sources are likely to be stakeholders in a program - participants, other researchers, program staff, other community members, and so on.
Then we put all data in single framework & apply various statistical tools to find out the dynamic on the market.
During the analysis stage, feedback from the stakeholder groups would be compared to determine areas of agreement as well as areas of divergence


