
Key Insights
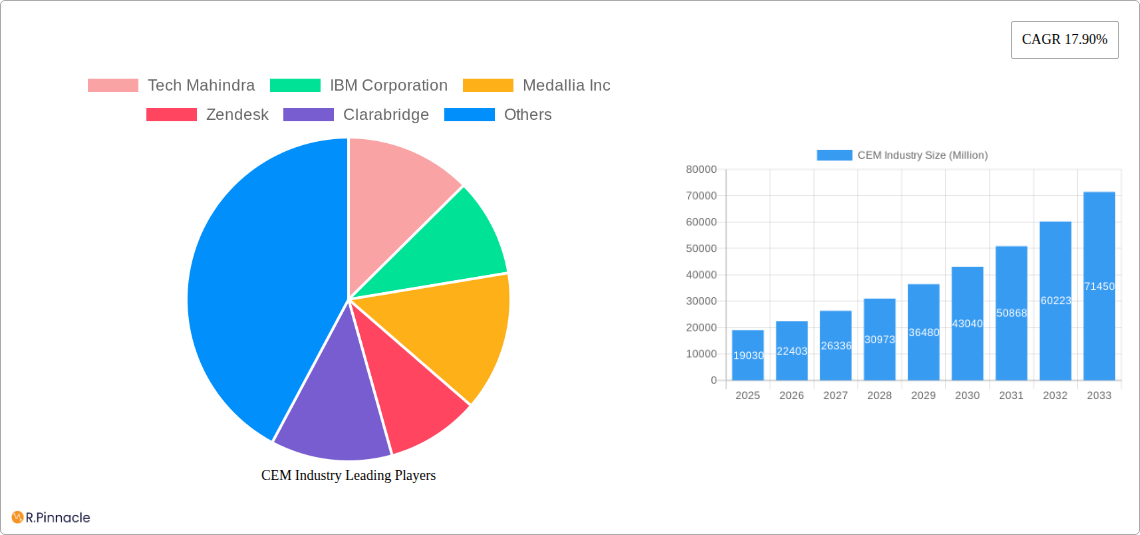
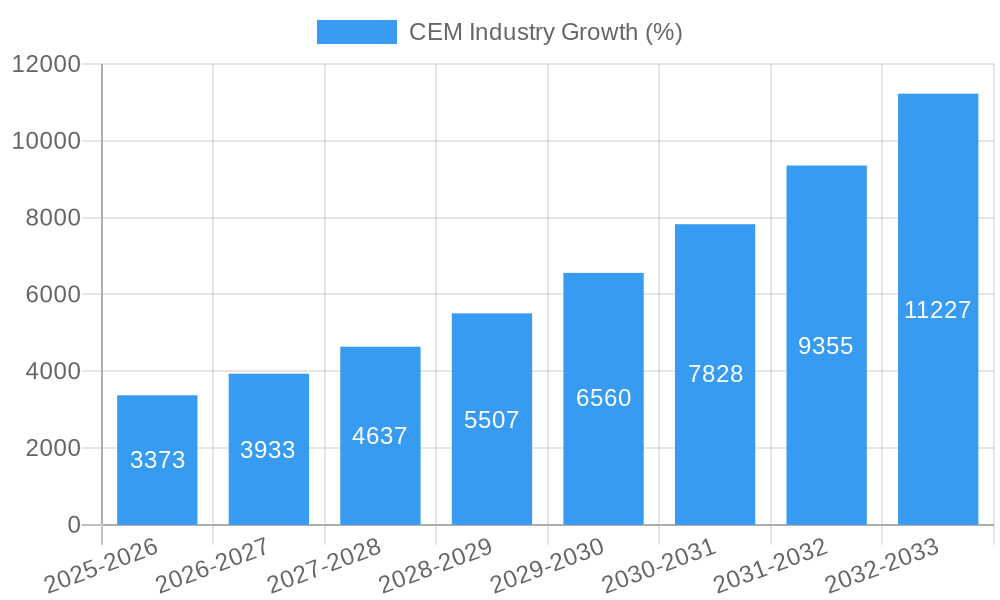
The Customer Experience Management (CEM) market is experiencing robust growth, projected to reach $19.03 billion in 2025 and exhibiting a Compound Annual Growth Rate (CAGR) of 17.90%. This expansion is fueled by several key drivers. The increasing adoption of cloud-based solutions offers scalability and cost-effectiveness, attracting both SMEs and large enterprises. Furthermore, the growing importance of personalized customer experiences, driven by advanced analytics and AI-powered tools, is significantly impacting market growth. Businesses across diverse sectors, including BFSI, retail, and healthcare, are prioritizing CEM to improve customer loyalty, retention, and ultimately, profitability. The shift towards omnichannel strategies, encompassing telephone, email, web, and social media interactions, also necessitates comprehensive CEM solutions. While data privacy concerns and the complexity of integrating different CEM technologies pose some challenges, the overall market trajectory remains strongly positive, driven by the undeniable link between excellent customer experience and business success.
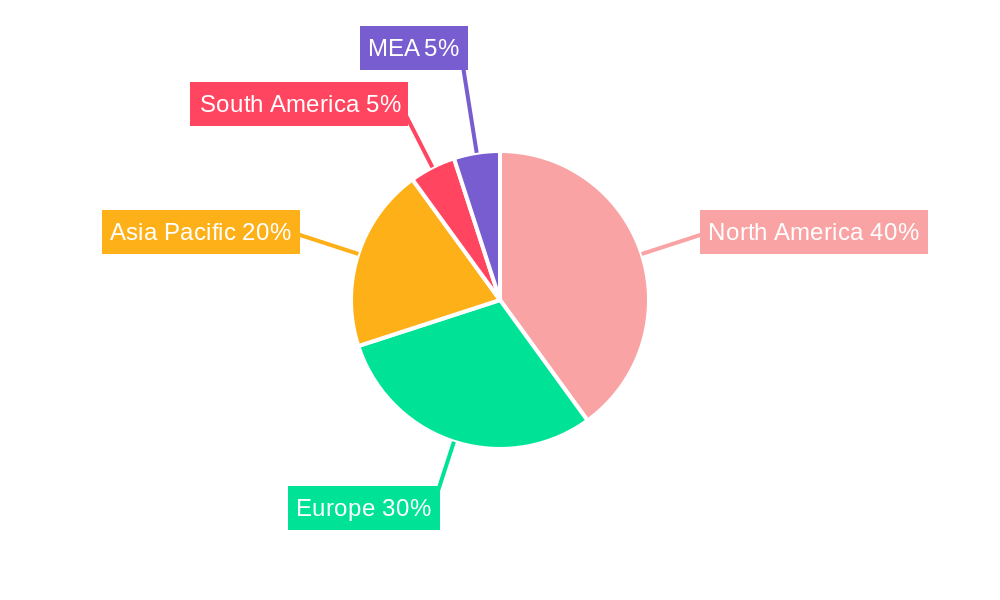
The market segmentation reveals a dynamic landscape. Cloud deployment models are gaining traction over on-premise solutions due to their agility and reduced infrastructure costs. Large enterprises, with their greater resources and need for sophisticated analytics, represent a significant segment, yet SMEs are rapidly adopting CEM tools to compete effectively. Geographically, North America and Europe currently hold the largest market shares, reflecting higher adoption rates and established digital infrastructure. However, Asia Pacific is poised for significant growth, driven by increasing internet penetration and expanding digital economies in countries like India and China. The competitive landscape is characterized by a mix of established players like IBM and Adobe, along with specialized CEM vendors like Medallia and Zendesk, fostering innovation and diverse solution offerings. The forecast period (2025-2033) anticipates continued strong growth, driven by ongoing technological advancements and the ever-increasing customer expectation for seamless and personalized experiences.
Comprehensive CEM Industry Report: 2019-2033
This in-depth report provides a comprehensive analysis of the Customer Experience Management (CEM) industry, offering invaluable insights for industry professionals, investors, and strategists. Covering the period from 2019 to 2033, with a focus on 2025, this report leverages extensive market research to deliver actionable intelligence. The report projects a market valued at $XX Million in 2025, with a Compound Annual Growth Rate (CAGR) of XX% from 2025 to 2033, reaching an estimated $XX Million by 2033.
CEM Industry Market Structure & Innovation Trends
This section analyzes the competitive landscape, innovation drivers, and regulatory factors shaping the CEM market. The market exhibits moderate concentration, with key players like Tech Mahindra, IBM Corporation, Medallia Inc, Zendesk, and Clarabridge holding significant market share. However, smaller, specialized firms are also contributing to innovation.
- Market Concentration: The top 5 players collectively hold approximately XX% of the market share in 2025.
- Innovation Drivers: Artificial intelligence (AI), machine learning (ML), big data analytics, and the increasing adoption of cloud-based solutions are driving innovation.
- Regulatory Frameworks: Data privacy regulations (GDPR, CCPA) significantly influence CEM strategies and solution development.
- Product Substitutes: While direct substitutes are limited, companies offering CRM and other customer relationship tools indirectly compete with CEM solutions.
- End-User Demographics: Large enterprises are the primary consumers, followed by SMEs, with varied adoption rates across industries.
- M&A Activities: The CEM industry has witnessed significant M&A activity in recent years, with deal values exceeding $XX Million in the period 2019-2024. These acquisitions are primarily driven by expanding product portfolios and market reach.
CEM Industry Market Dynamics & Trends
The CEM market is experiencing robust growth, propelled by several key factors. The increasing focus on customer centricity across industries, the rising adoption of digital channels, and advancements in data analytics are driving market expansion. The shift towards cloud-based deployments, fueled by scalability and cost-effectiveness, is further accelerating market growth. Competitive dynamics are intense, with established players and emerging startups vying for market share through product innovation, strategic partnerships, and aggressive pricing strategies. Market penetration is expected to increase significantly in the forecast period, especially in emerging markets.
Dominant Regions & Segments in CEM Industry
The North American region currently dominates the CEM market, driven by high technology adoption, robust digital infrastructure, and the presence of major players. However, the Asia-Pacific region is anticipated to witness substantial growth in the coming years, fueled by economic expansion and increasing digitalization.
Key Drivers:
- North America: High technological advancement, strong digital infrastructure, and high customer expectation drives market growth.
- Europe: Stringent data privacy regulations and a focus on customer experience innovation contribute to steady growth.
- Asia-Pacific: Rapid digitalization, expanding middle class, and increasing smartphone penetration are major drivers.
Dominant Segments:
- Component: Solutions segment leads with XX% market share due to increasing demand for advanced analytics and AI-powered capabilities.
- Service: Services contributes significantly, driven by the need for implementation, integration, and ongoing support.
- Deployment: Cloud deployment is the fastest-growing segment due to scalability, cost-effectiveness, and flexibility.
- Organization Size: Large enterprises dominate the market, though SME adoption is increasing.
- Touchpoint: Web and email remain the most dominant touchpoints, but social media adoption is rapidly rising.
- Application: BFSI and retail sectors are leading adopters of CEM solutions.
CEM Industry Product Innovations
Recent product innovations focus on AI-powered personalization, predictive analytics, and omnichannel integration. These advancements enable businesses to deliver highly customized customer experiences across multiple touchpoints. The integration of AI and ML into CEM platforms is enhancing capabilities for real-time customer feedback analysis, leading to faster response times and improved customer satisfaction. The market fit is strong, given the increasing demand for efficient and effective customer management.
Report Scope & Segmentation Analysis
This report segments the CEM market by component (solutions, services), deployment (cloud, on-premise), organization size (SMEs, large enterprises), touchpoint (telephone, email, web, social media, other), and application (BFSI, retail, IT & telecommunication, healthcare, manufacturing, government, travel & transportation, other). Each segment’s growth trajectory, market size, and competitive dynamics are analyzed in detail. Growth projections show significant potential across all segments, particularly in cloud-based solutions and emerging applications like healthcare and government.
Key Drivers of CEM Industry Growth
Several factors are driving the CEM industry's expansion. These include:
- Technological advancements: AI, ML, and big data analytics are enhancing CEM capabilities, enabling personalized experiences.
- Growing customer expectations: Consumers demand seamless and personalized interactions across channels, driving CEM adoption.
- Increased competition: Businesses are leveraging CEM to improve customer loyalty and gain a competitive edge.
- Stringent data privacy regulations: Compliance needs are driving investment in secure and compliant CEM solutions.
Challenges in the CEM Industry Sector
The CEM industry faces several challenges, including:
- Data security and privacy concerns: Protecting sensitive customer data is paramount, posing significant security challenges.
- Integration complexities: Integrating CEM solutions with existing systems can be complex and time-consuming.
- High implementation costs: The cost of deploying and maintaining CEM solutions can be substantial, especially for SMEs.
- Lack of skilled professionals: A shortage of professionals with expertise in data analytics and CEM technologies limits adoption.
Emerging Opportunities in CEM Industry
Several emerging opportunities exist for CEM providers, including:
- Expansion into new markets: Untapped potential exists in developing economies and emerging sectors.
- Development of innovative solutions: New technologies such as IoT and blockchain offer opportunities for enhanced CEM capabilities.
- Focus on specific industry verticals: Tailoring CEM solutions to meet the unique needs of specific industries can unlock significant growth.
Leading Players in the CEM Industry Market
- Tech Mahindra
- IBM Corporation
- Medallia Inc
- Zendesk
- Clarabridge
- Adobe Inc
- Avaya Inc
- Verint Systems Inc
- Oracle Corporation
- Open Text Corporation
- MaritzCX Research LLC
- Sitecore
- SAP SE
Key Developments in CEM Industry
- June 2022: Kyndryl partners with Oracle to offer managed cloud solutions, accelerating cloud adoption for businesses globally.
- March 2022: Adobe expands partnership with BMW Group, leveraging Adobe Experience Cloud for enhanced customer experiences and online sales.
Future Outlook for CEM Industry Market
The CEM industry is poised for continued growth, driven by technological advancements, increasing customer expectations, and the growing adoption of cloud-based solutions. Strategic partnerships, innovative product development, and a focus on data security will be crucial for success in this dynamic market. The focus on personalized, omnichannel experiences will continue to shape the industry's evolution.
CEM Industry Segmentation
-
1. Component
- 1.1. Solutions
- 1.2. Services
-
2. Deployment
- 2.1. Cloud
- 2.2. On-premise
-
3. Organization Size
- 3.1. Small and Medium Enterprises (SMEs)
- 3.2. Large Enterprises
-
4. Touchpoint
- 4.1. Telephone
- 4.2. Email
- 4.3. Web
- 4.4. Social Media
- 4.5. Other Touchpoints
-
5. Application
- 5.1. BFSI
- 5.2. Retail
- 5.3. IT and Telecommunication
- 5.4. Healthcare
- 5.5. Manufacturing
- 5.6. Government
- 5.7. Travel and Transportation
- 5.8. Other Applications
CEM Industry Segmentation By Geography
- 1. North America
- 2. Europe
- 3. Asia Pacific
- 4. Latin America
- 5. Middle East
CEM Industry REPORT HIGHLIGHTS
| Aspects | Details |
|---|---|
| Study Period | 2019-2033 |
| Base Year | 2024 |
| Estimated Year | 2025 |
| Forecast Period | 2025-2033 |
| Historical Period | 2019-2024 |
| Growth Rate | CAGR of 17.90% from 2019-2033 |
| Segmentation |
|
Table of Contents
- 1. Introduction
- 1.1. Research Scope
- 1.2. Market Segmentation
- 1.3. Research Methodology
- 1.4. Definitions and Assumptions
- 2. Executive Summary
- 2.1. Introduction
- 3. Market Dynamics
- 3.1. Introduction
- 3.2. Market Drivers
- 3.2.1 Rapid Adoption of Cloud-based Technology
- 3.2.2 Advanced Analytics
- 3.2.3 and Automation; Growing Demand for Personalized Customer Experience
- 3.3. Market Restrains
- 3.3.1. Privacy and Data Security Issues
- 3.4. Market Trends
- 3.4.1 Rapid Adoption of Cloud-based Technology
- 3.4.2 Advanced Analytics
- 3.4.3 and Automation
- 4. Market Factor Analysis
- 4.1. Porters Five Forces
- 4.2. Supply/Value Chain
- 4.3. PESTEL analysis
- 4.4. Market Entropy
- 4.5. Patent/Trademark Analysis
- 5. Global CEM Industry Analysis, Insights and Forecast, 2019-2031
- 5.1. Market Analysis, Insights and Forecast - by Component
- 5.1.1. Solutions
- 5.1.2. Services
- 5.2. Market Analysis, Insights and Forecast - by Deployment
- 5.2.1. Cloud
- 5.2.2. On-premise
- 5.3. Market Analysis, Insights and Forecast - by Organization Size
- 5.3.1. Small and Medium Enterprises (SMEs)
- 5.3.2. Large Enterprises
- 5.4. Market Analysis, Insights and Forecast - by Touchpoint
- 5.4.1. Telephone
- 5.4.2. Email
- 5.4.3. Web
- 5.4.4. Social Media
- 5.4.5. Other Touchpoints
- 5.5. Market Analysis, Insights and Forecast - by Application
- 5.5.1. BFSI
- 5.5.2. Retail
- 5.5.3. IT and Telecommunication
- 5.5.4. Healthcare
- 5.5.5. Manufacturing
- 5.5.6. Government
- 5.5.7. Travel and Transportation
- 5.5.8. Other Applications
- 5.6. Market Analysis, Insights and Forecast - by Region
- 5.6.1. North America
- 5.6.2. Europe
- 5.6.3. Asia Pacific
- 5.6.4. Latin America
- 5.6.5. Middle East
- 5.1. Market Analysis, Insights and Forecast - by Component
- 6. North America CEM Industry Analysis, Insights and Forecast, 2019-2031
- 6.1. Market Analysis, Insights and Forecast - by Component
- 6.1.1. Solutions
- 6.1.2. Services
- 6.2. Market Analysis, Insights and Forecast - by Deployment
- 6.2.1. Cloud
- 6.2.2. On-premise
- 6.3. Market Analysis, Insights and Forecast - by Organization Size
- 6.3.1. Small and Medium Enterprises (SMEs)
- 6.3.2. Large Enterprises
- 6.4. Market Analysis, Insights and Forecast - by Touchpoint
- 6.4.1. Telephone
- 6.4.2. Email
- 6.4.3. Web
- 6.4.4. Social Media
- 6.4.5. Other Touchpoints
- 6.5. Market Analysis, Insights and Forecast - by Application
- 6.5.1. BFSI
- 6.5.2. Retail
- 6.5.3. IT and Telecommunication
- 6.5.4. Healthcare
- 6.5.5. Manufacturing
- 6.5.6. Government
- 6.5.7. Travel and Transportation
- 6.5.8. Other Applications
- 6.1. Market Analysis, Insights and Forecast - by Component
- 7. Europe CEM Industry Analysis, Insights and Forecast, 2019-2031
- 7.1. Market Analysis, Insights and Forecast - by Component
- 7.1.1. Solutions
- 7.1.2. Services
- 7.2. Market Analysis, Insights and Forecast - by Deployment
- 7.2.1. Cloud
- 7.2.2. On-premise
- 7.3. Market Analysis, Insights and Forecast - by Organization Size
- 7.3.1. Small and Medium Enterprises (SMEs)
- 7.3.2. Large Enterprises
- 7.4. Market Analysis, Insights and Forecast - by Touchpoint
- 7.4.1. Telephone
- 7.4.2. Email
- 7.4.3. Web
- 7.4.4. Social Media
- 7.4.5. Other Touchpoints
- 7.5. Market Analysis, Insights and Forecast - by Application
- 7.5.1. BFSI
- 7.5.2. Retail
- 7.5.3. IT and Telecommunication
- 7.5.4. Healthcare
- 7.5.5. Manufacturing
- 7.5.6. Government
- 7.5.7. Travel and Transportation
- 7.5.8. Other Applications
- 7.1. Market Analysis, Insights and Forecast - by Component
- 8. Asia Pacific CEM Industry Analysis, Insights and Forecast, 2019-2031
- 8.1. Market Analysis, Insights and Forecast - by Component
- 8.1.1. Solutions
- 8.1.2. Services
- 8.2. Market Analysis, Insights and Forecast - by Deployment
- 8.2.1. Cloud
- 8.2.2. On-premise
- 8.3. Market Analysis, Insights and Forecast - by Organization Size
- 8.3.1. Small and Medium Enterprises (SMEs)
- 8.3.2. Large Enterprises
- 8.4. Market Analysis, Insights and Forecast - by Touchpoint
- 8.4.1. Telephone
- 8.4.2. Email
- 8.4.3. Web
- 8.4.4. Social Media
- 8.4.5. Other Touchpoints
- 8.5. Market Analysis, Insights and Forecast - by Application
- 8.5.1. BFSI
- 8.5.2. Retail
- 8.5.3. IT and Telecommunication
- 8.5.4. Healthcare
- 8.5.5. Manufacturing
- 8.5.6. Government
- 8.5.7. Travel and Transportation
- 8.5.8. Other Applications
- 8.1. Market Analysis, Insights and Forecast - by Component
- 9. Latin America CEM Industry Analysis, Insights and Forecast, 2019-2031
- 9.1. Market Analysis, Insights and Forecast - by Component
- 9.1.1. Solutions
- 9.1.2. Services
- 9.2. Market Analysis, Insights and Forecast - by Deployment
- 9.2.1. Cloud
- 9.2.2. On-premise
- 9.3. Market Analysis, Insights and Forecast - by Organization Size
- 9.3.1. Small and Medium Enterprises (SMEs)
- 9.3.2. Large Enterprises
- 9.4. Market Analysis, Insights and Forecast - by Touchpoint
- 9.4.1. Telephone
- 9.4.2. Email
- 9.4.3. Web
- 9.4.4. Social Media
- 9.4.5. Other Touchpoints
- 9.5. Market Analysis, Insights and Forecast - by Application
- 9.5.1. BFSI
- 9.5.2. Retail
- 9.5.3. IT and Telecommunication
- 9.5.4. Healthcare
- 9.5.5. Manufacturing
- 9.5.6. Government
- 9.5.7. Travel and Transportation
- 9.5.8. Other Applications
- 9.1. Market Analysis, Insights and Forecast - by Component
- 10. Middle East CEM Industry Analysis, Insights and Forecast, 2019-2031
- 10.1. Market Analysis, Insights and Forecast - by Component
- 10.1.1. Solutions
- 10.1.2. Services
- 10.2. Market Analysis, Insights and Forecast - by Deployment
- 10.2.1. Cloud
- 10.2.2. On-premise
- 10.3. Market Analysis, Insights and Forecast - by Organization Size
- 10.3.1. Small and Medium Enterprises (SMEs)
- 10.3.2. Large Enterprises
- 10.4. Market Analysis, Insights and Forecast - by Touchpoint
- 10.4.1. Telephone
- 10.4.2. Email
- 10.4.3. Web
- 10.4.4. Social Media
- 10.4.5. Other Touchpoints
- 10.5. Market Analysis, Insights and Forecast - by Application
- 10.5.1. BFSI
- 10.5.2. Retail
- 10.5.3. IT and Telecommunication
- 10.5.4. Healthcare
- 10.5.5. Manufacturing
- 10.5.6. Government
- 10.5.7. Travel and Transportation
- 10.5.8. Other Applications
- 10.1. Market Analysis, Insights and Forecast - by Component
- 11. North America CEM Industry Analysis, Insights and Forecast, 2019-2031
- 11.1. Market Analysis, Insights and Forecast - By Country/Sub-region
- 11.1.1 United States
- 11.1.2 Canada
- 11.1.3 Mexico
- 12. Europe CEM Industry Analysis, Insights and Forecast, 2019-2031
- 12.1. Market Analysis, Insights and Forecast - By Country/Sub-region
- 12.1.1 Germany
- 12.1.2 United Kingdom
- 12.1.3 France
- 12.1.4 Spain
- 12.1.5 Italy
- 12.1.6 Spain
- 12.1.7 Belgium
- 12.1.8 Netherland
- 12.1.9 Nordics
- 12.1.10 Rest of Europe
- 13. Asia Pacific CEM Industry Analysis, Insights and Forecast, 2019-2031
- 13.1. Market Analysis, Insights and Forecast - By Country/Sub-region
- 13.1.1 China
- 13.1.2 Japan
- 13.1.3 India
- 13.1.4 South Korea
- 13.1.5 Southeast Asia
- 13.1.6 Australia
- 13.1.7 Indonesia
- 13.1.8 Phillipes
- 13.1.9 Singapore
- 13.1.10 Thailandc
- 13.1.11 Rest of Asia Pacific
- 14. South America CEM Industry Analysis, Insights and Forecast, 2019-2031
- 14.1. Market Analysis, Insights and Forecast - By Country/Sub-region
- 14.1.1 Brazil
- 14.1.2 Argentina
- 14.1.3 Peru
- 14.1.4 Chile
- 14.1.5 Colombia
- 14.1.6 Ecuador
- 14.1.7 Venezuela
- 14.1.8 Rest of South America
- 15. North America CEM Industry Analysis, Insights and Forecast, 2019-2031
- 15.1. Market Analysis, Insights and Forecast - By Country/Sub-region
- 15.1.1 United States
- 15.1.2 Canada
- 15.1.3 Mexico
- 16. MEA CEM Industry Analysis, Insights and Forecast, 2019-2031
- 16.1. Market Analysis, Insights and Forecast - By Country/Sub-region
- 16.1.1 United Arab Emirates
- 16.1.2 Saudi Arabia
- 16.1.3 South Africa
- 16.1.4 Rest of Middle East and Africa
- 17. Competitive Analysis
- 17.1. Global Market Share Analysis 2024
- 17.2. Company Profiles
- 17.2.1 Tech Mahindra
- 17.2.1.1. Overview
- 17.2.1.2. Products
- 17.2.1.3. SWOT Analysis
- 17.2.1.4. Recent Developments
- 17.2.1.5. Financials (Based on Availability)
- 17.2.2 IBM Corporation
- 17.2.2.1. Overview
- 17.2.2.2. Products
- 17.2.2.3. SWOT Analysis
- 17.2.2.4. Recent Developments
- 17.2.2.5. Financials (Based on Availability)
- 17.2.3 Medallia Inc
- 17.2.3.1. Overview
- 17.2.3.2. Products
- 17.2.3.3. SWOT Analysis
- 17.2.3.4. Recent Developments
- 17.2.3.5. Financials (Based on Availability)
- 17.2.4 Zendesk
- 17.2.4.1. Overview
- 17.2.4.2. Products
- 17.2.4.3. SWOT Analysis
- 17.2.4.4. Recent Developments
- 17.2.4.5. Financials (Based on Availability)
- 17.2.5 Clarabridge
- 17.2.5.1. Overview
- 17.2.5.2. Products
- 17.2.5.3. SWOT Analysis
- 17.2.5.4. Recent Developments
- 17.2.5.5. Financials (Based on Availability)
- 17.2.6 Adobe Inc
- 17.2.6.1. Overview
- 17.2.6.2. Products
- 17.2.6.3. SWOT Analysis
- 17.2.6.4. Recent Developments
- 17.2.6.5. Financials (Based on Availability)
- 17.2.7 Avaya Inc
- 17.2.7.1. Overview
- 17.2.7.2. Products
- 17.2.7.3. SWOT Analysis
- 17.2.7.4. Recent Developments
- 17.2.7.5. Financials (Based on Availability)
- 17.2.8 Verint Systems Inc
- 17.2.8.1. Overview
- 17.2.8.2. Products
- 17.2.8.3. SWOT Analysis
- 17.2.8.4. Recent Developments
- 17.2.8.5. Financials (Based on Availability)
- 17.2.9 Oracle Corporation
- 17.2.9.1. Overview
- 17.2.9.2. Products
- 17.2.9.3. SWOT Analysis
- 17.2.9.4. Recent Developments
- 17.2.9.5. Financials (Based on Availability)
- 17.2.10 Open Text Corporation
- 17.2.10.1. Overview
- 17.2.10.2. Products
- 17.2.10.3. SWOT Analysis
- 17.2.10.4. Recent Developments
- 17.2.10.5. Financials (Based on Availability)
- 17.2.11 MaritzCX Research LLC
- 17.2.11.1. Overview
- 17.2.11.2. Products
- 17.2.11.3. SWOT Analysis
- 17.2.11.4. Recent Developments
- 17.2.11.5. Financials (Based on Availability)
- 17.2.12 Sitecore
- 17.2.12.1. Overview
- 17.2.12.2. Products
- 17.2.12.3. SWOT Analysis
- 17.2.12.4. Recent Developments
- 17.2.12.5. Financials (Based on Availability)
- 17.2.13 SAP SE
- 17.2.13.1. Overview
- 17.2.13.2. Products
- 17.2.13.3. SWOT Analysis
- 17.2.13.4. Recent Developments
- 17.2.13.5. Financials (Based on Availability)
- 17.2.1 Tech Mahindra
List of Figures
- Figure 1: Global CEM Industry Revenue Breakdown (Million, %) by Region 2024 & 2032
- Figure 2: Global CEM Industry Volume Breakdown (K Unit, %) by Region 2024 & 2032
- Figure 3: North America CEM Industry Revenue (Million), by Country 2024 & 2032
- Figure 4: North America CEM Industry Volume (K Unit), by Country 2024 & 2032
- Figure 5: North America CEM Industry Revenue Share (%), by Country 2024 & 2032
- Figure 6: North America CEM Industry Volume Share (%), by Country 2024 & 2032
- Figure 7: Europe CEM Industry Revenue (Million), by Country 2024 & 2032
- Figure 8: Europe CEM Industry Volume (K Unit), by Country 2024 & 2032
- Figure 9: Europe CEM Industry Revenue Share (%), by Country 2024 & 2032
- Figure 10: Europe CEM Industry Volume Share (%), by Country 2024 & 2032
- Figure 11: Asia Pacific CEM Industry Revenue (Million), by Country 2024 & 2032
- Figure 12: Asia Pacific CEM Industry Volume (K Unit), by Country 2024 & 2032
- Figure 13: Asia Pacific CEM Industry Revenue Share (%), by Country 2024 & 2032
- Figure 14: Asia Pacific CEM Industry Volume Share (%), by Country 2024 & 2032
- Figure 15: South America CEM Industry Revenue (Million), by Country 2024 & 2032
- Figure 16: South America CEM Industry Volume (K Unit), by Country 2024 & 2032
- Figure 17: South America CEM Industry Revenue Share (%), by Country 2024 & 2032
- Figure 18: South America CEM Industry Volume Share (%), by Country 2024 & 2032
- Figure 19: North America CEM Industry Revenue (Million), by Country 2024 & 2032
- Figure 20: North America CEM Industry Volume (K Unit), by Country 2024 & 2032
- Figure 21: North America CEM Industry Revenue Share (%), by Country 2024 & 2032
- Figure 22: North America CEM Industry Volume Share (%), by Country 2024 & 2032
- Figure 23: MEA CEM Industry Revenue (Million), by Country 2024 & 2032
- Figure 24: MEA CEM Industry Volume (K Unit), by Country 2024 & 2032
- Figure 25: MEA CEM Industry Revenue Share (%), by Country 2024 & 2032
- Figure 26: MEA CEM Industry Volume Share (%), by Country 2024 & 2032
- Figure 27: North America CEM Industry Revenue (Million), by Component 2024 & 2032
- Figure 28: North America CEM Industry Volume (K Unit), by Component 2024 & 2032
- Figure 29: North America CEM Industry Revenue Share (%), by Component 2024 & 2032
- Figure 30: North America CEM Industry Volume Share (%), by Component 2024 & 2032
- Figure 31: North America CEM Industry Revenue (Million), by Deployment 2024 & 2032
- Figure 32: North America CEM Industry Volume (K Unit), by Deployment 2024 & 2032
- Figure 33: North America CEM Industry Revenue Share (%), by Deployment 2024 & 2032
- Figure 34: North America CEM Industry Volume Share (%), by Deployment 2024 & 2032
- Figure 35: North America CEM Industry Revenue (Million), by Organization Size 2024 & 2032
- Figure 36: North America CEM Industry Volume (K Unit), by Organization Size 2024 & 2032
- Figure 37: North America CEM Industry Revenue Share (%), by Organization Size 2024 & 2032
- Figure 38: North America CEM Industry Volume Share (%), by Organization Size 2024 & 2032
- Figure 39: North America CEM Industry Revenue (Million), by Touchpoint 2024 & 2032
- Figure 40: North America CEM Industry Volume (K Unit), by Touchpoint 2024 & 2032
- Figure 41: North America CEM Industry Revenue Share (%), by Touchpoint 2024 & 2032
- Figure 42: North America CEM Industry Volume Share (%), by Touchpoint 2024 & 2032
- Figure 43: North America CEM Industry Revenue (Million), by Application 2024 & 2032
- Figure 44: North America CEM Industry Volume (K Unit), by Application 2024 & 2032
- Figure 45: North America CEM Industry Revenue Share (%), by Application 2024 & 2032
- Figure 46: North America CEM Industry Volume Share (%), by Application 2024 & 2032
- Figure 47: North America CEM Industry Revenue (Million), by Country 2024 & 2032
- Figure 48: North America CEM Industry Volume (K Unit), by Country 2024 & 2032
- Figure 49: North America CEM Industry Revenue Share (%), by Country 2024 & 2032
- Figure 50: North America CEM Industry Volume Share (%), by Country 2024 & 2032
- Figure 51: Europe CEM Industry Revenue (Million), by Component 2024 & 2032
- Figure 52: Europe CEM Industry Volume (K Unit), by Component 2024 & 2032
- Figure 53: Europe CEM Industry Revenue Share (%), by Component 2024 & 2032
- Figure 54: Europe CEM Industry Volume Share (%), by Component 2024 & 2032
- Figure 55: Europe CEM Industry Revenue (Million), by Deployment 2024 & 2032
- Figure 56: Europe CEM Industry Volume (K Unit), by Deployment 2024 & 2032
- Figure 57: Europe CEM Industry Revenue Share (%), by Deployment 2024 & 2032
- Figure 58: Europe CEM Industry Volume Share (%), by Deployment 2024 & 2032
- Figure 59: Europe CEM Industry Revenue (Million), by Organization Size 2024 & 2032
- Figure 60: Europe CEM Industry Volume (K Unit), by Organization Size 2024 & 2032
- Figure 61: Europe CEM Industry Revenue Share (%), by Organization Size 2024 & 2032
- Figure 62: Europe CEM Industry Volume Share (%), by Organization Size 2024 & 2032
- Figure 63: Europe CEM Industry Revenue (Million), by Touchpoint 2024 & 2032
- Figure 64: Europe CEM Industry Volume (K Unit), by Touchpoint 2024 & 2032
- Figure 65: Europe CEM Industry Revenue Share (%), by Touchpoint 2024 & 2032
- Figure 66: Europe CEM Industry Volume Share (%), by Touchpoint 2024 & 2032
- Figure 67: Europe CEM Industry Revenue (Million), by Application 2024 & 2032
- Figure 68: Europe CEM Industry Volume (K Unit), by Application 2024 & 2032
- Figure 69: Europe CEM Industry Revenue Share (%), by Application 2024 & 2032
- Figure 70: Europe CEM Industry Volume Share (%), by Application 2024 & 2032
- Figure 71: Europe CEM Industry Revenue (Million), by Country 2024 & 2032
- Figure 72: Europe CEM Industry Volume (K Unit), by Country 2024 & 2032
- Figure 73: Europe CEM Industry Revenue Share (%), by Country 2024 & 2032
- Figure 74: Europe CEM Industry Volume Share (%), by Country 2024 & 2032
- Figure 75: Asia Pacific CEM Industry Revenue (Million), by Component 2024 & 2032
- Figure 76: Asia Pacific CEM Industry Volume (K Unit), by Component 2024 & 2032
- Figure 77: Asia Pacific CEM Industry Revenue Share (%), by Component 2024 & 2032
- Figure 78: Asia Pacific CEM Industry Volume Share (%), by Component 2024 & 2032
- Figure 79: Asia Pacific CEM Industry Revenue (Million), by Deployment 2024 & 2032
- Figure 80: Asia Pacific CEM Industry Volume (K Unit), by Deployment 2024 & 2032
- Figure 81: Asia Pacific CEM Industry Revenue Share (%), by Deployment 2024 & 2032
- Figure 82: Asia Pacific CEM Industry Volume Share (%), by Deployment 2024 & 2032
- Figure 83: Asia Pacific CEM Industry Revenue (Million), by Organization Size 2024 & 2032
- Figure 84: Asia Pacific CEM Industry Volume (K Unit), by Organization Size 2024 & 2032
- Figure 85: Asia Pacific CEM Industry Revenue Share (%), by Organization Size 2024 & 2032
- Figure 86: Asia Pacific CEM Industry Volume Share (%), by Organization Size 2024 & 2032
- Figure 87: Asia Pacific CEM Industry Revenue (Million), by Touchpoint 2024 & 2032
- Figure 88: Asia Pacific CEM Industry Volume (K Unit), by Touchpoint 2024 & 2032
- Figure 89: Asia Pacific CEM Industry Revenue Share (%), by Touchpoint 2024 & 2032
- Figure 90: Asia Pacific CEM Industry Volume Share (%), by Touchpoint 2024 & 2032
- Figure 91: Asia Pacific CEM Industry Revenue (Million), by Application 2024 & 2032
- Figure 92: Asia Pacific CEM Industry Volume (K Unit), by Application 2024 & 2032
- Figure 93: Asia Pacific CEM Industry Revenue Share (%), by Application 2024 & 2032
- Figure 94: Asia Pacific CEM Industry Volume Share (%), by Application 2024 & 2032
- Figure 95: Asia Pacific CEM Industry Revenue (Million), by Country 2024 & 2032
- Figure 96: Asia Pacific CEM Industry Volume (K Unit), by Country 2024 & 2032
- Figure 97: Asia Pacific CEM Industry Revenue Share (%), by Country 2024 & 2032
- Figure 98: Asia Pacific CEM Industry Volume Share (%), by Country 2024 & 2032
- Figure 99: Latin America CEM Industry Revenue (Million), by Component 2024 & 2032
- Figure 100: Latin America CEM Industry Volume (K Unit), by Component 2024 & 2032
- Figure 101: Latin America CEM Industry Revenue Share (%), by Component 2024 & 2032
- Figure 102: Latin America CEM Industry Volume Share (%), by Component 2024 & 2032
- Figure 103: Latin America CEM Industry Revenue (Million), by Deployment 2024 & 2032
- Figure 104: Latin America CEM Industry Volume (K Unit), by Deployment 2024 & 2032
- Figure 105: Latin America CEM Industry Revenue Share (%), by Deployment 2024 & 2032
- Figure 106: Latin America CEM Industry Volume Share (%), by Deployment 2024 & 2032
- Figure 107: Latin America CEM Industry Revenue (Million), by Organization Size 2024 & 2032
- Figure 108: Latin America CEM Industry Volume (K Unit), by Organization Size 2024 & 2032
- Figure 109: Latin America CEM Industry Revenue Share (%), by Organization Size 2024 & 2032
- Figure 110: Latin America CEM Industry Volume Share (%), by Organization Size 2024 & 2032
- Figure 111: Latin America CEM Industry Revenue (Million), by Touchpoint 2024 & 2032
- Figure 112: Latin America CEM Industry Volume (K Unit), by Touchpoint 2024 & 2032
- Figure 113: Latin America CEM Industry Revenue Share (%), by Touchpoint 2024 & 2032
- Figure 114: Latin America CEM Industry Volume Share (%), by Touchpoint 2024 & 2032
- Figure 115: Latin America CEM Industry Revenue (Million), by Application 2024 & 2032
- Figure 116: Latin America CEM Industry Volume (K Unit), by Application 2024 & 2032
- Figure 117: Latin America CEM Industry Revenue Share (%), by Application 2024 & 2032
- Figure 118: Latin America CEM Industry Volume Share (%), by Application 2024 & 2032
- Figure 119: Latin America CEM Industry Revenue (Million), by Country 2024 & 2032
- Figure 120: Latin America CEM Industry Volume (K Unit), by Country 2024 & 2032
- Figure 121: Latin America CEM Industry Revenue Share (%), by Country 2024 & 2032
- Figure 122: Latin America CEM Industry Volume Share (%), by Country 2024 & 2032
- Figure 123: Middle East CEM Industry Revenue (Million), by Component 2024 & 2032
- Figure 124: Middle East CEM Industry Volume (K Unit), by Component 2024 & 2032
- Figure 125: Middle East CEM Industry Revenue Share (%), by Component 2024 & 2032
- Figure 126: Middle East CEM Industry Volume Share (%), by Component 2024 & 2032
- Figure 127: Middle East CEM Industry Revenue (Million), by Deployment 2024 & 2032
- Figure 128: Middle East CEM Industry Volume (K Unit), by Deployment 2024 & 2032
- Figure 129: Middle East CEM Industry Revenue Share (%), by Deployment 2024 & 2032
- Figure 130: Middle East CEM Industry Volume Share (%), by Deployment 2024 & 2032
- Figure 131: Middle East CEM Industry Revenue (Million), by Organization Size 2024 & 2032
- Figure 132: Middle East CEM Industry Volume (K Unit), by Organization Size 2024 & 2032
- Figure 133: Middle East CEM Industry Revenue Share (%), by Organization Size 2024 & 2032
- Figure 134: Middle East CEM Industry Volume Share (%), by Organization Size 2024 & 2032
- Figure 135: Middle East CEM Industry Revenue (Million), by Touchpoint 2024 & 2032
- Figure 136: Middle East CEM Industry Volume (K Unit), by Touchpoint 2024 & 2032
- Figure 137: Middle East CEM Industry Revenue Share (%), by Touchpoint 2024 & 2032
- Figure 138: Middle East CEM Industry Volume Share (%), by Touchpoint 2024 & 2032
- Figure 139: Middle East CEM Industry Revenue (Million), by Application 2024 & 2032
- Figure 140: Middle East CEM Industry Volume (K Unit), by Application 2024 & 2032
- Figure 141: Middle East CEM Industry Revenue Share (%), by Application 2024 & 2032
- Figure 142: Middle East CEM Industry Volume Share (%), by Application 2024 & 2032
- Figure 143: Middle East CEM Industry Revenue (Million), by Country 2024 & 2032
- Figure 144: Middle East CEM Industry Volume (K Unit), by Country 2024 & 2032
- Figure 145: Middle East CEM Industry Revenue Share (%), by Country 2024 & 2032
- Figure 146: Middle East CEM Industry Volume Share (%), by Country 2024 & 2032
List of Tables
- Table 1: Global CEM Industry Revenue Million Forecast, by Region 2019 & 2032
- Table 2: Global CEM Industry Volume K Unit Forecast, by Region 2019 & 2032
- Table 3: Global CEM Industry Revenue Million Forecast, by Component 2019 & 2032
- Table 4: Global CEM Industry Volume K Unit Forecast, by Component 2019 & 2032
- Table 5: Global CEM Industry Revenue Million Forecast, by Deployment 2019 & 2032
- Table 6: Global CEM Industry Volume K Unit Forecast, by Deployment 2019 & 2032
- Table 7: Global CEM Industry Revenue Million Forecast, by Organization Size 2019 & 2032
- Table 8: Global CEM Industry Volume K Unit Forecast, by Organization Size 2019 & 2032
- Table 9: Global CEM Industry Revenue Million Forecast, by Touchpoint 2019 & 2032
- Table 10: Global CEM Industry Volume K Unit Forecast, by Touchpoint 2019 & 2032
- Table 11: Global CEM Industry Revenue Million Forecast, by Application 2019 & 2032
- Table 12: Global CEM Industry Volume K Unit Forecast, by Application 2019 & 2032
- Table 13: Global CEM Industry Revenue Million Forecast, by Region 2019 & 2032
- Table 14: Global CEM Industry Volume K Unit Forecast, by Region 2019 & 2032
- Table 15: Global CEM Industry Revenue Million Forecast, by Country 2019 & 2032
- Table 16: Global CEM Industry Volume K Unit Forecast, by Country 2019 & 2032
- Table 17: United States CEM Industry Revenue (Million) Forecast, by Application 2019 & 2032
- Table 18: United States CEM Industry Volume (K Unit) Forecast, by Application 2019 & 2032
- Table 19: Canada CEM Industry Revenue (Million) Forecast, by Application 2019 & 2032
- Table 20: Canada CEM Industry Volume (K Unit) Forecast, by Application 2019 & 2032
- Table 21: Mexico CEM Industry Revenue (Million) Forecast, by Application 2019 & 2032
- Table 22: Mexico CEM Industry Volume (K Unit) Forecast, by Application 2019 & 2032
- Table 23: Global CEM Industry Revenue Million Forecast, by Country 2019 & 2032
- Table 24: Global CEM Industry Volume K Unit Forecast, by Country 2019 & 2032
- Table 25: Germany CEM Industry Revenue (Million) Forecast, by Application 2019 & 2032
- Table 26: Germany CEM Industry Volume (K Unit) Forecast, by Application 2019 & 2032
- Table 27: United Kingdom CEM Industry Revenue (Million) Forecast, by Application 2019 & 2032
- Table 28: United Kingdom CEM Industry Volume (K Unit) Forecast, by Application 2019 & 2032
- Table 29: France CEM Industry Revenue (Million) Forecast, by Application 2019 & 2032
- Table 30: France CEM Industry Volume (K Unit) Forecast, by Application 2019 & 2032
- Table 31: Spain CEM Industry Revenue (Million) Forecast, by Application 2019 & 2032
- Table 32: Spain CEM Industry Volume (K Unit) Forecast, by Application 2019 & 2032
- Table 33: Italy CEM Industry Revenue (Million) Forecast, by Application 2019 & 2032
- Table 34: Italy CEM Industry Volume (K Unit) Forecast, by Application 2019 & 2032
- Table 35: Spain CEM Industry Revenue (Million) Forecast, by Application 2019 & 2032
- Table 36: Spain CEM Industry Volume (K Unit) Forecast, by Application 2019 & 2032
- Table 37: Belgium CEM Industry Revenue (Million) Forecast, by Application 2019 & 2032
- Table 38: Belgium CEM Industry Volume (K Unit) Forecast, by Application 2019 & 2032
- Table 39: Netherland CEM Industry Revenue (Million) Forecast, by Application 2019 & 2032
- Table 40: Netherland CEM Industry Volume (K Unit) Forecast, by Application 2019 & 2032
- Table 41: Nordics CEM Industry Revenue (Million) Forecast, by Application 2019 & 2032
- Table 42: Nordics CEM Industry Volume (K Unit) Forecast, by Application 2019 & 2032
- Table 43: Rest of Europe CEM Industry Revenue (Million) Forecast, by Application 2019 & 2032
- Table 44: Rest of Europe CEM Industry Volume (K Unit) Forecast, by Application 2019 & 2032
- Table 45: Global CEM Industry Revenue Million Forecast, by Country 2019 & 2032
- Table 46: Global CEM Industry Volume K Unit Forecast, by Country 2019 & 2032
- Table 47: China CEM Industry Revenue (Million) Forecast, by Application 2019 & 2032
- Table 48: China CEM Industry Volume (K Unit) Forecast, by Application 2019 & 2032
- Table 49: Japan CEM Industry Revenue (Million) Forecast, by Application 2019 & 2032
- Table 50: Japan CEM Industry Volume (K Unit) Forecast, by Application 2019 & 2032
- Table 51: India CEM Industry Revenue (Million) Forecast, by Application 2019 & 2032
- Table 52: India CEM Industry Volume (K Unit) Forecast, by Application 2019 & 2032
- Table 53: South Korea CEM Industry Revenue (Million) Forecast, by Application 2019 & 2032
- Table 54: South Korea CEM Industry Volume (K Unit) Forecast, by Application 2019 & 2032
- Table 55: Southeast Asia CEM Industry Revenue (Million) Forecast, by Application 2019 & 2032
- Table 56: Southeast Asia CEM Industry Volume (K Unit) Forecast, by Application 2019 & 2032
- Table 57: Australia CEM Industry Revenue (Million) Forecast, by Application 2019 & 2032
- Table 58: Australia CEM Industry Volume (K Unit) Forecast, by Application 2019 & 2032
- Table 59: Indonesia CEM Industry Revenue (Million) Forecast, by Application 2019 & 2032
- Table 60: Indonesia CEM Industry Volume (K Unit) Forecast, by Application 2019 & 2032
- Table 61: Phillipes CEM Industry Revenue (Million) Forecast, by Application 2019 & 2032
- Table 62: Phillipes CEM Industry Volume (K Unit) Forecast, by Application 2019 & 2032
- Table 63: Singapore CEM Industry Revenue (Million) Forecast, by Application 2019 & 2032
- Table 64: Singapore CEM Industry Volume (K Unit) Forecast, by Application 2019 & 2032
- Table 65: Thailandc CEM Industry Revenue (Million) Forecast, by Application 2019 & 2032
- Table 66: Thailandc CEM Industry Volume (K Unit) Forecast, by Application 2019 & 2032
- Table 67: Rest of Asia Pacific CEM Industry Revenue (Million) Forecast, by Application 2019 & 2032
- Table 68: Rest of Asia Pacific CEM Industry Volume (K Unit) Forecast, by Application 2019 & 2032
- Table 69: Global CEM Industry Revenue Million Forecast, by Country 2019 & 2032
- Table 70: Global CEM Industry Volume K Unit Forecast, by Country 2019 & 2032
- Table 71: Brazil CEM Industry Revenue (Million) Forecast, by Application 2019 & 2032
- Table 72: Brazil CEM Industry Volume (K Unit) Forecast, by Application 2019 & 2032
- Table 73: Argentina CEM Industry Revenue (Million) Forecast, by Application 2019 & 2032
- Table 74: Argentina CEM Industry Volume (K Unit) Forecast, by Application 2019 & 2032
- Table 75: Peru CEM Industry Revenue (Million) Forecast, by Application 2019 & 2032
- Table 76: Peru CEM Industry Volume (K Unit) Forecast, by Application 2019 & 2032
- Table 77: Chile CEM Industry Revenue (Million) Forecast, by Application 2019 & 2032
- Table 78: Chile CEM Industry Volume (K Unit) Forecast, by Application 2019 & 2032
- Table 79: Colombia CEM Industry Revenue (Million) Forecast, by Application 2019 & 2032
- Table 80: Colombia CEM Industry Volume (K Unit) Forecast, by Application 2019 & 2032
- Table 81: Ecuador CEM Industry Revenue (Million) Forecast, by Application 2019 & 2032
- Table 82: Ecuador CEM Industry Volume (K Unit) Forecast, by Application 2019 & 2032
- Table 83: Venezuela CEM Industry Revenue (Million) Forecast, by Application 2019 & 2032
- Table 84: Venezuela CEM Industry Volume (K Unit) Forecast, by Application 2019 & 2032
- Table 85: Rest of South America CEM Industry Revenue (Million) Forecast, by Application 2019 & 2032
- Table 86: Rest of South America CEM Industry Volume (K Unit) Forecast, by Application 2019 & 2032
- Table 87: Global CEM Industry Revenue Million Forecast, by Country 2019 & 2032
- Table 88: Global CEM Industry Volume K Unit Forecast, by Country 2019 & 2032
- Table 89: United States CEM Industry Revenue (Million) Forecast, by Application 2019 & 2032
- Table 90: United States CEM Industry Volume (K Unit) Forecast, by Application 2019 & 2032
- Table 91: Canada CEM Industry Revenue (Million) Forecast, by Application 2019 & 2032
- Table 92: Canada CEM Industry Volume (K Unit) Forecast, by Application 2019 & 2032
- Table 93: Mexico CEM Industry Revenue (Million) Forecast, by Application 2019 & 2032
- Table 94: Mexico CEM Industry Volume (K Unit) Forecast, by Application 2019 & 2032
- Table 95: Global CEM Industry Revenue Million Forecast, by Country 2019 & 2032
- Table 96: Global CEM Industry Volume K Unit Forecast, by Country 2019 & 2032
- Table 97: United Arab Emirates CEM Industry Revenue (Million) Forecast, by Application 2019 & 2032
- Table 98: United Arab Emirates CEM Industry Volume (K Unit) Forecast, by Application 2019 & 2032
- Table 99: Saudi Arabia CEM Industry Revenue (Million) Forecast, by Application 2019 & 2032
- Table 100: Saudi Arabia CEM Industry Volume (K Unit) Forecast, by Application 2019 & 2032
- Table 101: South Africa CEM Industry Revenue (Million) Forecast, by Application 2019 & 2032
- Table 102: South Africa CEM Industry Volume (K Unit) Forecast, by Application 2019 & 2032
- Table 103: Rest of Middle East and Africa CEM Industry Revenue (Million) Forecast, by Application 2019 & 2032
- Table 104: Rest of Middle East and Africa CEM Industry Volume (K Unit) Forecast, by Application 2019 & 2032
- Table 105: Global CEM Industry Revenue Million Forecast, by Component 2019 & 2032
- Table 106: Global CEM Industry Volume K Unit Forecast, by Component 2019 & 2032
- Table 107: Global CEM Industry Revenue Million Forecast, by Deployment 2019 & 2032
- Table 108: Global CEM Industry Volume K Unit Forecast, by Deployment 2019 & 2032
- Table 109: Global CEM Industry Revenue Million Forecast, by Organization Size 2019 & 2032
- Table 110: Global CEM Industry Volume K Unit Forecast, by Organization Size 2019 & 2032
- Table 111: Global CEM Industry Revenue Million Forecast, by Touchpoint 2019 & 2032
- Table 112: Global CEM Industry Volume K Unit Forecast, by Touchpoint 2019 & 2032
- Table 113: Global CEM Industry Revenue Million Forecast, by Application 2019 & 2032
- Table 114: Global CEM Industry Volume K Unit Forecast, by Application 2019 & 2032
- Table 115: Global CEM Industry Revenue Million Forecast, by Country 2019 & 2032
- Table 116: Global CEM Industry Volume K Unit Forecast, by Country 2019 & 2032
- Table 117: Global CEM Industry Revenue Million Forecast, by Component 2019 & 2032
- Table 118: Global CEM Industry Volume K Unit Forecast, by Component 2019 & 2032
- Table 119: Global CEM Industry Revenue Million Forecast, by Deployment 2019 & 2032
- Table 120: Global CEM Industry Volume K Unit Forecast, by Deployment 2019 & 2032
- Table 121: Global CEM Industry Revenue Million Forecast, by Organization Size 2019 & 2032
- Table 122: Global CEM Industry Volume K Unit Forecast, by Organization Size 2019 & 2032
- Table 123: Global CEM Industry Revenue Million Forecast, by Touchpoint 2019 & 2032
- Table 124: Global CEM Industry Volume K Unit Forecast, by Touchpoint 2019 & 2032
- Table 125: Global CEM Industry Revenue Million Forecast, by Application 2019 & 2032
- Table 126: Global CEM Industry Volume K Unit Forecast, by Application 2019 & 2032
- Table 127: Global CEM Industry Revenue Million Forecast, by Country 2019 & 2032
- Table 128: Global CEM Industry Volume K Unit Forecast, by Country 2019 & 2032
- Table 129: Global CEM Industry Revenue Million Forecast, by Component 2019 & 2032
- Table 130: Global CEM Industry Volume K Unit Forecast, by Component 2019 & 2032
- Table 131: Global CEM Industry Revenue Million Forecast, by Deployment 2019 & 2032
- Table 132: Global CEM Industry Volume K Unit Forecast, by Deployment 2019 & 2032
- Table 133: Global CEM Industry Revenue Million Forecast, by Organization Size 2019 & 2032
- Table 134: Global CEM Industry Volume K Unit Forecast, by Organization Size 2019 & 2032
- Table 135: Global CEM Industry Revenue Million Forecast, by Touchpoint 2019 & 2032
- Table 136: Global CEM Industry Volume K Unit Forecast, by Touchpoint 2019 & 2032
- Table 137: Global CEM Industry Revenue Million Forecast, by Application 2019 & 2032
- Table 138: Global CEM Industry Volume K Unit Forecast, by Application 2019 & 2032
- Table 139: Global CEM Industry Revenue Million Forecast, by Country 2019 & 2032
- Table 140: Global CEM Industry Volume K Unit Forecast, by Country 2019 & 2032
- Table 141: Global CEM Industry Revenue Million Forecast, by Component 2019 & 2032
- Table 142: Global CEM Industry Volume K Unit Forecast, by Component 2019 & 2032
- Table 143: Global CEM Industry Revenue Million Forecast, by Deployment 2019 & 2032
- Table 144: Global CEM Industry Volume K Unit Forecast, by Deployment 2019 & 2032
- Table 145: Global CEM Industry Revenue Million Forecast, by Organization Size 2019 & 2032
- Table 146: Global CEM Industry Volume K Unit Forecast, by Organization Size 2019 & 2032
- Table 147: Global CEM Industry Revenue Million Forecast, by Touchpoint 2019 & 2032
- Table 148: Global CEM Industry Volume K Unit Forecast, by Touchpoint 2019 & 2032
- Table 149: Global CEM Industry Revenue Million Forecast, by Application 2019 & 2032
- Table 150: Global CEM Industry Volume K Unit Forecast, by Application 2019 & 2032
- Table 151: Global CEM Industry Revenue Million Forecast, by Country 2019 & 2032
- Table 152: Global CEM Industry Volume K Unit Forecast, by Country 2019 & 2032
- Table 153: Global CEM Industry Revenue Million Forecast, by Component 2019 & 2032
- Table 154: Global CEM Industry Volume K Unit Forecast, by Component 2019 & 2032
- Table 155: Global CEM Industry Revenue Million Forecast, by Deployment 2019 & 2032
- Table 156: Global CEM Industry Volume K Unit Forecast, by Deployment 2019 & 2032
- Table 157: Global CEM Industry Revenue Million Forecast, by Organization Size 2019 & 2032
- Table 158: Global CEM Industry Volume K Unit Forecast, by Organization Size 2019 & 2032
- Table 159: Global CEM Industry Revenue Million Forecast, by Touchpoint 2019 & 2032
- Table 160: Global CEM Industry Volume K Unit Forecast, by Touchpoint 2019 & 2032
- Table 161: Global CEM Industry Revenue Million Forecast, by Application 2019 & 2032
- Table 162: Global CEM Industry Volume K Unit Forecast, by Application 2019 & 2032
- Table 163: Global CEM Industry Revenue Million Forecast, by Country 2019 & 2032
- Table 164: Global CEM Industry Volume K Unit Forecast, by Country 2019 & 2032
Frequently Asked Questions
1. What is the projected Compound Annual Growth Rate (CAGR) of the CEM Industry?
The projected CAGR is approximately 17.90%.
2. Which companies are prominent players in the CEM Industry?
Key companies in the market include Tech Mahindra, IBM Corporation, Medallia Inc, Zendesk, Clarabridge, Adobe Inc, Avaya Inc, Verint Systems Inc, Oracle Corporation, Open Text Corporation, MaritzCX Research LLC, Sitecore, SAP SE.
3. What are the main segments of the CEM Industry?
The market segments include Component, Deployment, Organization Size, Touchpoint, Application.
4. Can you provide details about the market size?
The market size is estimated to be USD 19.03 Million as of 2022.
5. What are some drivers contributing to market growth?
Rapid Adoption of Cloud-based Technology. Advanced Analytics. and Automation; Growing Demand for Personalized Customer Experience.
6. What are the notable trends driving market growth?
Rapid Adoption of Cloud-based Technology. Advanced Analytics. and Automation.
7. Are there any restraints impacting market growth?
Privacy and Data Security Issues.
8. Can you provide examples of recent developments in the market?
June 2022 : Kyndryl, a leading global IT infrastructure services provider, has partnered with Oracle to assist customers in speeding their path to the cloud by offering managed cloud solutions to businesses globally. As part of the partnership, Kyndryl would become an Oracle Cloud Infrastructure (OCI) key delivery partner, expanding on its extensive expertise in working with and supporting clients that use Oracle products and services. Customers benefit from security capabilities, consistent high performance, simple, predictable pricing, and the tools and experience required to swiftly and efficiently migrate business workloads to the cloud.
9. What pricing options are available for accessing the report?
Pricing options include single-user, multi-user, and enterprise licenses priced at USD 4750, USD 5250, and USD 8750 respectively.
10. Is the market size provided in terms of value or volume?
The market size is provided in terms of value, measured in Million and volume, measured in K Unit.
11. Are there any specific market keywords associated with the report?
Yes, the market keyword associated with the report is "CEM Industry," which aids in identifying and referencing the specific market segment covered.
12. How do I determine which pricing option suits my needs best?
The pricing options vary based on user requirements and access needs. Individual users may opt for single-user licenses, while businesses requiring broader access may choose multi-user or enterprise licenses for cost-effective access to the report.
13. Are there any additional resources or data provided in the CEM Industry report?
While the report offers comprehensive insights, it's advisable to review the specific contents or supplementary materials provided to ascertain if additional resources or data are available.
14. How can I stay updated on further developments or reports in the CEM Industry?
To stay informed about further developments, trends, and reports in the CEM Industry, consider subscribing to industry newsletters, following relevant companies and organizations, or regularly checking reputable industry news sources and publications.
Methodology
Step 1 - Identification of Relevant Samples Size from Population Database


Step 2 - Approaches for Defining Global Market Size (Value, Volume* & Price*)

Note*: In applicable scenarios
Step 3 - Data Sources
Primary Research
- Web Analytics
- Survey Reports
- Research Institute
- Latest Research Reports
- Opinion Leaders
Secondary Research
- Annual Reports
- White Paper
- Latest Press Release
- Industry Association
- Paid Database
- Investor Presentations

Step 4 - Data Triangulation
Involves using different sources of information in order to increase the validity of a study
These sources are likely to be stakeholders in a program - participants, other researchers, program staff, other community members, and so on.
Then we put all data in single framework & apply various statistical tools to find out the dynamic on the market.
During the analysis stage, feedback from the stakeholder groups would be compared to determine areas of agreement as well as areas of divergence


