Decoding Cereal Bars Market in South America Consumer Preferences 2025-2033

Cereal Bars Market in South America by Production Analysis, by Consumption Analysis, by Import Market Analysis (Value & Volume), by Export Market Analysis (Value & Volume), by Price Trend Analysis, by North America (United States, Canada, Mexico), by South America (Brazil, Argentina, Rest of South America), by Europe (United Kingdom, Germany, France, Italy, Spain, Russia, Benelux, Nordics, Rest of Europe), by Middle East & Africa (Turkey, Israel, GCC, North Africa, South Africa, Rest of Middle East & Africa), by Asia Pacific (China, India, Japan, South Korea, ASEAN, Oceania, Rest of Asia Pacific) Forecast 2025-2033

Jun 28 2025
Base Year: 2024

210 Pages
Main Logo

Decoding Cereal Bars Market in South America Consumer Preferences 2025-2033


Home
Industries
Food & Beverage
sponsor image
sponsor image
sponsor image
sponsor image

Tailored for you

  • In-depth Analysis Tailored to Specified Regions or Segments
  • Company Profiles Customized to User Preferences
  • Comprehensive Insights Focused on Specific Segments or Regions
  • Customized Evaluation of Competitive Landscape to Meet Your Needs
  • Tailored Customization to Address Other Specific Requirements
Ask for customization


Key Insights

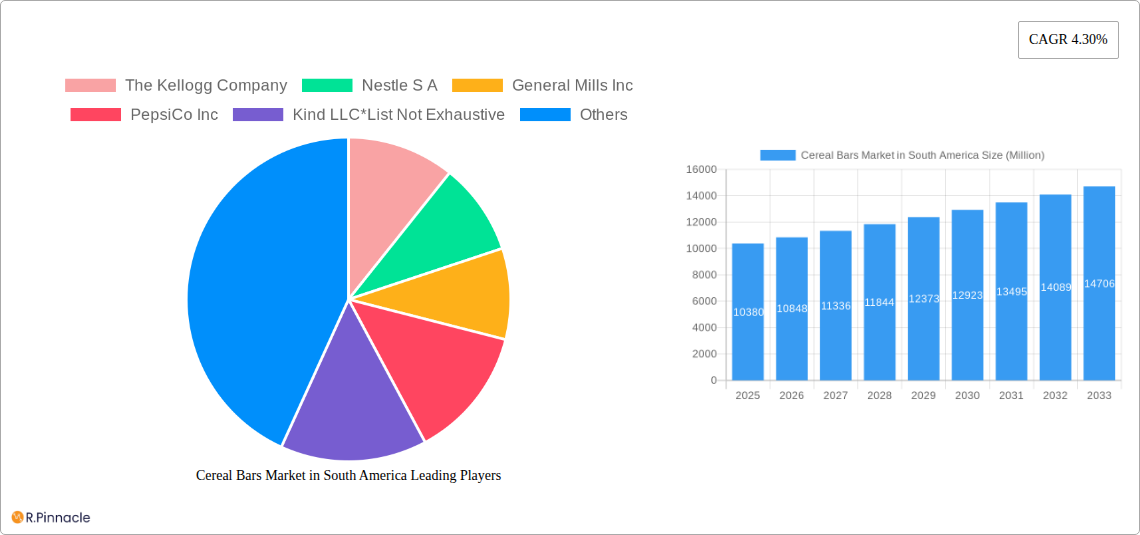
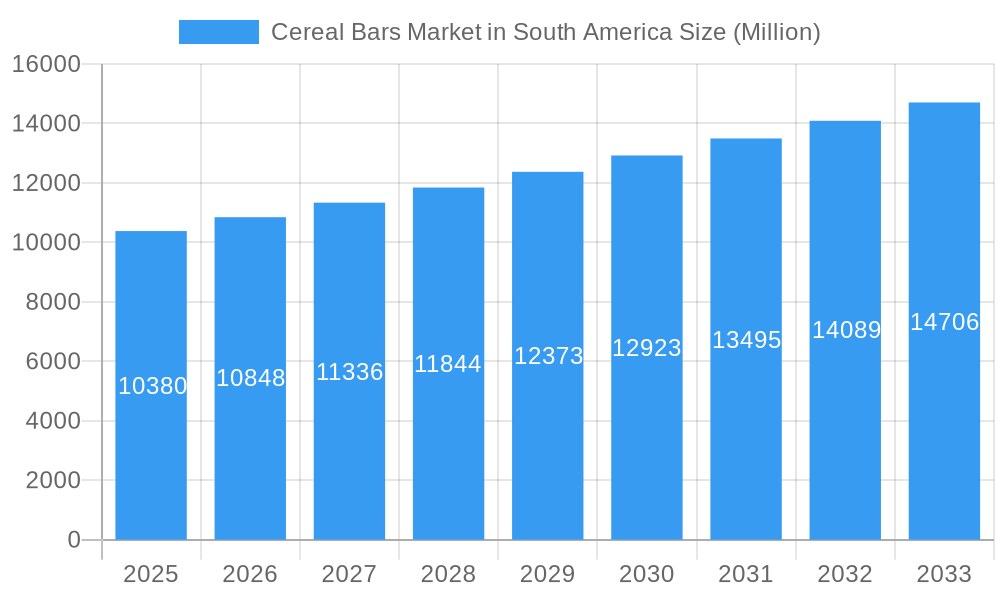
The South American cereal bars market, valued at approximately $10,380 million in 2025, is projected to experience robust growth, driven by increasing health consciousness among consumers and the rising popularity of convenient, on-the-go snacking options. The market's Compound Annual Growth Rate (CAGR) of 4.30% from 2025 to 2033 indicates a steady expansion, with significant potential for growth in the coming years. Key drivers include the increasing prevalence of busy lifestyles, a growing preference for nutritious and portable snacks, and the expanding distribution channels, including the rise of online retail. Granola/muesli bars dominate the product type segment, reflecting a preference for healthier options. Supermarkets/hypermarkets represent the largest distribution channel, followed by convenience stores and the rapidly growing online retail segment. Major players like Kellogg's, Nestlé, General Mills, and PepsiCo, along with smaller, specialized brands, are fiercely competing for market share, leading to innovation in flavors, ingredients, and packaging.

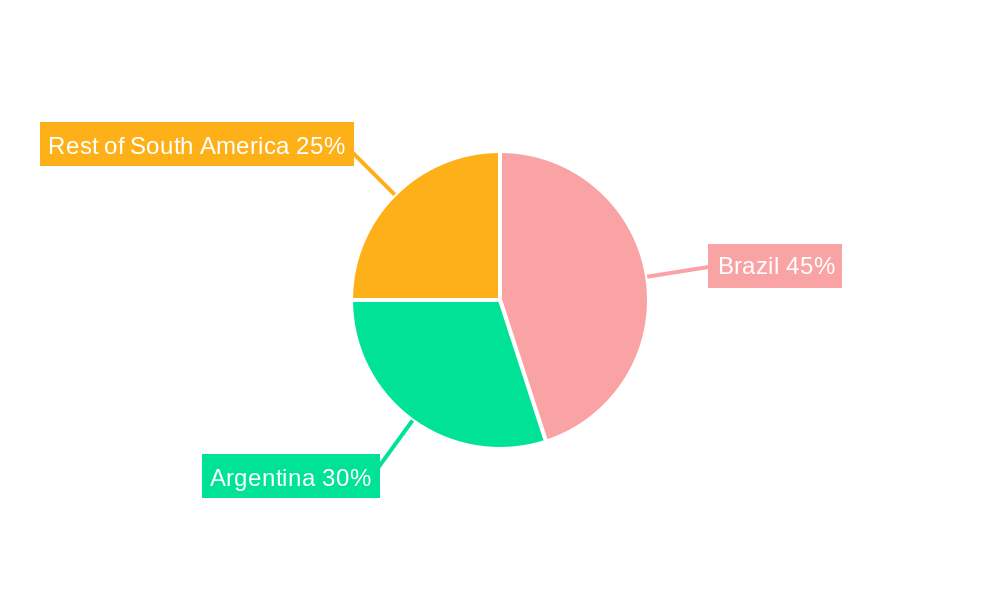
The market's growth trajectory is influenced by several factors. Increasing disposable incomes, particularly in urban centers, are fueling demand for premium and specialized cereal bars. However, potential restraints include fluctuating raw material prices and the competitive landscape. Brazil and Argentina are the largest markets within South America, accounting for a significant portion of the overall market size. The ongoing expansion of organized retail and increased consumer awareness of health and wellness trends are expected to further stimulate market growth. Future growth will likely be propelled by the introduction of innovative products catering to specific dietary needs and preferences (such as gluten-free, vegan, and high-protein bars) and strategic partnerships aimed at enhancing distribution and brand visibility across diverse consumer segments. The forecast period from 2025 to 2033 presents considerable opportunities for existing and new players alike to tap into this expanding market.

Cereal Bars Market in South America Research Report - Market Size, Growth & Forecast

Cereal Bars Market in South America: A Comprehensive Report (2019-2033)

This in-depth report provides a comprehensive analysis of the Cereal Bars Market in South America, covering market dynamics, competitive landscape, and future growth opportunities. The study period spans from 2019 to 2033, with 2025 serving as the base and estimated year. This report is crucial for industry professionals, investors, and anyone seeking a detailed understanding of this dynamic market.

Cereal Bars Market in South America Market Structure & Innovation Trends

This section analyzes the market's structure, highlighting key players, their market share, and the innovative trends shaping the industry. The South American cereal bar market exhibits moderate concentration, with major players like The Kellogg Company, Nestle S.A., General Mills Inc., PepsiCo Inc., and Mondelez International Inc. holding significant shares. Smaller, niche players like Kind LLC and Clif Bar & Company are also present, catering to specific consumer segments. However, the market is not saturated, leaving room for new entrants.

Market Concentration: The top 5 players hold an estimated xx% market share in 2025, indicating a moderately concentrated market.

Innovation Drivers: Health and wellness trends, demand for convenient snacking options, and increasing disposable incomes are driving innovation in product offerings, such as organic and gluten-free bars. Furthermore, the introduction of functional cereal bars with added vitamins and probiotics fuels market growth.

Regulatory Frameworks: Varying regulations across South American countries regarding food labeling, ingredients, and marketing practices impact market dynamics. Companies need to navigate these diverse regulatory landscapes.

M&A Activities: The market has witnessed a moderate number of mergers and acquisitions in recent years, with deal values ranging from xx Million to xx Million. This consolidation is expected to continue as larger players seek to expand their market presence and product portfolios.

Product Substitutes: Other convenient snacks, such as energy bars, fruit snacks, and yogurt, compete for market share. However, the unique combination of nutrition and convenience offered by cereal bars continues to drive consumer demand.

End-User Demographics: The primary consumer base comprises health-conscious individuals, active lifestyles seekers, and young adults seeking convenient and nutritious snacks.

Cereal Bars Market in South America Growth

Cereal Bars Market in South America Market Dynamics & Trends

The South American cereal bars market demonstrates significant growth potential, driven by several key factors. The market’s Compound Annual Growth Rate (CAGR) during the forecast period (2025-2033) is projected at xx%. This growth is fueled by rising disposable incomes, increasing health awareness, and the growing popularity of convenient snacking options.

Technological disruptions, such as advanced packaging and production technologies, are enhancing product quality and shelf life. Changing consumer preferences, leaning towards healthier and more functional foods, along with the intensifying competition among established players and new entrants, contribute to the market’s dynamism. Market penetration for cereal bars is currently at approximately xx% within the overall snack food market in South America, with significant potential for further expansion. Brazil and Argentina are the leading consumers, followed by Chile and Colombia. The increasing adoption of online grocery shopping is expected to further drive market expansion.

Cereal Bars Market in South America Growth

Dominant Regions & Segments in Cereal Bars Market in South America

Dominant Region: Brazil is the leading market for cereal bars in South America, accounting for approximately xx% of the total market share in 2025. This dominance is driven by a large population, high disposable incomes, and rising health consciousness. Argentina holds the second largest market share.

Dominant Segments:

By Product Type:

  • Granola/Muesli Bars: This segment holds the largest market share due to its health halo and perceived nutritional benefits.
  • Other Cereal Bars: This category encompasses various types, including fruit and nut bars, chocolate-covered cereal bars and others, which are experiencing significant growth based on diverse consumer preferences.

By Distribution Channel:

  • Supermarkets/Hypermarkets: This remains the dominant distribution channel, owing to wide product availability and established consumer habits.
  • Convenience Stores: This channel shows promising growth potential, capitalizing on the demand for convenient and on-the-go snacking.
  • Online Retail Stores: This segment's growth is rapidly accelerating due to increasing e-commerce penetration and convenient home delivery options.

Key Drivers for Brazil's Dominance:

  • Strong economic growth and rising disposable incomes.
  • Increasing urbanization and changing lifestyles.
  • Growing awareness of health and wellness.
  • Well-developed retail infrastructure.

Cereal Bars Market in South America Product Innovations

Recent product innovations focus on enhanced nutritional profiles, incorporating superfoods, organic ingredients, and functional ingredients like probiotics and protein. There is also a trend towards more sustainable and ethically sourced ingredients, aligning with rising consumer demand for environmentally conscious products. These innovations cater to specific dietary needs and preferences, enhancing the market appeal. Technological advancements in manufacturing improve efficiency, consistency, and product quality.

Report Scope & Segmentation Analysis

This report comprehensively analyzes the South American Cereal Bars Market based on the following segmentations:

By Product Type: Granola/Muesli Bars and Other Cereal Bars. Growth projections for Granola/Muesli bars are stronger due to their health perception. The “Other Cereal Bars” segment is anticipated to experience steady growth due to product diversification.

By Distribution Channel: Supermarkets/Hypermarkets, Convenience Stores, Online Retail Stores, and Other Distribution Channels. Online Retail is experiencing the fastest growth, while Supermarkets/Hypermarkets maintain the largest market share.

Each segment's growth rate, market size, and competitive landscape are thoroughly examined in the complete report.

Key Drivers of Cereal Bars Market in South America Growth

Several factors contribute to the market's growth: The rising adoption of healthy lifestyles promotes the consumption of nutritious snacks. Growing disposable incomes among a significant population segment increases spending power, facilitating purchases of premium and specialized cereal bars. The expansion of organized retail and enhanced distribution networks ensure improved product accessibility across the region.

Challenges in the Cereal Bars Market in South America Sector

The market faces challenges, including fluctuating raw material prices that impact production costs, supply chain disruptions affecting product availability, and intense competition amongst numerous manufacturers. Stricter food safety regulations require adherence to complex standards, adding to operational costs. These factors can collectively influence profit margins and overall market growth.

Emerging Opportunities in Cereal Bars Market in South America

The rising demand for functional foods and personalized nutrition creates opportunities for specialized cereal bars catering to specific dietary needs. Expansion into less-penetrated markets within South America presents significant growth potential. Leveraging digital marketing and e-commerce platforms can improve brand awareness and market reach, driving sales.

Leading Players in the Cereal Bars Market in South America Market

  • The Kellogg Company
  • Nestle S.A.
  • General Mills Inc.
  • PepsiCo Inc.
  • Kind LLC
  • Clif Bar & Company
  • Mondelez International Inc.

Key Developments in Cereal Bars Market in South America Industry

  • 2022 Q4: Nestle S.A. launched a new line of organic cereal bars in Brazil.
  • 2023 Q1: General Mills Inc. announced a strategic partnership with a local South American distributor to expand its reach.
  • 2024 Q2: A significant merger took place within the South American cereal bar market involving two regional players resulting in xx Million deal. (Further details are provided in the full report.)

Future Outlook for Cereal Bars Market in South America Market

The South American cereal bar market is poised for continued growth, driven by evolving consumer preferences and the rising demand for convenient, healthy snacks. Strategic partnerships, product diversification, and effective marketing strategies will be crucial for companies to capitalize on this growth potential. The market is expected to witness further consolidation as larger players acquire smaller companies to expand their product portfolio and increase market share.

Cereal Bars Market in South America Segmentation

  • 1. Production Analysis
  • 2. Consumption Analysis
  • 3. Import Market Analysis (Value & Volume)
  • 4. Export Market Analysis (Value & Volume)
  • 5. Price Trend Analysis

Cereal Bars Market in South America Segmentation By Geography

  • 1. North America
    • 1.1. United States
    • 1.2. Canada
    • 1.3. Mexico
  • 2. South America
    • 2.1. Brazil
    • 2.2. Argentina
    • 2.3. Rest of South America
  • 3. Europe
    • 3.1. United Kingdom
    • 3.2. Germany
    • 3.3. France
    • 3.4. Italy
    • 3.5. Spain
    • 3.6. Russia
    • 3.7. Benelux
    • 3.8. Nordics
    • 3.9. Rest of Europe
  • 4. Middle East & Africa
    • 4.1. Turkey
    • 4.2. Israel
    • 4.3. GCC
    • 4.4. North Africa
    • 4.5. South Africa
    • 4.6. Rest of Middle East & Africa
  • 5. Asia Pacific
    • 5.1. China
    • 5.2. India
    • 5.3. Japan
    • 5.4. South Korea
    • 5.5. ASEAN
    • 5.6. Oceania
    • 5.7. Rest of Asia Pacific
Cereal Bars Market in South America Regional Share


Cereal Bars Market in South America REPORT HIGHLIGHTS

AspectsDetails
Study Period 2019-2033
Base Year 2024
Estimated Year 2025
Forecast Period2025-2033
Historical Period2019-2024
Growth RateCAGR of 4.30% from 2019-2033
Segmentation
    • By Production Analysis
    • By Consumption Analysis
    • By Import Market Analysis (Value & Volume)
    • By Export Market Analysis (Value & Volume)
    • By Price Trend Analysis
  • By Geography
    • North America
      • United States
      • Canada
      • Mexico
    • South America
      • Brazil
      • Argentina
      • Rest of South America
    • Europe
      • United Kingdom
      • Germany
      • France
      • Italy
      • Spain
      • Russia
      • Benelux
      • Nordics
      • Rest of Europe
    • Middle East & Africa
      • Turkey
      • Israel
      • GCC
      • North Africa
      • South Africa
      • Rest of Middle East & Africa
    • Asia Pacific
      • China
      • India
      • Japan
      • South Korea
      • ASEAN
      • Oceania
      • Rest of Asia Pacific


Table of Contents

  1. 1. Introduction
    • 1.1. Research Scope
    • 1.2. Market Segmentation
    • 1.3. Research Methodology
    • 1.4. Definitions and Assumptions
  2. 2. Executive Summary
    • 2.1. Introduction
  3. 3. Market Dynamics
    • 3.1. Introduction
      • 3.2. Market Drivers
        • 3.2.1. Popularity of Convenient Food Products; Expansion of Cold Chain Logistics
      • 3.3. Market Restrains
        • 3.3.1. Concerns Over Food Safety and Quality
      • 3.4. Market Trends
        • 3.4.1. Surge In The Consumption Of Healthy Food
  4. 4. Market Factor Analysis
    • 4.1. Porters Five Forces
    • 4.2. Supply/Value Chain
    • 4.3. PESTEL analysis
    • 4.4. Market Entropy
    • 4.5. Patent/Trademark Analysis
  5. 5. Global Cereal Bars Market in South America Analysis, Insights and Forecast, 2019-2031
    • 5.1. Market Analysis, Insights and Forecast - by Production Analysis
      • 5.2. Market Analysis, Insights and Forecast - by Consumption Analysis
        • 5.3. Market Analysis, Insights and Forecast - by Import Market Analysis (Value & Volume)
          • 5.4. Market Analysis, Insights and Forecast - by Export Market Analysis (Value & Volume)
            • 5.5. Market Analysis, Insights and Forecast - by Price Trend Analysis
              • 5.6. Market Analysis, Insights and Forecast - by Region
                • 5.6.1. North America
                • 5.6.2. South America
                • 5.6.3. Europe
                • 5.6.4. Middle East & Africa
                • 5.6.5. Asia Pacific
            • 6. North America Cereal Bars Market in South America Analysis, Insights and Forecast, 2019-2031
              • 6.1. Market Analysis, Insights and Forecast - by Production Analysis
                • 6.2. Market Analysis, Insights and Forecast - by Consumption Analysis
                  • 6.3. Market Analysis, Insights and Forecast - by Import Market Analysis (Value & Volume)
                    • 6.4. Market Analysis, Insights and Forecast - by Export Market Analysis (Value & Volume)
                      • 6.5. Market Analysis, Insights and Forecast - by Price Trend Analysis
                      • 7. South America Cereal Bars Market in South America Analysis, Insights and Forecast, 2019-2031
                        • 7.1. Market Analysis, Insights and Forecast - by Production Analysis
                          • 7.2. Market Analysis, Insights and Forecast - by Consumption Analysis
                            • 7.3. Market Analysis, Insights and Forecast - by Import Market Analysis (Value & Volume)
                              • 7.4. Market Analysis, Insights and Forecast - by Export Market Analysis (Value & Volume)
                                • 7.5. Market Analysis, Insights and Forecast - by Price Trend Analysis
                                • 8. Europe Cereal Bars Market in South America Analysis, Insights and Forecast, 2019-2031
                                  • 8.1. Market Analysis, Insights and Forecast - by Production Analysis
                                    • 8.2. Market Analysis, Insights and Forecast - by Consumption Analysis
                                      • 8.3. Market Analysis, Insights and Forecast - by Import Market Analysis (Value & Volume)
                                        • 8.4. Market Analysis, Insights and Forecast - by Export Market Analysis (Value & Volume)
                                          • 8.5. Market Analysis, Insights and Forecast - by Price Trend Analysis
                                          • 9. Middle East & Africa Cereal Bars Market in South America Analysis, Insights and Forecast, 2019-2031
                                            • 9.1. Market Analysis, Insights and Forecast - by Production Analysis
                                              • 9.2. Market Analysis, Insights and Forecast - by Consumption Analysis
                                                • 9.3. Market Analysis, Insights and Forecast - by Import Market Analysis (Value & Volume)
                                                  • 9.4. Market Analysis, Insights and Forecast - by Export Market Analysis (Value & Volume)
                                                    • 9.5. Market Analysis, Insights and Forecast - by Price Trend Analysis
                                                    • 10. Asia Pacific Cereal Bars Market in South America Analysis, Insights and Forecast, 2019-2031
                                                      • 10.1. Market Analysis, Insights and Forecast - by Production Analysis
                                                        • 10.2. Market Analysis, Insights and Forecast - by Consumption Analysis
                                                          • 10.3. Market Analysis, Insights and Forecast - by Import Market Analysis (Value & Volume)
                                                            • 10.4. Market Analysis, Insights and Forecast - by Export Market Analysis (Value & Volume)
                                                              • 10.5. Market Analysis, Insights and Forecast - by Price Trend Analysis
                                                              • 11. Brazil Cereal Bars Market in South America Analysis, Insights and Forecast, 2019-2031
                                                                • 12. Argentina Cereal Bars Market in South America Analysis, Insights and Forecast, 2019-2031
                                                                  • 13. Rest of South America Cereal Bars Market in South America Analysis, Insights and Forecast, 2019-2031
                                                                    • 14. Competitive Analysis
                                                                      • 14.1. Global Market Share Analysis 2024
                                                                        • 14.2. Company Profiles
                                                                          • 14.2.1 The Kellogg Company
                                                                            • 14.2.1.1. Overview
                                                                            • 14.2.1.2. Products
                                                                            • 14.2.1.3. SWOT Analysis
                                                                            • 14.2.1.4. Recent Developments
                                                                            • 14.2.1.5. Financials (Based on Availability)
                                                                          • 14.2.2 Nestle S A
                                                                            • 14.2.2.1. Overview
                                                                            • 14.2.2.2. Products
                                                                            • 14.2.2.3. SWOT Analysis
                                                                            • 14.2.2.4. Recent Developments
                                                                            • 14.2.2.5. Financials (Based on Availability)
                                                                          • 14.2.3 General Mills Inc
                                                                            • 14.2.3.1. Overview
                                                                            • 14.2.3.2. Products
                                                                            • 14.2.3.3. SWOT Analysis
                                                                            • 14.2.3.4. Recent Developments
                                                                            • 14.2.3.5. Financials (Based on Availability)
                                                                          • 14.2.4 PepsiCo Inc
                                                                            • 14.2.4.1. Overview
                                                                            • 14.2.4.2. Products
                                                                            • 14.2.4.3. SWOT Analysis
                                                                            • 14.2.4.4. Recent Developments
                                                                            • 14.2.4.5. Financials (Based on Availability)
                                                                          • 14.2.5 Kind LLC*List Not Exhaustive
                                                                            • 14.2.5.1. Overview
                                                                            • 14.2.5.2. Products
                                                                            • 14.2.5.3. SWOT Analysis
                                                                            • 14.2.5.4. Recent Developments
                                                                            • 14.2.5.5. Financials (Based on Availability)
                                                                          • 14.2.6 Clif Bar & Company
                                                                            • 14.2.6.1. Overview
                                                                            • 14.2.6.2. Products
                                                                            • 14.2.6.3. SWOT Analysis
                                                                            • 14.2.6.4. Recent Developments
                                                                            • 14.2.6.5. Financials (Based on Availability)
                                                                          • 14.2.7 Mondelez International Inc
                                                                            • 14.2.7.1. Overview
                                                                            • 14.2.7.2. Products
                                                                            • 14.2.7.3. SWOT Analysis
                                                                            • 14.2.7.4. Recent Developments
                                                                            • 14.2.7.5. Financials (Based on Availability)

                                                                    List of Figures

                                                                    1. Figure 1: Global Cereal Bars Market in South America Revenue Breakdown (Million, %) by Region 2024 & 2032
                                                                    2. Figure 2: Global Cereal Bars Market in South America Volume Breakdown (K Units, %) by Region 2024 & 2032
                                                                    3. Figure 3: South America Cereal Bars Market in South America Revenue (Million), by Country 2024 & 2032
                                                                    4. Figure 4: South America Cereal Bars Market in South America Volume (K Units), by Country 2024 & 2032
                                                                    5. Figure 5: South America Cereal Bars Market in South America Revenue Share (%), by Country 2024 & 2032
                                                                    6. Figure 6: South America Cereal Bars Market in South America Volume Share (%), by Country 2024 & 2032
                                                                    7. Figure 7: North America Cereal Bars Market in South America Revenue (Million), by Production Analysis 2024 & 2032
                                                                    8. Figure 8: North America Cereal Bars Market in South America Volume (K Units), by Production Analysis 2024 & 2032
                                                                    9. Figure 9: North America Cereal Bars Market in South America Revenue Share (%), by Production Analysis 2024 & 2032
                                                                    10. Figure 10: North America Cereal Bars Market in South America Volume Share (%), by Production Analysis 2024 & 2032
                                                                    11. Figure 11: North America Cereal Bars Market in South America Revenue (Million), by Consumption Analysis 2024 & 2032
                                                                    12. Figure 12: North America Cereal Bars Market in South America Volume (K Units), by Consumption Analysis 2024 & 2032
                                                                    13. Figure 13: North America Cereal Bars Market in South America Revenue Share (%), by Consumption Analysis 2024 & 2032
                                                                    14. Figure 14: North America Cereal Bars Market in South America Volume Share (%), by Consumption Analysis 2024 & 2032
                                                                    15. Figure 15: North America Cereal Bars Market in South America Revenue (Million), by Import Market Analysis (Value & Volume) 2024 & 2032
                                                                    16. Figure 16: North America Cereal Bars Market in South America Volume (K Units), by Import Market Analysis (Value & Volume) 2024 & 2032
                                                                    17. Figure 17: North America Cereal Bars Market in South America Revenue Share (%), by Import Market Analysis (Value & Volume) 2024 & 2032
                                                                    18. Figure 18: North America Cereal Bars Market in South America Volume Share (%), by Import Market Analysis (Value & Volume) 2024 & 2032
                                                                    19. Figure 19: North America Cereal Bars Market in South America Revenue (Million), by Export Market Analysis (Value & Volume) 2024 & 2032
                                                                    20. Figure 20: North America Cereal Bars Market in South America Volume (K Units), by Export Market Analysis (Value & Volume) 2024 & 2032
                                                                    21. Figure 21: North America Cereal Bars Market in South America Revenue Share (%), by Export Market Analysis (Value & Volume) 2024 & 2032
                                                                    22. Figure 22: North America Cereal Bars Market in South America Volume Share (%), by Export Market Analysis (Value & Volume) 2024 & 2032
                                                                    23. Figure 23: North America Cereal Bars Market in South America Revenue (Million), by Price Trend Analysis 2024 & 2032
                                                                    24. Figure 24: North America Cereal Bars Market in South America Volume (K Units), by Price Trend Analysis 2024 & 2032
                                                                    25. Figure 25: North America Cereal Bars Market in South America Revenue Share (%), by Price Trend Analysis 2024 & 2032
                                                                    26. Figure 26: North America Cereal Bars Market in South America Volume Share (%), by Price Trend Analysis 2024 & 2032
                                                                    27. Figure 27: North America Cereal Bars Market in South America Revenue (Million), by Country 2024 & 2032
                                                                    28. Figure 28: North America Cereal Bars Market in South America Volume (K Units), by Country 2024 & 2032
                                                                    29. Figure 29: North America Cereal Bars Market in South America Revenue Share (%), by Country 2024 & 2032
                                                                    30. Figure 30: North America Cereal Bars Market in South America Volume Share (%), by Country 2024 & 2032
                                                                    31. Figure 31: South America Cereal Bars Market in South America Revenue (Million), by Production Analysis 2024 & 2032
                                                                    32. Figure 32: South America Cereal Bars Market in South America Volume (K Units), by Production Analysis 2024 & 2032
                                                                    33. Figure 33: South America Cereal Bars Market in South America Revenue Share (%), by Production Analysis 2024 & 2032
                                                                    34. Figure 34: South America Cereal Bars Market in South America Volume Share (%), by Production Analysis 2024 & 2032
                                                                    35. Figure 35: South America Cereal Bars Market in South America Revenue (Million), by Consumption Analysis 2024 & 2032
                                                                    36. Figure 36: South America Cereal Bars Market in South America Volume (K Units), by Consumption Analysis 2024 & 2032
                                                                    37. Figure 37: South America Cereal Bars Market in South America Revenue Share (%), by Consumption Analysis 2024 & 2032
                                                                    38. Figure 38: South America Cereal Bars Market in South America Volume Share (%), by Consumption Analysis 2024 & 2032
                                                                    39. Figure 39: South America Cereal Bars Market in South America Revenue (Million), by Import Market Analysis (Value & Volume) 2024 & 2032
                                                                    40. Figure 40: South America Cereal Bars Market in South America Volume (K Units), by Import Market Analysis (Value & Volume) 2024 & 2032
                                                                    41. Figure 41: South America Cereal Bars Market in South America Revenue Share (%), by Import Market Analysis (Value & Volume) 2024 & 2032
                                                                    42. Figure 42: South America Cereal Bars Market in South America Volume Share (%), by Import Market Analysis (Value & Volume) 2024 & 2032
                                                                    43. Figure 43: South America Cereal Bars Market in South America Revenue (Million), by Export Market Analysis (Value & Volume) 2024 & 2032
                                                                    44. Figure 44: South America Cereal Bars Market in South America Volume (K Units), by Export Market Analysis (Value & Volume) 2024 & 2032
                                                                    45. Figure 45: South America Cereal Bars Market in South America Revenue Share (%), by Export Market Analysis (Value & Volume) 2024 & 2032
                                                                    46. Figure 46: South America Cereal Bars Market in South America Volume Share (%), by Export Market Analysis (Value & Volume) 2024 & 2032
                                                                    47. Figure 47: South America Cereal Bars Market in South America Revenue (Million), by Price Trend Analysis 2024 & 2032
                                                                    48. Figure 48: South America Cereal Bars Market in South America Volume (K Units), by Price Trend Analysis 2024 & 2032
                                                                    49. Figure 49: South America Cereal Bars Market in South America Revenue Share (%), by Price Trend Analysis 2024 & 2032
                                                                    50. Figure 50: South America Cereal Bars Market in South America Volume Share (%), by Price Trend Analysis 2024 & 2032
                                                                    51. Figure 51: South America Cereal Bars Market in South America Revenue (Million), by Country 2024 & 2032
                                                                    52. Figure 52: South America Cereal Bars Market in South America Volume (K Units), by Country 2024 & 2032
                                                                    53. Figure 53: South America Cereal Bars Market in South America Revenue Share (%), by Country 2024 & 2032
                                                                    54. Figure 54: South America Cereal Bars Market in South America Volume Share (%), by Country 2024 & 2032
                                                                    55. Figure 55: Europe Cereal Bars Market in South America Revenue (Million), by Production Analysis 2024 & 2032
                                                                    56. Figure 56: Europe Cereal Bars Market in South America Volume (K Units), by Production Analysis 2024 & 2032
                                                                    57. Figure 57: Europe Cereal Bars Market in South America Revenue Share (%), by Production Analysis 2024 & 2032
                                                                    58. Figure 58: Europe Cereal Bars Market in South America Volume Share (%), by Production Analysis 2024 & 2032
                                                                    59. Figure 59: Europe Cereal Bars Market in South America Revenue (Million), by Consumption Analysis 2024 & 2032
                                                                    60. Figure 60: Europe Cereal Bars Market in South America Volume (K Units), by Consumption Analysis 2024 & 2032
                                                                    61. Figure 61: Europe Cereal Bars Market in South America Revenue Share (%), by Consumption Analysis 2024 & 2032
                                                                    62. Figure 62: Europe Cereal Bars Market in South America Volume Share (%), by Consumption Analysis 2024 & 2032
                                                                    63. Figure 63: Europe Cereal Bars Market in South America Revenue (Million), by Import Market Analysis (Value & Volume) 2024 & 2032
                                                                    64. Figure 64: Europe Cereal Bars Market in South America Volume (K Units), by Import Market Analysis (Value & Volume) 2024 & 2032
                                                                    65. Figure 65: Europe Cereal Bars Market in South America Revenue Share (%), by Import Market Analysis (Value & Volume) 2024 & 2032
                                                                    66. Figure 66: Europe Cereal Bars Market in South America Volume Share (%), by Import Market Analysis (Value & Volume) 2024 & 2032
                                                                    67. Figure 67: Europe Cereal Bars Market in South America Revenue (Million), by Export Market Analysis (Value & Volume) 2024 & 2032
                                                                    68. Figure 68: Europe Cereal Bars Market in South America Volume (K Units), by Export Market Analysis (Value & Volume) 2024 & 2032
                                                                    69. Figure 69: Europe Cereal Bars Market in South America Revenue Share (%), by Export Market Analysis (Value & Volume) 2024 & 2032
                                                                    70. Figure 70: Europe Cereal Bars Market in South America Volume Share (%), by Export Market Analysis (Value & Volume) 2024 & 2032
                                                                    71. Figure 71: Europe Cereal Bars Market in South America Revenue (Million), by Price Trend Analysis 2024 & 2032
                                                                    72. Figure 72: Europe Cereal Bars Market in South America Volume (K Units), by Price Trend Analysis 2024 & 2032
                                                                    73. Figure 73: Europe Cereal Bars Market in South America Revenue Share (%), by Price Trend Analysis 2024 & 2032
                                                                    74. Figure 74: Europe Cereal Bars Market in South America Volume Share (%), by Price Trend Analysis 2024 & 2032
                                                                    75. Figure 75: Europe Cereal Bars Market in South America Revenue (Million), by Country 2024 & 2032
                                                                    76. Figure 76: Europe Cereal Bars Market in South America Volume (K Units), by Country 2024 & 2032
                                                                    77. Figure 77: Europe Cereal Bars Market in South America Revenue Share (%), by Country 2024 & 2032
                                                                    78. Figure 78: Europe Cereal Bars Market in South America Volume Share (%), by Country 2024 & 2032
                                                                    79. Figure 79: Middle East & Africa Cereal Bars Market in South America Revenue (Million), by Production Analysis 2024 & 2032
                                                                    80. Figure 80: Middle East & Africa Cereal Bars Market in South America Volume (K Units), by Production Analysis 2024 & 2032
                                                                    81. Figure 81: Middle East & Africa Cereal Bars Market in South America Revenue Share (%), by Production Analysis 2024 & 2032
                                                                    82. Figure 82: Middle East & Africa Cereal Bars Market in South America Volume Share (%), by Production Analysis 2024 & 2032
                                                                    83. Figure 83: Middle East & Africa Cereal Bars Market in South America Revenue (Million), by Consumption Analysis 2024 & 2032
                                                                    84. Figure 84: Middle East & Africa Cereal Bars Market in South America Volume (K Units), by Consumption Analysis 2024 & 2032
                                                                    85. Figure 85: Middle East & Africa Cereal Bars Market in South America Revenue Share (%), by Consumption Analysis 2024 & 2032
                                                                    86. Figure 86: Middle East & Africa Cereal Bars Market in South America Volume Share (%), by Consumption Analysis 2024 & 2032
                                                                    87. Figure 87: Middle East & Africa Cereal Bars Market in South America Revenue (Million), by Import Market Analysis (Value & Volume) 2024 & 2032
                                                                    88. Figure 88: Middle East & Africa Cereal Bars Market in South America Volume (K Units), by Import Market Analysis (Value & Volume) 2024 & 2032
                                                                    89. Figure 89: Middle East & Africa Cereal Bars Market in South America Revenue Share (%), by Import Market Analysis (Value & Volume) 2024 & 2032
                                                                    90. Figure 90: Middle East & Africa Cereal Bars Market in South America Volume Share (%), by Import Market Analysis (Value & Volume) 2024 & 2032
                                                                    91. Figure 91: Middle East & Africa Cereal Bars Market in South America Revenue (Million), by Export Market Analysis (Value & Volume) 2024 & 2032
                                                                    92. Figure 92: Middle East & Africa Cereal Bars Market in South America Volume (K Units), by Export Market Analysis (Value & Volume) 2024 & 2032
                                                                    93. Figure 93: Middle East & Africa Cereal Bars Market in South America Revenue Share (%), by Export Market Analysis (Value & Volume) 2024 & 2032
                                                                    94. Figure 94: Middle East & Africa Cereal Bars Market in South America Volume Share (%), by Export Market Analysis (Value & Volume) 2024 & 2032
                                                                    95. Figure 95: Middle East & Africa Cereal Bars Market in South America Revenue (Million), by Price Trend Analysis 2024 & 2032
                                                                    96. Figure 96: Middle East & Africa Cereal Bars Market in South America Volume (K Units), by Price Trend Analysis 2024 & 2032
                                                                    97. Figure 97: Middle East & Africa Cereal Bars Market in South America Revenue Share (%), by Price Trend Analysis 2024 & 2032
                                                                    98. Figure 98: Middle East & Africa Cereal Bars Market in South America Volume Share (%), by Price Trend Analysis 2024 & 2032
                                                                    99. Figure 99: Middle East & Africa Cereal Bars Market in South America Revenue (Million), by Country 2024 & 2032
                                                                    100. Figure 100: Middle East & Africa Cereal Bars Market in South America Volume (K Units), by Country 2024 & 2032
                                                                    101. Figure 101: Middle East & Africa Cereal Bars Market in South America Revenue Share (%), by Country 2024 & 2032
                                                                    102. Figure 102: Middle East & Africa Cereal Bars Market in South America Volume Share (%), by Country 2024 & 2032
                                                                    103. Figure 103: Asia Pacific Cereal Bars Market in South America Revenue (Million), by Production Analysis 2024 & 2032
                                                                    104. Figure 104: Asia Pacific Cereal Bars Market in South America Volume (K Units), by Production Analysis 2024 & 2032
                                                                    105. Figure 105: Asia Pacific Cereal Bars Market in South America Revenue Share (%), by Production Analysis 2024 & 2032
                                                                    106. Figure 106: Asia Pacific Cereal Bars Market in South America Volume Share (%), by Production Analysis 2024 & 2032
                                                                    107. Figure 107: Asia Pacific Cereal Bars Market in South America Revenue (Million), by Consumption Analysis 2024 & 2032
                                                                    108. Figure 108: Asia Pacific Cereal Bars Market in South America Volume (K Units), by Consumption Analysis 2024 & 2032
                                                                    109. Figure 109: Asia Pacific Cereal Bars Market in South America Revenue Share (%), by Consumption Analysis 2024 & 2032
                                                                    110. Figure 110: Asia Pacific Cereal Bars Market in South America Volume Share (%), by Consumption Analysis 2024 & 2032
                                                                    111. Figure 111: Asia Pacific Cereal Bars Market in South America Revenue (Million), by Import Market Analysis (Value & Volume) 2024 & 2032
                                                                    112. Figure 112: Asia Pacific Cereal Bars Market in South America Volume (K Units), by Import Market Analysis (Value & Volume) 2024 & 2032
                                                                    113. Figure 113: Asia Pacific Cereal Bars Market in South America Revenue Share (%), by Import Market Analysis (Value & Volume) 2024 & 2032
                                                                    114. Figure 114: Asia Pacific Cereal Bars Market in South America Volume Share (%), by Import Market Analysis (Value & Volume) 2024 & 2032
                                                                    115. Figure 115: Asia Pacific Cereal Bars Market in South America Revenue (Million), by Export Market Analysis (Value & Volume) 2024 & 2032
                                                                    116. Figure 116: Asia Pacific Cereal Bars Market in South America Volume (K Units), by Export Market Analysis (Value & Volume) 2024 & 2032
                                                                    117. Figure 117: Asia Pacific Cereal Bars Market in South America Revenue Share (%), by Export Market Analysis (Value & Volume) 2024 & 2032
                                                                    118. Figure 118: Asia Pacific Cereal Bars Market in South America Volume Share (%), by Export Market Analysis (Value & Volume) 2024 & 2032
                                                                    119. Figure 119: Asia Pacific Cereal Bars Market in South America Revenue (Million), by Price Trend Analysis 2024 & 2032
                                                                    120. Figure 120: Asia Pacific Cereal Bars Market in South America Volume (K Units), by Price Trend Analysis 2024 & 2032
                                                                    121. Figure 121: Asia Pacific Cereal Bars Market in South America Revenue Share (%), by Price Trend Analysis 2024 & 2032
                                                                    122. Figure 122: Asia Pacific Cereal Bars Market in South America Volume Share (%), by Price Trend Analysis 2024 & 2032
                                                                    123. Figure 123: Asia Pacific Cereal Bars Market in South America Revenue (Million), by Country 2024 & 2032
                                                                    124. Figure 124: Asia Pacific Cereal Bars Market in South America Volume (K Units), by Country 2024 & 2032
                                                                    125. Figure 125: Asia Pacific Cereal Bars Market in South America Revenue Share (%), by Country 2024 & 2032
                                                                    126. Figure 126: Asia Pacific Cereal Bars Market in South America Volume Share (%), by Country 2024 & 2032

                                                                    List of Tables

                                                                    1. Table 1: Global Cereal Bars Market in South America Revenue Million Forecast, by Region 2019 & 2032
                                                                    2. Table 2: Global Cereal Bars Market in South America Volume K Units Forecast, by Region 2019 & 2032
                                                                    3. Table 3: Global Cereal Bars Market in South America Revenue Million Forecast, by Production Analysis 2019 & 2032
                                                                    4. Table 4: Global Cereal Bars Market in South America Volume K Units Forecast, by Production Analysis 2019 & 2032
                                                                    5. Table 5: Global Cereal Bars Market in South America Revenue Million Forecast, by Consumption Analysis 2019 & 2032
                                                                    6. Table 6: Global Cereal Bars Market in South America Volume K Units Forecast, by Consumption Analysis 2019 & 2032
                                                                    7. Table 7: Global Cereal Bars Market in South America Revenue Million Forecast, by Import Market Analysis (Value & Volume) 2019 & 2032
                                                                    8. Table 8: Global Cereal Bars Market in South America Volume K Units Forecast, by Import Market Analysis (Value & Volume) 2019 & 2032
                                                                    9. Table 9: Global Cereal Bars Market in South America Revenue Million Forecast, by Export Market Analysis (Value & Volume) 2019 & 2032
                                                                    10. Table 10: Global Cereal Bars Market in South America Volume K Units Forecast, by Export Market Analysis (Value & Volume) 2019 & 2032
                                                                    11. Table 11: Global Cereal Bars Market in South America Revenue Million Forecast, by Price Trend Analysis 2019 & 2032
                                                                    12. Table 12: Global Cereal Bars Market in South America Volume K Units Forecast, by Price Trend Analysis 2019 & 2032
                                                                    13. Table 13: Global Cereal Bars Market in South America Revenue Million Forecast, by Region 2019 & 2032
                                                                    14. Table 14: Global Cereal Bars Market in South America Volume K Units Forecast, by Region 2019 & 2032
                                                                    15. Table 15: Global Cereal Bars Market in South America Revenue Million Forecast, by Country 2019 & 2032
                                                                    16. Table 16: Global Cereal Bars Market in South America Volume K Units Forecast, by Country 2019 & 2032
                                                                    17. Table 17: Brazil Cereal Bars Market in South America Revenue (Million) Forecast, by Application 2019 & 2032
                                                                    18. Table 18: Brazil Cereal Bars Market in South America Volume (K Units) Forecast, by Application 2019 & 2032
                                                                    19. Table 19: Argentina Cereal Bars Market in South America Revenue (Million) Forecast, by Application 2019 & 2032
                                                                    20. Table 20: Argentina Cereal Bars Market in South America Volume (K Units) Forecast, by Application 2019 & 2032
                                                                    21. Table 21: Rest of South America Cereal Bars Market in South America Revenue (Million) Forecast, by Application 2019 & 2032
                                                                    22. Table 22: Rest of South America Cereal Bars Market in South America Volume (K Units) Forecast, by Application 2019 & 2032
                                                                    23. Table 23: Global Cereal Bars Market in South America Revenue Million Forecast, by Production Analysis 2019 & 2032
                                                                    24. Table 24: Global Cereal Bars Market in South America Volume K Units Forecast, by Production Analysis 2019 & 2032
                                                                    25. Table 25: Global Cereal Bars Market in South America Revenue Million Forecast, by Consumption Analysis 2019 & 2032
                                                                    26. Table 26: Global Cereal Bars Market in South America Volume K Units Forecast, by Consumption Analysis 2019 & 2032
                                                                    27. Table 27: Global Cereal Bars Market in South America Revenue Million Forecast, by Import Market Analysis (Value & Volume) 2019 & 2032
                                                                    28. Table 28: Global Cereal Bars Market in South America Volume K Units Forecast, by Import Market Analysis (Value & Volume) 2019 & 2032
                                                                    29. Table 29: Global Cereal Bars Market in South America Revenue Million Forecast, by Export Market Analysis (Value & Volume) 2019 & 2032
                                                                    30. Table 30: Global Cereal Bars Market in South America Volume K Units Forecast, by Export Market Analysis (Value & Volume) 2019 & 2032
                                                                    31. Table 31: Global Cereal Bars Market in South America Revenue Million Forecast, by Price Trend Analysis 2019 & 2032
                                                                    32. Table 32: Global Cereal Bars Market in South America Volume K Units Forecast, by Price Trend Analysis 2019 & 2032
                                                                    33. Table 33: Global Cereal Bars Market in South America Revenue Million Forecast, by Country 2019 & 2032
                                                                    34. Table 34: Global Cereal Bars Market in South America Volume K Units Forecast, by Country 2019 & 2032
                                                                    35. Table 35: United States Cereal Bars Market in South America Revenue (Million) Forecast, by Application 2019 & 2032
                                                                    36. Table 36: United States Cereal Bars Market in South America Volume (K Units) Forecast, by Application 2019 & 2032
                                                                    37. Table 37: Canada Cereal Bars Market in South America Revenue (Million) Forecast, by Application 2019 & 2032
                                                                    38. Table 38: Canada Cereal Bars Market in South America Volume (K Units) Forecast, by Application 2019 & 2032
                                                                    39. Table 39: Mexico Cereal Bars Market in South America Revenue (Million) Forecast, by Application 2019 & 2032
                                                                    40. Table 40: Mexico Cereal Bars Market in South America Volume (K Units) Forecast, by Application 2019 & 2032
                                                                    41. Table 41: Global Cereal Bars Market in South America Revenue Million Forecast, by Production Analysis 2019 & 2032
                                                                    42. Table 42: Global Cereal Bars Market in South America Volume K Units Forecast, by Production Analysis 2019 & 2032
                                                                    43. Table 43: Global Cereal Bars Market in South America Revenue Million Forecast, by Consumption Analysis 2019 & 2032
                                                                    44. Table 44: Global Cereal Bars Market in South America Volume K Units Forecast, by Consumption Analysis 2019 & 2032
                                                                    45. Table 45: Global Cereal Bars Market in South America Revenue Million Forecast, by Import Market Analysis (Value & Volume) 2019 & 2032
                                                                    46. Table 46: Global Cereal Bars Market in South America Volume K Units Forecast, by Import Market Analysis (Value & Volume) 2019 & 2032
                                                                    47. Table 47: Global Cereal Bars Market in South America Revenue Million Forecast, by Export Market Analysis (Value & Volume) 2019 & 2032
                                                                    48. Table 48: Global Cereal Bars Market in South America Volume K Units Forecast, by Export Market Analysis (Value & Volume) 2019 & 2032
                                                                    49. Table 49: Global Cereal Bars Market in South America Revenue Million Forecast, by Price Trend Analysis 2019 & 2032
                                                                    50. Table 50: Global Cereal Bars Market in South America Volume K Units Forecast, by Price Trend Analysis 2019 & 2032
                                                                    51. Table 51: Global Cereal Bars Market in South America Revenue Million Forecast, by Country 2019 & 2032
                                                                    52. Table 52: Global Cereal Bars Market in South America Volume K Units Forecast, by Country 2019 & 2032
                                                                    53. Table 53: Brazil Cereal Bars Market in South America Revenue (Million) Forecast, by Application 2019 & 2032
                                                                    54. Table 54: Brazil Cereal Bars Market in South America Volume (K Units) Forecast, by Application 2019 & 2032
                                                                    55. Table 55: Argentina Cereal Bars Market in South America Revenue (Million) Forecast, by Application 2019 & 2032
                                                                    56. Table 56: Argentina Cereal Bars Market in South America Volume (K Units) Forecast, by Application 2019 & 2032
                                                                    57. Table 57: Rest of South America Cereal Bars Market in South America Revenue (Million) Forecast, by Application 2019 & 2032
                                                                    58. Table 58: Rest of South America Cereal Bars Market in South America Volume (K Units) Forecast, by Application 2019 & 2032
                                                                    59. Table 59: Global Cereal Bars Market in South America Revenue Million Forecast, by Production Analysis 2019 & 2032
                                                                    60. Table 60: Global Cereal Bars Market in South America Volume K Units Forecast, by Production Analysis 2019 & 2032
                                                                    61. Table 61: Global Cereal Bars Market in South America Revenue Million Forecast, by Consumption Analysis 2019 & 2032
                                                                    62. Table 62: Global Cereal Bars Market in South America Volume K Units Forecast, by Consumption Analysis 2019 & 2032
                                                                    63. Table 63: Global Cereal Bars Market in South America Revenue Million Forecast, by Import Market Analysis (Value & Volume) 2019 & 2032
                                                                    64. Table 64: Global Cereal Bars Market in South America Volume K Units Forecast, by Import Market Analysis (Value & Volume) 2019 & 2032
                                                                    65. Table 65: Global Cereal Bars Market in South America Revenue Million Forecast, by Export Market Analysis (Value & Volume) 2019 & 2032
                                                                    66. Table 66: Global Cereal Bars Market in South America Volume K Units Forecast, by Export Market Analysis (Value & Volume) 2019 & 2032
                                                                    67. Table 67: Global Cereal Bars Market in South America Revenue Million Forecast, by Price Trend Analysis 2019 & 2032
                                                                    68. Table 68: Global Cereal Bars Market in South America Volume K Units Forecast, by Price Trend Analysis 2019 & 2032
                                                                    69. Table 69: Global Cereal Bars Market in South America Revenue Million Forecast, by Country 2019 & 2032
                                                                    70. Table 70: Global Cereal Bars Market in South America Volume K Units Forecast, by Country 2019 & 2032
                                                                    71. Table 71: United Kingdom Cereal Bars Market in South America Revenue (Million) Forecast, by Application 2019 & 2032
                                                                    72. Table 72: United Kingdom Cereal Bars Market in South America Volume (K Units) Forecast, by Application 2019 & 2032
                                                                    73. Table 73: Germany Cereal Bars Market in South America Revenue (Million) Forecast, by Application 2019 & 2032
                                                                    74. Table 74: Germany Cereal Bars Market in South America Volume (K Units) Forecast, by Application 2019 & 2032
                                                                    75. Table 75: France Cereal Bars Market in South America Revenue (Million) Forecast, by Application 2019 & 2032
                                                                    76. Table 76: France Cereal Bars Market in South America Volume (K Units) Forecast, by Application 2019 & 2032
                                                                    77. Table 77: Italy Cereal Bars Market in South America Revenue (Million) Forecast, by Application 2019 & 2032
                                                                    78. Table 78: Italy Cereal Bars Market in South America Volume (K Units) Forecast, by Application 2019 & 2032
                                                                    79. Table 79: Spain Cereal Bars Market in South America Revenue (Million) Forecast, by Application 2019 & 2032
                                                                    80. Table 80: Spain Cereal Bars Market in South America Volume (K Units) Forecast, by Application 2019 & 2032
                                                                    81. Table 81: Russia Cereal Bars Market in South America Revenue (Million) Forecast, by Application 2019 & 2032
                                                                    82. Table 82: Russia Cereal Bars Market in South America Volume (K Units) Forecast, by Application 2019 & 2032
                                                                    83. Table 83: Benelux Cereal Bars Market in South America Revenue (Million) Forecast, by Application 2019 & 2032
                                                                    84. Table 84: Benelux Cereal Bars Market in South America Volume (K Units) Forecast, by Application 2019 & 2032
                                                                    85. Table 85: Nordics Cereal Bars Market in South America Revenue (Million) Forecast, by Application 2019 & 2032
                                                                    86. Table 86: Nordics Cereal Bars Market in South America Volume (K Units) Forecast, by Application 2019 & 2032
                                                                    87. Table 87: Rest of Europe Cereal Bars Market in South America Revenue (Million) Forecast, by Application 2019 & 2032
                                                                    88. Table 88: Rest of Europe Cereal Bars Market in South America Volume (K Units) Forecast, by Application 2019 & 2032
                                                                    89. Table 89: Global Cereal Bars Market in South America Revenue Million Forecast, by Production Analysis 2019 & 2032
                                                                    90. Table 90: Global Cereal Bars Market in South America Volume K Units Forecast, by Production Analysis 2019 & 2032
                                                                    91. Table 91: Global Cereal Bars Market in South America Revenue Million Forecast, by Consumption Analysis 2019 & 2032
                                                                    92. Table 92: Global Cereal Bars Market in South America Volume K Units Forecast, by Consumption Analysis 2019 & 2032
                                                                    93. Table 93: Global Cereal Bars Market in South America Revenue Million Forecast, by Import Market Analysis (Value & Volume) 2019 & 2032
                                                                    94. Table 94: Global Cereal Bars Market in South America Volume K Units Forecast, by Import Market Analysis (Value & Volume) 2019 & 2032
                                                                    95. Table 95: Global Cereal Bars Market in South America Revenue Million Forecast, by Export Market Analysis (Value & Volume) 2019 & 2032
                                                                    96. Table 96: Global Cereal Bars Market in South America Volume K Units Forecast, by Export Market Analysis (Value & Volume) 2019 & 2032
                                                                    97. Table 97: Global Cereal Bars Market in South America Revenue Million Forecast, by Price Trend Analysis 2019 & 2032
                                                                    98. Table 98: Global Cereal Bars Market in South America Volume K Units Forecast, by Price Trend Analysis 2019 & 2032
                                                                    99. Table 99: Global Cereal Bars Market in South America Revenue Million Forecast, by Country 2019 & 2032
                                                                    100. Table 100: Global Cereal Bars Market in South America Volume K Units Forecast, by Country 2019 & 2032
                                                                    101. Table 101: Turkey Cereal Bars Market in South America Revenue (Million) Forecast, by Application 2019 & 2032
                                                                    102. Table 102: Turkey Cereal Bars Market in South America Volume (K Units) Forecast, by Application 2019 & 2032
                                                                    103. Table 103: Israel Cereal Bars Market in South America Revenue (Million) Forecast, by Application 2019 & 2032
                                                                    104. Table 104: Israel Cereal Bars Market in South America Volume (K Units) Forecast, by Application 2019 & 2032
                                                                    105. Table 105: GCC Cereal Bars Market in South America Revenue (Million) Forecast, by Application 2019 & 2032
                                                                    106. Table 106: GCC Cereal Bars Market in South America Volume (K Units) Forecast, by Application 2019 & 2032
                                                                    107. Table 107: North Africa Cereal Bars Market in South America Revenue (Million) Forecast, by Application 2019 & 2032
                                                                    108. Table 108: North Africa Cereal Bars Market in South America Volume (K Units) Forecast, by Application 2019 & 2032
                                                                    109. Table 109: South Africa Cereal Bars Market in South America Revenue (Million) Forecast, by Application 2019 & 2032
                                                                    110. Table 110: South Africa Cereal Bars Market in South America Volume (K Units) Forecast, by Application 2019 & 2032
                                                                    111. Table 111: Rest of Middle East & Africa Cereal Bars Market in South America Revenue (Million) Forecast, by Application 2019 & 2032
                                                                    112. Table 112: Rest of Middle East & Africa Cereal Bars Market in South America Volume (K Units) Forecast, by Application 2019 & 2032
                                                                    113. Table 113: Global Cereal Bars Market in South America Revenue Million Forecast, by Production Analysis 2019 & 2032
                                                                    114. Table 114: Global Cereal Bars Market in South America Volume K Units Forecast, by Production Analysis 2019 & 2032
                                                                    115. Table 115: Global Cereal Bars Market in South America Revenue Million Forecast, by Consumption Analysis 2019 & 2032
                                                                    116. Table 116: Global Cereal Bars Market in South America Volume K Units Forecast, by Consumption Analysis 2019 & 2032
                                                                    117. Table 117: Global Cereal Bars Market in South America Revenue Million Forecast, by Import Market Analysis (Value & Volume) 2019 & 2032
                                                                    118. Table 118: Global Cereal Bars Market in South America Volume K Units Forecast, by Import Market Analysis (Value & Volume) 2019 & 2032
                                                                    119. Table 119: Global Cereal Bars Market in South America Revenue Million Forecast, by Export Market Analysis (Value & Volume) 2019 & 2032
                                                                    120. Table 120: Global Cereal Bars Market in South America Volume K Units Forecast, by Export Market Analysis (Value & Volume) 2019 & 2032
                                                                    121. Table 121: Global Cereal Bars Market in South America Revenue Million Forecast, by Price Trend Analysis 2019 & 2032
                                                                    122. Table 122: Global Cereal Bars Market in South America Volume K Units Forecast, by Price Trend Analysis 2019 & 2032
                                                                    123. Table 123: Global Cereal Bars Market in South America Revenue Million Forecast, by Country 2019 & 2032
                                                                    124. Table 124: Global Cereal Bars Market in South America Volume K Units Forecast, by Country 2019 & 2032
                                                                    125. Table 125: China Cereal Bars Market in South America Revenue (Million) Forecast, by Application 2019 & 2032
                                                                    126. Table 126: China Cereal Bars Market in South America Volume (K Units) Forecast, by Application 2019 & 2032
                                                                    127. Table 127: India Cereal Bars Market in South America Revenue (Million) Forecast, by Application 2019 & 2032
                                                                    128. Table 128: India Cereal Bars Market in South America Volume (K Units) Forecast, by Application 2019 & 2032
                                                                    129. Table 129: Japan Cereal Bars Market in South America Revenue (Million) Forecast, by Application 2019 & 2032
                                                                    130. Table 130: Japan Cereal Bars Market in South America Volume (K Units) Forecast, by Application 2019 & 2032
                                                                    131. Table 131: South Korea Cereal Bars Market in South America Revenue (Million) Forecast, by Application 2019 & 2032
                                                                    132. Table 132: South Korea Cereal Bars Market in South America Volume (K Units) Forecast, by Application 2019 & 2032
                                                                    133. Table 133: ASEAN Cereal Bars Market in South America Revenue (Million) Forecast, by Application 2019 & 2032
                                                                    134. Table 134: ASEAN Cereal Bars Market in South America Volume (K Units) Forecast, by Application 2019 & 2032
                                                                    135. Table 135: Oceania Cereal Bars Market in South America Revenue (Million) Forecast, by Application 2019 & 2032
                                                                    136. Table 136: Oceania Cereal Bars Market in South America Volume (K Units) Forecast, by Application 2019 & 2032
                                                                    137. Table 137: Rest of Asia Pacific Cereal Bars Market in South America Revenue (Million) Forecast, by Application 2019 & 2032
                                                                    138. Table 138: Rest of Asia Pacific Cereal Bars Market in South America Volume (K Units) Forecast, by Application 2019 & 2032


                                                                    Frequently Asked Questions

                                                                    1. What is the projected Compound Annual Growth Rate (CAGR) of the Cereal Bars Market in South America?

                                                                    The projected CAGR is approximately 4.30%.

                                                                    2. Which companies are prominent players in the Cereal Bars Market in South America?

                                                                    Key companies in the market include The Kellogg Company, Nestle S A, General Mills Inc, PepsiCo Inc, Kind LLC*List Not Exhaustive, Clif Bar & Company, Mondelez International Inc.

                                                                    3. What are the main segments of the Cereal Bars Market in South America?

                                                                    The market segments include Production Analysis, Consumption Analysis, Import Market Analysis (Value & Volume), Export Market Analysis (Value & Volume), Price Trend Analysis.

                                                                    4. Can you provide details about the market size?

                                                                    The market size is estimated to be USD 10380 Million as of 2022.

                                                                    5. What are some drivers contributing to market growth?

                                                                    Popularity of Convenient Food Products; Expansion of Cold Chain Logistics.

                                                                    6. What are the notable trends driving market growth?

                                                                    Surge In The Consumption Of Healthy Food.

                                                                    7. Are there any restraints impacting market growth?

                                                                    Concerns Over Food Safety and Quality.

                                                                    8. Can you provide examples of recent developments in the market?

                                                                    N/A

                                                                    9. What pricing options are available for accessing the report?

                                                                    Pricing options include single-user, multi-user, and enterprise licenses priced at USD 4750, USD 4950, and USD 6800 respectively.

                                                                    10. Is the market size provided in terms of value or volume?

                                                                    The market size is provided in terms of value, measured in Million and volume, measured in K Units.

                                                                    11. Are there any specific market keywords associated with the report?

                                                                    Yes, the market keyword associated with the report is "Cereal Bars Market in South America," which aids in identifying and referencing the specific market segment covered.

                                                                    12. How do I determine which pricing option suits my needs best?

                                                                    The pricing options vary based on user requirements and access needs. Individual users may opt for single-user licenses, while businesses requiring broader access may choose multi-user or enterprise licenses for cost-effective access to the report.

                                                                    13. Are there any additional resources or data provided in the Cereal Bars Market in South America report?

                                                                    While the report offers comprehensive insights, it's advisable to review the specific contents or supplementary materials provided to ascertain if additional resources or data are available.

                                                                    14. How can I stay updated on further developments or reports in the Cereal Bars Market in South America?

                                                                    To stay informed about further developments, trends, and reports in the Cereal Bars Market in South America, consider subscribing to industry newsletters, following relevant companies and organizations, or regularly checking reputable industry news sources and publications.


                                                                    Methodology

                                                                    Step 1 - Identification of Relevant Samples Size from Population Database

                                                                    Step Chart
                                                                    Bar Chart
                                                                    Method Chart

                                                                    Step 2 - Approaches for Defining Global Market Size (Value, Volume* & Price*)

                                                                    Approach Chart
                                                                    Top-down and bottom-up approaches are used to validate the global market size and estimate the market size for manufactures, regional segments, product, and application.

                                                                    Note*: In applicable scenarios

                                                                    Step 3 - Data Sources

                                                                    Primary Research

                                                                    • Web Analytics
                                                                    • Survey Reports
                                                                    • Research Institute
                                                                    • Latest Research Reports
                                                                    • Opinion Leaders

                                                                    Secondary Research

                                                                    • Annual Reports
                                                                    • White Paper
                                                                    • Latest Press Release
                                                                    • Industry Association
                                                                    • Paid Database
                                                                    • Investor Presentations
                                                                    Analyst Chart

                                                                    Step 4 - Data Triangulation

                                                                    Involves using different sources of information in order to increase the validity of a study

                                                                    These sources are likely to be stakeholders in a program - participants, other researchers, program staff, other community members, and so on.

                                                                    Then we put all data in single framework & apply various statistical tools to find out the dynamic on the market.

                                                                    During the analysis stage, feedback from the stakeholder groups would be compared to determine areas of agreement as well as areas of divergence

                                                                    Additionally, after gathering mixed and scattered data from a wide range of sources, data is triangulated and correlated to come up with estimated figures which are further validated through primary mediums or industry experts, opinion leaders.

                                                                    About Report Pinnacle

                                                                    Report Pinnacle provides top-tier market research, industry intelligence, and actionable insights for finance, technology, healthcare, and consumer sectors. Our reports empower you to make informed decisions and achieve business success.

                                                                    Our expert team combines primary research, data analytics, and industry knowledge to deliver insights you can trust. We offer syndicated reports, custom research, and consulting services tailored to your unique business needs.

                                                                    At Report Pinnacle, we are committed to quality, transparency, and client satisfaction. Every report is rigorously validated to ensure accuracy and relevance. Our global perspective and local expertise help you understand both broad trends and detailed market shifts.

                                                                    Stay ahead with Report Pinnacle. Subscribe to our newsletter for the latest insights and research highlights, and follow us on social media for real-time updates.

                                                                    Report Pinnacle – Your Partner for Reaching the Top in Market Intelligence.

                                                                    artwork spiralartwork spiralRelated Reports
                                                                    artwork underline

                                                                    Unlocking the Future of Germany Food Service Market: Growth and Trends 2025-2033

                                                                    Discover the booming German food service market! Explore key trends, growth projections (5.11% CAGR), leading companies (McDonald's, Edeka, etc.), and regional insights from our in-depth market analysis. Learn how the cafes, QSRs, and diverse outlets are shaping the future of German dining.

                                                                    August 2025
                                                                    Base Year: 2024
                                                                    No Of Pages: 197
                                                                    Price: $3800

                                                                    South Africa Snack Bar Industry in Emerging Markets: Analysis and Projections 2025-2033

                                                                    Discover the booming South African snack bar market! This comprehensive analysis reveals key trends, growth drivers, and competitive insights for 2025-2033, focusing on cereal bars, energy bars, and market leaders like Nestle and Kellogg's. Explore market size, CAGR, and regional breakdowns for informed business decisions.

                                                                    August 2025
                                                                    Base Year: 2024
                                                                    No Of Pages: 197
                                                                    Price: $3800

                                                                    Exploring Australia Plant-Based Protein Industry Market Ecosystem: Insights to 2033

                                                                    Discover the booming Australian plant-based protein market! Explore market size, CAGR, key players (Cargill, ADM, Bunge), and growth drivers like veganism & sustainability. This comprehensive analysis projects impressive growth to 2033, covering segments from soy & pea protein to food & beverage applications.

                                                                    August 2025
                                                                    Base Year: 2024
                                                                    No Of Pages: 197
                                                                    Price: $3800

                                                                    Dairy Ingredients Market Market’s Growth Catalysts

                                                                    Discover the booming dairy ingredients market, projected to reach $86 billion by 2033 with a 4.06% CAGR. Explore key drivers, trends, and challenges impacting whey protein, casein, milk powders, and regional market shares. This in-depth analysis covers leading companies and application segments.

                                                                    August 2025
                                                                    Base Year: 2024
                                                                    No Of Pages: 180
                                                                    Price: $4750

                                                                    Future-Ready Strategies for United Kingdom Gelatin Market Market Growth

                                                                    Discover the booming UK gelatin market! This comprehensive analysis reveals a CAGR of 7.03%, driven by food & beverage, personal care, and evolving consumer trends. Learn about key players, market segmentation, and future growth projections through 2033.

                                                                    July 2025
                                                                    Base Year: 2024
                                                                    No Of Pages: 197
                                                                    Price: $3800

                                                                    Growth Trajectories in Asia Pacific Potato Protein Industry: Industry Outlook to 2033

                                                                    Discover the booming Asia-Pacific potato protein market! This comprehensive analysis reveals key trends, drivers, restraints, and market size projections (2025-2033), highlighting opportunities in plant-based foods, beverage, and animal nutrition. Learn about leading companies and regional market shares.

                                                                    July 2025
                                                                    Base Year: 2024
                                                                    No Of Pages: 234
                                                                    Price: $4750

                                                                    Exploring Innovation in Premium Chocolate Market Industry

                                                                    Discover the booming premium chocolate market! This comprehensive analysis reveals a $35.97B market with an 8.83% CAGR, exploring key trends, drivers, and leading brands like Nestle & Mars. Learn about regional growth and future projections (2025-2033).

                                                                    July 2025
                                                                    Base Year: 2024
                                                                    No Of Pages: 234
                                                                    Price: $4750

                                                                    MEA Alcoholic Beverages Industry Market Overview: Growth and Insights

                                                                    Discover the booming MEA alcoholic beverages market! This in-depth analysis reveals a CAGR of 10-12%, driven by rising incomes and changing lifestyles. Explore market size projections, key players, regional trends (UAE, Saudi Arabia, South Africa), and segment opportunities in beer, wine, and spirits.

                                                                    July 2025
                                                                    Base Year: 2024
                                                                    No Of Pages: 234
                                                                    Price: $4750

                                                                    Strategic Analysis of South America Food Fortifying Agents Market Market Growth 2025-2033

                                                                    Discover the booming South American food fortifying agents market, projected to reach $91.61B by 2025 with a 2.84% CAGR. Learn about key drivers, trends, restraints, and major players shaping this dynamic industry. Explore market segments, regional breakdowns, and future growth projections for Brazil, Argentina, and the rest of South America.

                                                                    July 2025
                                                                    Base Year: 2024
                                                                    No Of Pages: 210
                                                                    Price: $4750

                                                                    Natural Vitamin E Market Projected to Grow at XX CAGR: Insights and Forecasts 2025-2033

                                                                    Discover the booming Natural Vitamin E market, projected to reach \$1.535 Billion by 2033 with a 7.38% CAGR. This in-depth analysis explores market drivers, trends, restraints, and key players like Merck KGaA and BASF SE, across applications like dietary supplements and cosmetics. Learn about regional growth and future opportunities.

                                                                    July 2025
                                                                    Base Year: 2024
                                                                    No Of Pages: 234
                                                                    Price: $4750

                                                                    Food Release Agents Industry Market Outlook and Strategic Insights

                                                                    Discover the latest market trends in the booming food release agents industry. This comprehensive analysis reveals a $735.93 million market in 2025, projected to grow steadily at a CAGR of 2.67% through 2033. Explore key drivers, restraints, segmentation (synthetic vs. bio-based, application-wise), and regional insights. Learn about leading companies and future opportunities.

                                                                    July 2025
                                                                    Base Year: 2024
                                                                    No Of Pages: 234
                                                                    Price: $4750

                                                                    Unveiling Mexico Food Acidulants Industry Growth Patterns: CAGR Analysis and Forecasts 2025-2033

                                                                    Discover the booming Mexico food acidulants market! This comprehensive analysis reveals key trends, drivers, restraints, and leading companies from 2019-2033, including data on citric, acetic, and lactic acid applications in food and beverage sectors. Project your business strategy with our market size forecasts and CAGR projections.

                                                                    July 2025
                                                                    Base Year: 2024
                                                                    No Of Pages: 180
                                                                    Price: $3800

                                                                    Strategic Analysis of Europe Prebiotic Ingredient Industry Market Growth 2025-2033

                                                                    Discover the booming European prebiotic ingredient market! Our in-depth analysis reveals a €9.2B market in 2025, projected to grow at a 7.11% CAGR through 2033, driven by rising demand for gut health solutions. Explore key trends, segments (inulin, FOS, GOS), and leading companies in this dynamic sector.

                                                                    July 2025
                                                                    Base Year: 2024
                                                                    No Of Pages: 234
                                                                    Price: $4750

                                                                    Italy Chocolate Market Market Consumption Trends: Growth Analysis 2025-2033

                                                                    Discover the thriving Italian chocolate market's growth trajectory, projected at a 4.82% CAGR until 2033. This in-depth analysis explores market size, key drivers, trends, restraints, and competitive landscape, highlighting opportunities for both established players and new entrants in the lucrative confectionery sector. Explore distribution channels, confectionery variants, and regional market share.

                                                                    July 2025
                                                                    Base Year: 2024
                                                                    No Of Pages: 197
                                                                    Price: $3800

                                                                    UK Chocolate Market Competitive Advantage: Trends and Opportunities to 2033

                                                                    Discover the booming UK chocolate market! Explore its £11.24 billion valuation, 6.2%+ CAGR, key drivers (premiumization, online sales), restraints, and leading brands like Nestlé & Lindt. Get insights into market segmentation and future trends for 2025-2033.

                                                                    July 2025
                                                                    Base Year: 2024
                                                                    No Of Pages: 180
                                                                    Price: $3800

                                                                    Salicylic Acid Industry Competitive Strategies: Trends and Forecasts 2025-2033

                                                                    Discover the booming salicylic acid market! Explore key trends, growth drivers, and leading companies shaping this dynamic industry, projected to reach $XX million by 2033 with a 4.80% CAGR. Learn about its applications in cosmetics, pharmaceuticals, and food & beverage.

                                                                    July 2025
                                                                    Base Year: 2024
                                                                    No Of Pages: 234
                                                                    Price: $4750

                                                                    U.S. Food Colorants Industry Market Trends and Strategic Roadmap

                                                                    Discover the booming U.S. food colorants market! This in-depth analysis reveals key trends, drivers, and restraints shaping the $2.5B (2025) industry, including growth forecasts to 2033, regional breakdowns, and leading companies like DDW Inc and BASF. Learn about the rise of natural colorants and the impact on synthetic alternatives.

                                                                    July 2025
                                                                    Base Year: 2024
                                                                    No Of Pages: 197
                                                                    Price: $3800

                                                                    Europe Health Drinks Market Insightful Market Analysis: Trends and Opportunities 2025-2033

                                                                    The European health drinks market is booming, projected to reach €75.68 billion by 2033 with a CAGR of 4.61%. Discover key trends, driving forces, and leading companies shaping this dynamic sector. Explore market segmentation, regional analysis and future growth opportunities in the health drink industry.

                                                                    July 2025
                                                                    Base Year: 2024
                                                                    No Of Pages: 234
                                                                    Price: $4750

                                                                    Strategic Projections for Australia Animal Protein Market Market Expansion

                                                                    Discover the booming Australian animal protein market! This comprehensive analysis reveals key trends, drivers, and restraints shaping the $1.5B+ industry (2025 est.), including growth forecasts to 2033, key players like Fonterra & Kerry Group, and segment breakdowns for whey, casein, collagen & more. Explore market opportunities now!

                                                                    July 2025
                                                                    Base Year: 2024
                                                                    No Of Pages: 197
                                                                    Price: $3800

                                                                    Decoding Europe Noodles and Pasta Market’s Market Size Potential by 2033

                                                                    Discover the booming European noodles and pasta market! This comprehensive analysis reveals a CAGR of 7.55%, driven by convenience, health trends, and e-commerce growth. Learn about key players, market segmentation, and future projections for this €20 Billion+ market.

                                                                    July 2025
                                                                    Base Year: 2024
                                                                    No Of Pages: 234
                                                                    Price: $4750
                                                                    • Home
                                                                    • About Us
                                                                    • Industries
                                                                      • Aerospace & Defense
                                                                      • Agriculture
                                                                      • Animal Nutrition & Wellness
                                                                      • Automotive
                                                                      • Chemicals & Materials
                                                                      • Consumer Goods and Services
                                                                      • Energy & Power
                                                                      • Financial Services and Investment Intelligence
                                                                      • Food & Beverage
                                                                      • Home and Property Improvement
                                                                      • Hospitality and Tourism
                                                                      • Logistics
                                                                      • Manufacturing Products and Services
                                                                      • Packaging
                                                                      • Professional and Commercial Services
                                                                      • Real Estate and Construction
                                                                      • Retail
                                                                      • Technology, Media and Telecom
                                                                      • Healthcare
                                                                    • Services
                                                                    • Contact
                                                                    Main Logo
                                                                    • Home
                                                                    • About Us
                                                                    • Industries
                                                                      • Aerospace & Defense
                                                                      • Agriculture
                                                                      • Animal Nutrition & Wellness
                                                                      • Automotive
                                                                      • Chemicals & Materials
                                                                      • Consumer Goods and Services
                                                                      • Energy & Power
                                                                      • Financial Services and Investment Intelligence
                                                                      • Food & Beverage
                                                                      • Home and Property Improvement
                                                                      • Hospitality and Tourism
                                                                      • Logistics
                                                                      • Manufacturing Products and Services
                                                                      • Packaging
                                                                      • Professional and Commercial Services
                                                                      • Real Estate and Construction
                                                                      • Retail
                                                                      • Technology, Media and Telecom
                                                                      • Healthcare
                                                                    • Services
                                                                    • Contact
                                                                    +17162654855
                                                                    [email protected]

                                                                    +17162654855

                                                                    [email protected]

                                                                    Business Address

                                                                    Head Office

                                                                    Office no. A 5010, fifth floor, Solitaire Business Hub, Near Phoenix mall, Pune, Maharashtra 411014

                                                                    Contact Information

                                                                    Craig Francis

                                                                    Business Development Head

                                                                    +17162654855

                                                                    [email protected]

                                                                    Connect With Us

                                                                    Secure Payment Partners

                                                                    payment image
                                                                    RetailLogisticsPackagingAutomotiveHealthcareAgricultureEnergy & PowerFood & BeverageAerospace & DefenseChemicals & MaterialsHospitality and TourismAnimal Nutrition & WellnessConsumer Goods and ServicesReal Estate and ConstructionHome and Property ImprovementTechnology, Media and TelecomManufacturing Products and ServicesFinancial Services and Investment Intelligence

                                                                    © 2025 All rights reserved


                                                                    Privacy Policy
                                                                    Terms and Conditions
                                                                    FAQ