Key Insights
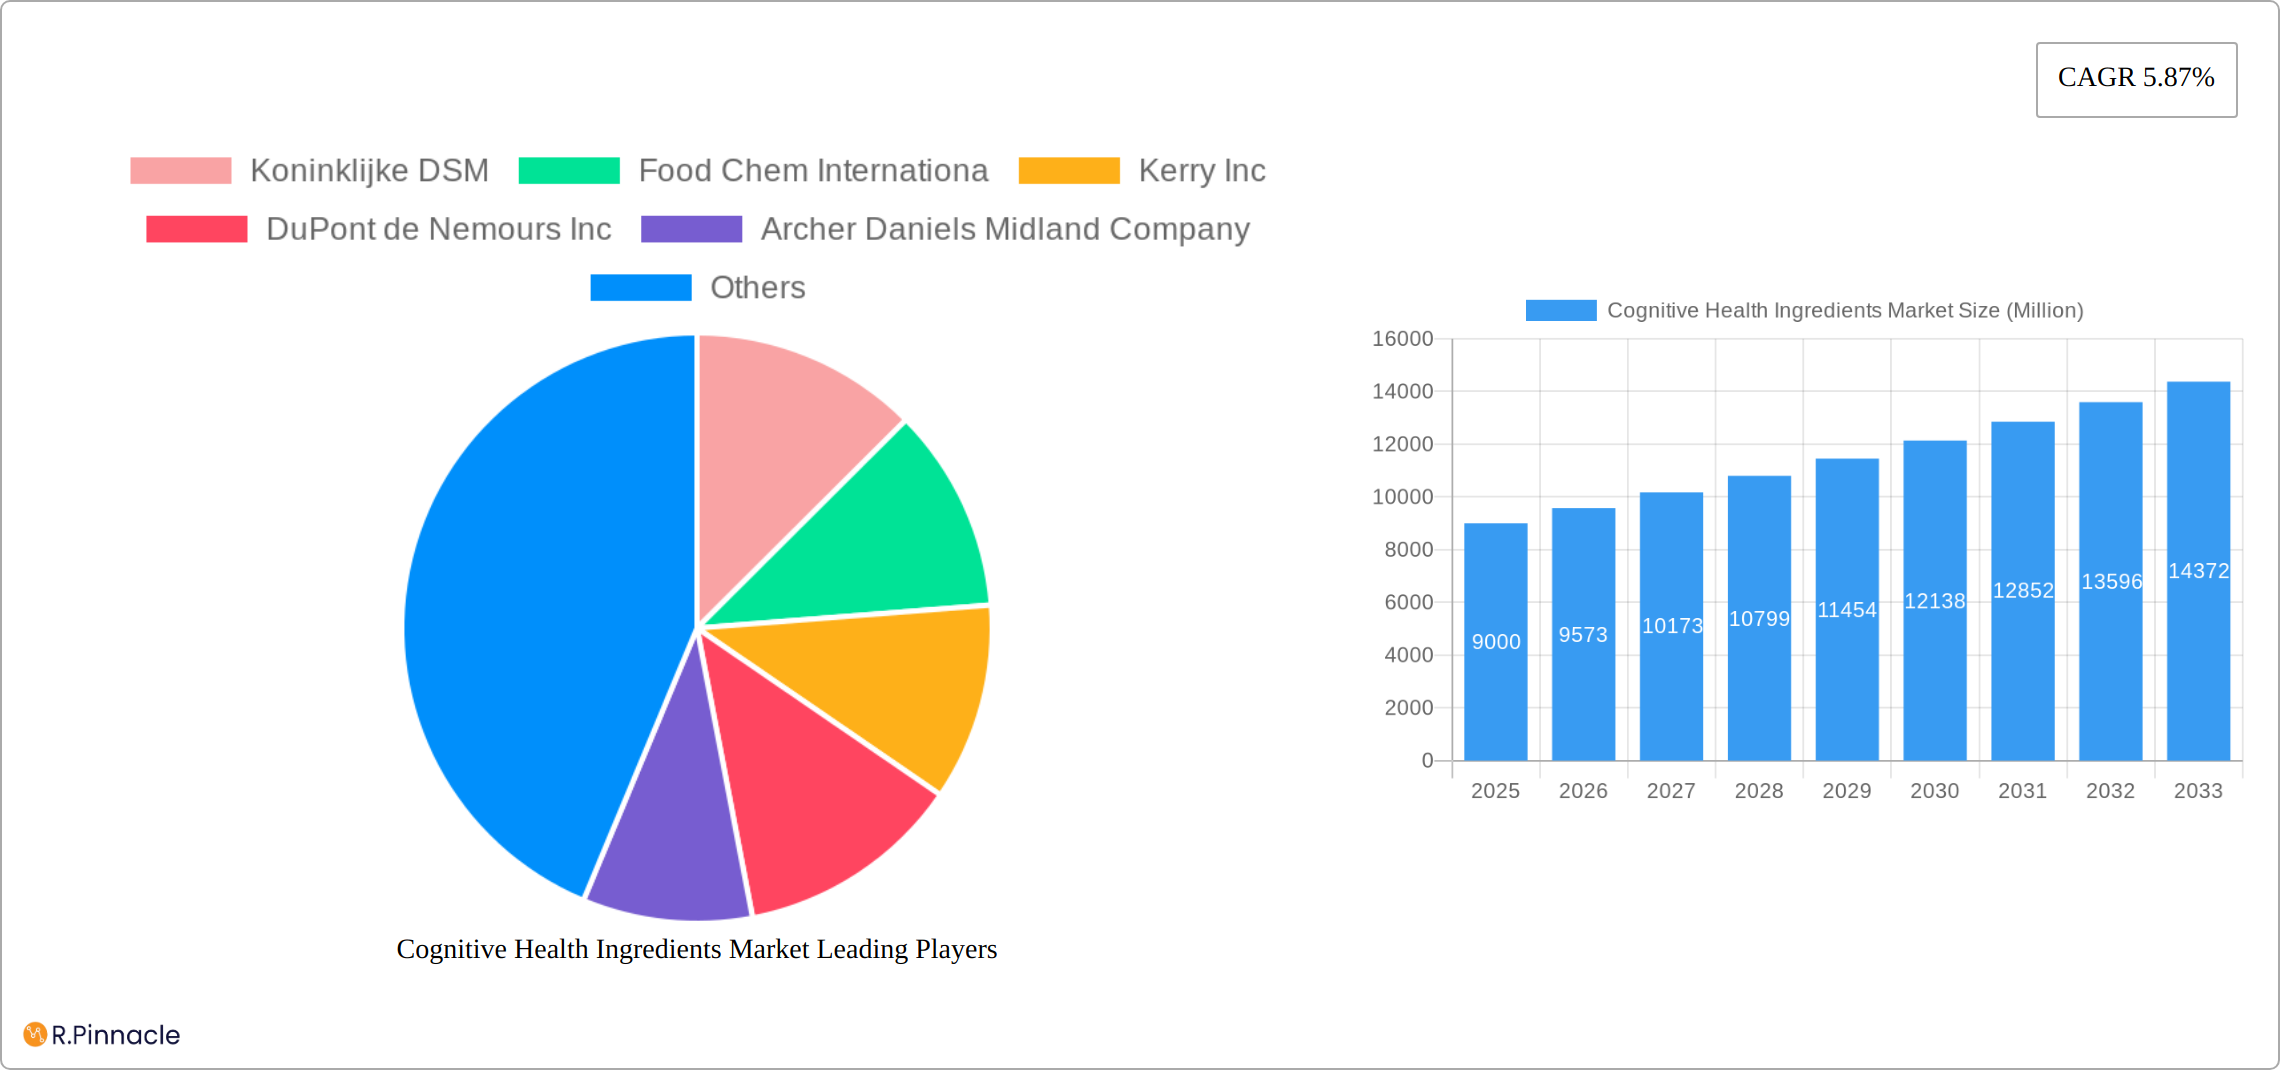
The Cognitive Health Ingredients market, valued at $9 billion in 2025, is projected to experience robust growth, driven by a rising aging population globally and increasing awareness of cognitive decline prevention and treatment. A compound annual growth rate (CAGR) of 5.87% is anticipated from 2025 to 2033, indicating significant market expansion. Key drivers include the growing prevalence of age-related cognitive impairments like Alzheimer's disease and dementia, coupled with increased consumer demand for natural and functional food and beverage products that enhance brain health. This demand fuels innovation in product development, with a focus on efficacious ingredients like vitamins, minerals, omega-3 fatty acids, probiotics, and botanical extracts. The market is segmented by product type (Vitamins and Minerals, Omega PUFA, Probiotics & Prebiotics, Amino Acids, Proteins & Peptides, Fibers, Botanical Extracts) and application (Functional Food and Beverages, Dietary Supplements), offering diverse avenues for growth. Leading players like Koninklijke DSM, Kerry Inc., and BASF SE are investing heavily in research and development, expanding their product portfolios, and forging strategic partnerships to solidify their market positions. Regional variations are expected, with North America and Europe maintaining significant market shares due to higher awareness and disposable incomes, while Asia Pacific is anticipated to exhibit considerable growth potential, driven by rising middle-class populations and increased healthcare expenditure.
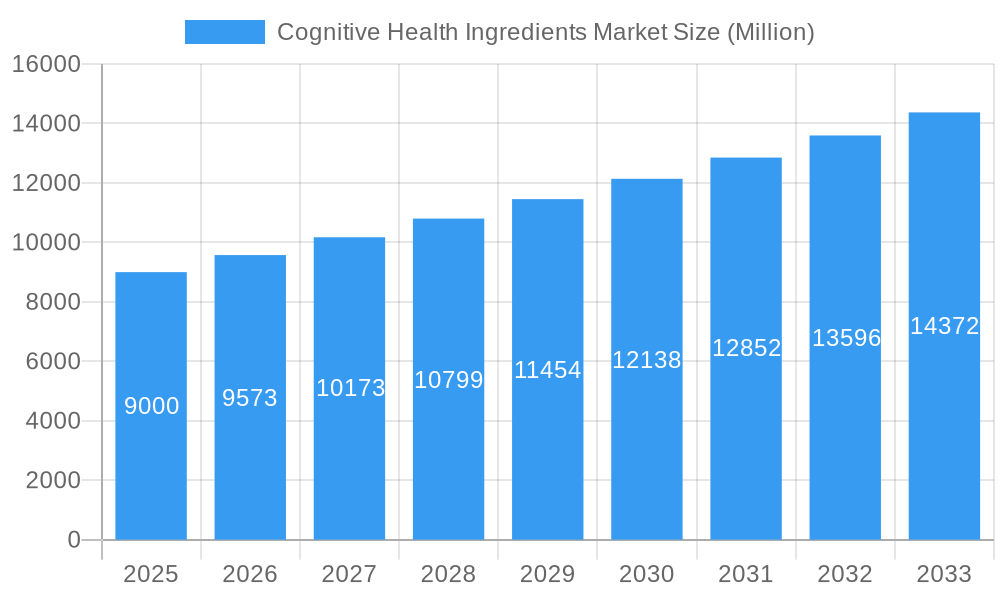
Cognitive Health Ingredients Market Market Size (In Billion)
While the market shows immense promise, certain challenges exist. Regulatory hurdles and stringent quality control requirements for dietary supplements can pose significant barriers to market entry for new players. Furthermore, consumer education and awareness regarding the efficacy of different cognitive health ingredients need to be strengthened to ensure optimal market penetration. Nevertheless, the overall market outlook remains positive, fueled by consistent scientific advancements and growing consumer interest in cognitive enhancement and maintaining mental acuity throughout their lifespan. This will fuel the growth of the market as well as new players will enter the market. The market is also expected to see growth in niche areas, like personalized nutrition and targeted interventions based on individual genetic predispositions.
Cognitive Health Ingredients Market Company Market Share
This in-depth report provides a comprehensive analysis of the Cognitive Health Ingredients market, offering invaluable insights for industry professionals, investors, and strategic decision-makers. Covering the period from 2019 to 2033, with a base year of 2025 and a forecast period of 2025-2033, this report delivers actionable intelligence on market dynamics, growth drivers, challenges, and future opportunities. The market is projected to reach xx Million by 2033, exhibiting a CAGR of xx% during the forecast period.
Cognitive Health Ingredients Market Market Structure & Innovation Trends
This section analyzes the competitive landscape, innovation drivers, and regulatory environment of the Cognitive Health Ingredients market. The market exhibits a moderately concentrated structure, with key players like Koninklijke DSM, Food Chem International, Kerry Inc, DuPont de Nemours Inc, Archer Daniels Midland Company, BASF SE, Corbion N.V., Cargill Inc, Ingredion Incorporated, and Rousselot BV holding significant market share. Market share dynamics are influenced by factors such as R&D investments, product innovation, and strategic acquisitions. The total market value in 2024 was estimated at xx Million.
- Market Concentration: The top 5 players account for approximately xx% of the total market share in 2024.
- Innovation Drivers: Growing consumer awareness of cognitive health, technological advancements in ingredient extraction and formulation, and the increasing demand for functional foods and dietary supplements are key drivers of innovation.
- Regulatory Frameworks: Stringent regulatory approvals for novel ingredients and evolving labeling requirements influence market dynamics.
- Product Substitutes: The market faces competition from alternative health solutions, impacting the overall market growth.
- M&A Activities: The market has witnessed several mergers and acquisitions in recent years, with deal values averaging xx Million per transaction in the period 2019-2024. These activities aim to expand product portfolios, enhance market reach, and achieve economies of scale. The impact of such transactions on the market share will be discussed further in the report.
- End-User Demographics: The target demographic includes the aging population, individuals concerned about cognitive decline, and consumers seeking to enhance their cognitive performance.
Cognitive Health Ingredients Market Market Dynamics & Trends
The Cognitive Health Ingredients market is experiencing robust and dynamic growth, propelled by a confluence of compelling factors. A primary catalyst is the escalating prevalence of age-related cognitive decline and neurodegenerative diseases, which is driving proactive consumer interest in brain health solutions. This heightened consumer awareness is further amplified by a distinct shift towards natural and functional foods, positioning these ingredients as integral components of a healthy diet. Technological advancements in ingredient processing, encapsulation, and sophisticated delivery systems are continuously enhancing both the efficacy and consumer appeal of cognitive health products. The competitive landscape is characterized by strategic product diversification, cross-industry partnerships, and innovative marketing campaigns designed to capture a larger market share. The market's projected CAGR of **[Insert CAGR here]%** underscores its considerable growth potential across a diverse range of application segments. We are observing a significant increase in the market penetration of cognitive health ingredients within the functional foods and beverages sector, while the dietary supplements segment continues to demonstrate substantial and ongoing growth potential.
Dominant Regions & Segments in Cognitive Health Ingredients Market
North America currently commands the largest share of the Cognitive Health Ingredients market. This dominance is attributed to high consumer spending on health and wellness products, coupled with a significant prevalence of age-related cognitive disorders and a strong demand for evidence-based solutions. Europe stands as another pivotal market, exhibiting robust growth potential fueled by increasing health consciousness and supportive government initiatives. Within product types, Vitamins and Minerals and Omega Polyunsaturated Fatty Acids (PUFA) are currently leading the market, showcasing promising future expansion due to their well-established cognitive benefits. The Functional Food and Beverages application segment is anticipated to maintain its leading position, driven by the growing consumer preference for convenient, palatable, and integrated health-enhancing food options.
Key Drivers by Region:
- North America: High disposable income, a well-established regulatory framework that encourages innovation, advanced healthcare infrastructure, and a proactive consumer base prioritizing preventative health.
- Europe: Increasing health consciousness among a large and aging population, supportive government policies promoting healthy aging, and a growing demand for scientifically validated cognitive health solutions.
- Asia-Pacific: A rapidly expanding middle class with rising disposable incomes, a burgeoning awareness of cognitive health as a critical aspect of overall well-being, and significant untapped growth potential in emerging economies seeking to improve quality of life.
Dominant Segments:
- Product Type: Vitamins and Minerals, and Omega PUFA (including DHA and EPA).
- Application: Functional Food and Beverages, followed closely by Dietary Supplements.
Cognitive Health Ingredients Market Product Innovations
Recent innovations focus on enhancing ingredient efficacy, bioavailability, and sensory appeal. For example, the development of encapsulated delivery systems enhances the absorption of active compounds. The integration of cognitive health ingredients into novel food and beverage formats addresses consumer preferences for convenience and taste. These innovations aim to improve product differentiation and address unmet consumer needs in the market.
Report Scope & Segmentation Analysis
This report segments the Cognitive Health Ingredients market by product type (Vitamins and Minerals, Omega PUFA, Probiotics & Prebiotics, Amino Acids, Proteins & Peptides, Fibers, Botanical Extracts) and application (Functional Food and Beverages, Dietary Supplements). Each segment's growth trajectory is analyzed, considering market size, competitive intensity, and projected growth rates for the forecast period. For example, the Vitamins and Minerals segment is projected to experience a CAGR of xx%, while the Functional Food and Beverages application segment is anticipated to show a CAGR of xx%.
Key Drivers of Cognitive Health Ingredients Market Growth
Key drivers include the rising prevalence of cognitive disorders, increasing health consciousness, and the growing demand for functional foods and dietary supplements. Technological advancements in ingredient extraction, formulation, and delivery systems are also driving market growth. Favorable government regulations and increasing investments in R&D are further contributing factors.
Challenges in the Cognitive Health Ingredients Market Sector
The Cognitive Health Ingredients market, despite its strong growth trajectory, navigates several significant challenges. Stringent and evolving regulatory requirements across different regions can impede product approvals and market entry. Fluctuations in raw material prices, driven by agricultural yields and geopolitical factors, can impact production costs and profit margins. The market also faces intense competition from a growing number of players, necessitating continuous innovation and differentiation. Consumer skepticism regarding the efficacy of certain ingredients, particularly those with less robust scientific backing, can pose a hurdle to widespread adoption. Maintaining consistent product quality and ensuring supply chain stability, especially for natural ingredients, are ongoing challenges. These factors collectively influence market dynamics and necessitate strategic planning and operational resilience from market players.
Emerging Opportunities in Cognitive Health Ingredients Market
Emerging opportunities include the development of personalized cognitive health solutions, the expansion into new geographical markets (particularly in developing economies), and the exploration of innovative delivery systems for enhanced bioavailability. Growing consumer interest in preventative healthcare creates significant market potential.
Leading Players in the Cognitive Health Ingredients Market Market
- Koninklijke DSM
- Food Chem International
- Kerry Inc
- DuPont de Nemours Inc
- Archer Daniels Midland Company
- BASF SE
- Corbion N.V.
- Cargill Inc
- Ingredion Incorporated
- Rousselot BV
Key Developments in Cognitive Health Ingredients Market Industry
- 2022 Q3: Koninklijke DSM, a global science-based company, launched a new range of innovative cognitive health ingredients designed to support memory and focus, further strengthening their portfolio in the brain health market.
- 2023 Q1: Kerry Inc., a leading taste and nutrition company, significantly expanded its production capacity for Omega-3 fatty acids, responding to the growing global demand for these essential nutrients crucial for brain health.
- 2024 Q2: Cargill Inc., a global food corporation, strategically acquired a smaller company specializing in high-quality botanical extracts with purported cognitive benefits, aiming to broaden its offering and expertise in the natural ingredient space for cognitive health applications. Further details of these strategic initiatives and their market impact will be elaborated upon in the comprehensive report.
Future Outlook for Cognitive Health Ingredients Market Market
The Cognitive Health Ingredients market is strategically poised for sustained and accelerated growth in the coming years, driven by a powerful combination of demographic, societal, and technological trends. The aging global population, a fundamental demographic shift, will continue to be a primary engine of demand as individuals seek to maintain cognitive function later in life. Coupled with this is a pervasive and rising health consciousness, where consumers are increasingly proactive in managing their well-being, including cognitive vitality. Technological innovations in ingredient science, bioavailability, and personalized nutrition are expected to unlock new possibilities and enhance existing solutions, fueling market expansion. Strategic partnerships, focused product diversification into niche areas, and targeted expansion into new and emerging geographical markets will be critical for industry players aiming to capitalize on this significant growth potential. The market is anticipated to witness substantial and diversified expansion across various segments, presenting promising and lucrative opportunities for both established industry leaders and agile new entrants.
Cognitive Health Ingredients Market Segmentation
-
1. Product Type
- 1.1. Vitamins and Minerals
- 1.2. Omega PUFA
- 1.3. Probiotics & Prebiotics
- 1.4. Amino Acids, Proteins & Peptides
- 1.5. Fibers
- 1.6. Botanical Extracts
-
2. Application
- 2.1. Functional Food and Beverages
- 2.2. Dietary Supplements
Cognitive Health Ingredients Market Segmentation By Geography
-
1. North America
- 1.1. United States
- 1.2. Canada
- 1.3. Mexico
- 1.4. Rest of North America
-
2. Europe
- 2.1. Germany
- 2.2. United Kingdom
- 2.3. France
- 2.4. Russia
- 2.5. Spain
- 2.6. Italy
- 2.7. Rest of Europe
-
3. Asia Pacific
- 3.1. India
- 3.2. China
- 3.3. Japan
- 3.4. Australia
- 3.5. Rest of Asia Pacific
-
4. South America
- 4.1. Brazil
- 4.2. Argentina
- 4.3. Rest of South America
-
5. Middle East and Africa
- 5.1. South Africa
- 5.2. Saudi Arabia
- 5.3. Rest of Middle East and Africa
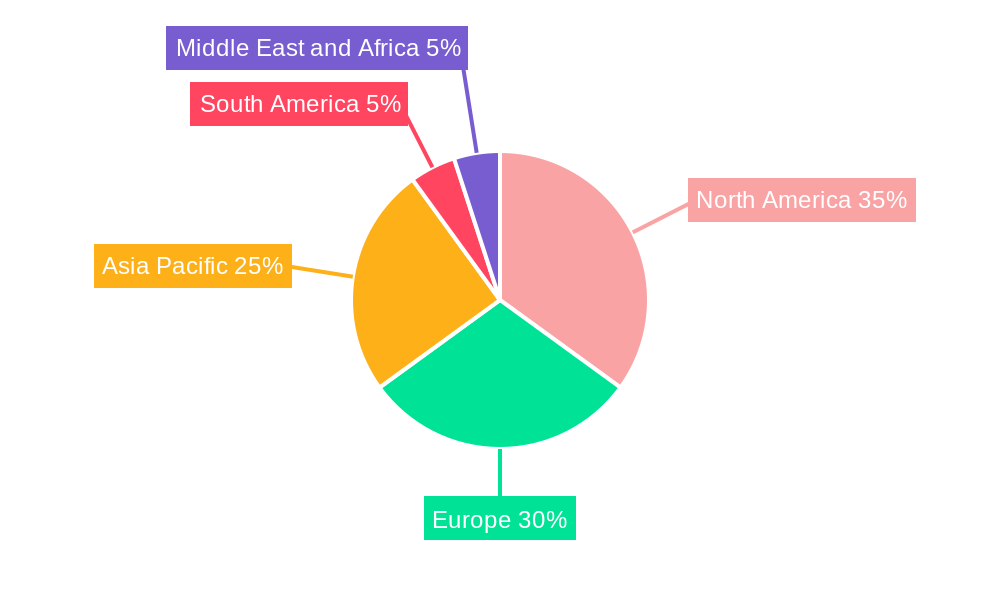
Cognitive Health Ingredients Market Regional Market Share
Geographic Coverage of Cognitive Health Ingredients Market
Cognitive Health Ingredients Market REPORT HIGHLIGHTS
| Aspects | Details |
|---|---|
| Study Period | 2020-2034 |
| Base Year | 2025 |
| Estimated Year | 2026 |
| Forecast Period | 2026-2034 |
| Historical Period | 2020-2025 |
| Growth Rate | CAGR of 5.87% from 2020-2034 |
| Segmentation |
|
Table of Contents
- 1. Introduction
- 1.1. Research Scope
- 1.2. Market Segmentation
- 1.3. Research Methodology
- 1.4. Definitions and Assumptions
- 2. Executive Summary
- 2.1. Introduction
- 3. Market Dynamics
- 3.1. Introduction
- 3.2. Market Drivers
- 3.2.1. Increasing Demand For Convenience & Processed Food
- 3.3. Market Restrains
- 3.3.1. Increased Consumer Awareness On Side-Effects Of Chemical Additives
- 3.4. Market Trends
- 3.4.1. Natural Health Ingredients Perceived to Be Highly Effective among Arthritis Patients
- 4. Market Factor Analysis
- 4.1. Porters Five Forces
- 4.2. Supply/Value Chain
- 4.3. PESTEL analysis
- 4.4. Market Entropy
- 4.5. Patent/Trademark Analysis
- 5. Global Cognitive Health Ingredients Market Analysis, Insights and Forecast, 2020-2032
- 5.1. Market Analysis, Insights and Forecast - by Product Type
- 5.1.1. Vitamins and Minerals
- 5.1.2. Omega PUFA
- 5.1.3. Probiotics & Prebiotics
- 5.1.4. Amino Acids, Proteins & Peptides
- 5.1.5. Fibers
- 5.1.6. Botanical Extracts
- 5.2. Market Analysis, Insights and Forecast - by Application
- 5.2.1. Functional Food and Beverages
- 5.2.2. Dietary Supplements
- 5.3. Market Analysis, Insights and Forecast - by Region
- 5.3.1. North America
- 5.3.2. Europe
- 5.3.3. Asia Pacific
- 5.3.4. South America
- 5.3.5. Middle East and Africa
- 5.1. Market Analysis, Insights and Forecast - by Product Type
- 6. North America Cognitive Health Ingredients Market Analysis, Insights and Forecast, 2020-2032
- 6.1. Market Analysis, Insights and Forecast - by Product Type
- 6.1.1. Vitamins and Minerals
- 6.1.2. Omega PUFA
- 6.1.3. Probiotics & Prebiotics
- 6.1.4. Amino Acids, Proteins & Peptides
- 6.1.5. Fibers
- 6.1.6. Botanical Extracts
- 6.2. Market Analysis, Insights and Forecast - by Application
- 6.2.1. Functional Food and Beverages
- 6.2.2. Dietary Supplements
- 6.1. Market Analysis, Insights and Forecast - by Product Type
- 7. Europe Cognitive Health Ingredients Market Analysis, Insights and Forecast, 2020-2032
- 7.1. Market Analysis, Insights and Forecast - by Product Type
- 7.1.1. Vitamins and Minerals
- 7.1.2. Omega PUFA
- 7.1.3. Probiotics & Prebiotics
- 7.1.4. Amino Acids, Proteins & Peptides
- 7.1.5. Fibers
- 7.1.6. Botanical Extracts
- 7.2. Market Analysis, Insights and Forecast - by Application
- 7.2.1. Functional Food and Beverages
- 7.2.2. Dietary Supplements
- 7.1. Market Analysis, Insights and Forecast - by Product Type
- 8. Asia Pacific Cognitive Health Ingredients Market Analysis, Insights and Forecast, 2020-2032
- 8.1. Market Analysis, Insights and Forecast - by Product Type
- 8.1.1. Vitamins and Minerals
- 8.1.2. Omega PUFA
- 8.1.3. Probiotics & Prebiotics
- 8.1.4. Amino Acids, Proteins & Peptides
- 8.1.5. Fibers
- 8.1.6. Botanical Extracts
- 8.2. Market Analysis, Insights and Forecast - by Application
- 8.2.1. Functional Food and Beverages
- 8.2.2. Dietary Supplements
- 8.1. Market Analysis, Insights and Forecast - by Product Type
- 9. South America Cognitive Health Ingredients Market Analysis, Insights and Forecast, 2020-2032
- 9.1. Market Analysis, Insights and Forecast - by Product Type
- 9.1.1. Vitamins and Minerals
- 9.1.2. Omega PUFA
- 9.1.3. Probiotics & Prebiotics
- 9.1.4. Amino Acids, Proteins & Peptides
- 9.1.5. Fibers
- 9.1.6. Botanical Extracts
- 9.2. Market Analysis, Insights and Forecast - by Application
- 9.2.1. Functional Food and Beverages
- 9.2.2. Dietary Supplements
- 9.1. Market Analysis, Insights and Forecast - by Product Type
- 10. Middle East and Africa Cognitive Health Ingredients Market Analysis, Insights and Forecast, 2020-2032
- 10.1. Market Analysis, Insights and Forecast - by Product Type
- 10.1.1. Vitamins and Minerals
- 10.1.2. Omega PUFA
- 10.1.3. Probiotics & Prebiotics
- 10.1.4. Amino Acids, Proteins & Peptides
- 10.1.5. Fibers
- 10.1.6. Botanical Extracts
- 10.2. Market Analysis, Insights and Forecast - by Application
- 10.2.1. Functional Food and Beverages
- 10.2.2. Dietary Supplements
- 10.1. Market Analysis, Insights and Forecast - by Product Type
- 11. Competitive Analysis
- 11.1. Global Market Share Analysis 2025
- 11.2. Company Profiles
- 11.2.1 Koninklijke DSM
- 11.2.1.1. Overview
- 11.2.1.2. Products
- 11.2.1.3. SWOT Analysis
- 11.2.1.4. Recent Developments
- 11.2.1.5. Financials (Based on Availability)
- 11.2.2 Food Chem Internationa
- 11.2.2.1. Overview
- 11.2.2.2. Products
- 11.2.2.3. SWOT Analysis
- 11.2.2.4. Recent Developments
- 11.2.2.5. Financials (Based on Availability)
- 11.2.3 Kerry Inc
- 11.2.3.1. Overview
- 11.2.3.2. Products
- 11.2.3.3. SWOT Analysis
- 11.2.3.4. Recent Developments
- 11.2.3.5. Financials (Based on Availability)
- 11.2.4 DuPont de Nemours Inc
- 11.2.4.1. Overview
- 11.2.4.2. Products
- 11.2.4.3. SWOT Analysis
- 11.2.4.4. Recent Developments
- 11.2.4.5. Financials (Based on Availability)
- 11.2.5 Archer Daniels Midland Company
- 11.2.5.1. Overview
- 11.2.5.2. Products
- 11.2.5.3. SWOT Analysis
- 11.2.5.4. Recent Developments
- 11.2.5.5. Financials (Based on Availability)
- 11.2.6 BASF SE
- 11.2.6.1. Overview
- 11.2.6.2. Products
- 11.2.6.3. SWOT Analysis
- 11.2.6.4. Recent Developments
- 11.2.6.5. Financials (Based on Availability)
- 11.2.7 Corbion N V
- 11.2.7.1. Overview
- 11.2.7.2. Products
- 11.2.7.3. SWOT Analysis
- 11.2.7.4. Recent Developments
- 11.2.7.5. Financials (Based on Availability)
- 11.2.8 Cargill Inc
- 11.2.8.1. Overview
- 11.2.8.2. Products
- 11.2.8.3. SWOT Analysis
- 11.2.8.4. Recent Developments
- 11.2.8.5. Financials (Based on Availability)
- 11.2.9 Ingredion Incorporated
- 11.2.9.1. Overview
- 11.2.9.2. Products
- 11.2.9.3. SWOT Analysis
- 11.2.9.4. Recent Developments
- 11.2.9.5. Financials (Based on Availability)
- 11.2.10 Rousselot BV
- 11.2.10.1. Overview
- 11.2.10.2. Products
- 11.2.10.3. SWOT Analysis
- 11.2.10.4. Recent Developments
- 11.2.10.5. Financials (Based on Availability)
- 11.2.1 Koninklijke DSM
List of Figures
- Figure 1: Global Cognitive Health Ingredients Market Revenue Breakdown (Million, %) by Region 2025 & 2033
- Figure 2: Global Cognitive Health Ingredients Market Volume Breakdown (K Tons, %) by Region 2025 & 2033
- Figure 3: North America Cognitive Health Ingredients Market Revenue (Million), by Product Type 2025 & 2033
- Figure 4: North America Cognitive Health Ingredients Market Volume (K Tons), by Product Type 2025 & 2033
- Figure 5: North America Cognitive Health Ingredients Market Revenue Share (%), by Product Type 2025 & 2033
- Figure 6: North America Cognitive Health Ingredients Market Volume Share (%), by Product Type 2025 & 2033
- Figure 7: North America Cognitive Health Ingredients Market Revenue (Million), by Application 2025 & 2033
- Figure 8: North America Cognitive Health Ingredients Market Volume (K Tons), by Application 2025 & 2033
- Figure 9: North America Cognitive Health Ingredients Market Revenue Share (%), by Application 2025 & 2033
- Figure 10: North America Cognitive Health Ingredients Market Volume Share (%), by Application 2025 & 2033
- Figure 11: North America Cognitive Health Ingredients Market Revenue (Million), by Country 2025 & 2033
- Figure 12: North America Cognitive Health Ingredients Market Volume (K Tons), by Country 2025 & 2033
- Figure 13: North America Cognitive Health Ingredients Market Revenue Share (%), by Country 2025 & 2033
- Figure 14: North America Cognitive Health Ingredients Market Volume Share (%), by Country 2025 & 2033
- Figure 15: Europe Cognitive Health Ingredients Market Revenue (Million), by Product Type 2025 & 2033
- Figure 16: Europe Cognitive Health Ingredients Market Volume (K Tons), by Product Type 2025 & 2033
- Figure 17: Europe Cognitive Health Ingredients Market Revenue Share (%), by Product Type 2025 & 2033
- Figure 18: Europe Cognitive Health Ingredients Market Volume Share (%), by Product Type 2025 & 2033
- Figure 19: Europe Cognitive Health Ingredients Market Revenue (Million), by Application 2025 & 2033
- Figure 20: Europe Cognitive Health Ingredients Market Volume (K Tons), by Application 2025 & 2033
- Figure 21: Europe Cognitive Health Ingredients Market Revenue Share (%), by Application 2025 & 2033
- Figure 22: Europe Cognitive Health Ingredients Market Volume Share (%), by Application 2025 & 2033
- Figure 23: Europe Cognitive Health Ingredients Market Revenue (Million), by Country 2025 & 2033
- Figure 24: Europe Cognitive Health Ingredients Market Volume (K Tons), by Country 2025 & 2033
- Figure 25: Europe Cognitive Health Ingredients Market Revenue Share (%), by Country 2025 & 2033
- Figure 26: Europe Cognitive Health Ingredients Market Volume Share (%), by Country 2025 & 2033
- Figure 27: Asia Pacific Cognitive Health Ingredients Market Revenue (Million), by Product Type 2025 & 2033
- Figure 28: Asia Pacific Cognitive Health Ingredients Market Volume (K Tons), by Product Type 2025 & 2033
- Figure 29: Asia Pacific Cognitive Health Ingredients Market Revenue Share (%), by Product Type 2025 & 2033
- Figure 30: Asia Pacific Cognitive Health Ingredients Market Volume Share (%), by Product Type 2025 & 2033
- Figure 31: Asia Pacific Cognitive Health Ingredients Market Revenue (Million), by Application 2025 & 2033
- Figure 32: Asia Pacific Cognitive Health Ingredients Market Volume (K Tons), by Application 2025 & 2033
- Figure 33: Asia Pacific Cognitive Health Ingredients Market Revenue Share (%), by Application 2025 & 2033
- Figure 34: Asia Pacific Cognitive Health Ingredients Market Volume Share (%), by Application 2025 & 2033
- Figure 35: Asia Pacific Cognitive Health Ingredients Market Revenue (Million), by Country 2025 & 2033
- Figure 36: Asia Pacific Cognitive Health Ingredients Market Volume (K Tons), by Country 2025 & 2033
- Figure 37: Asia Pacific Cognitive Health Ingredients Market Revenue Share (%), by Country 2025 & 2033
- Figure 38: Asia Pacific Cognitive Health Ingredients Market Volume Share (%), by Country 2025 & 2033
- Figure 39: South America Cognitive Health Ingredients Market Revenue (Million), by Product Type 2025 & 2033
- Figure 40: South America Cognitive Health Ingredients Market Volume (K Tons), by Product Type 2025 & 2033
- Figure 41: South America Cognitive Health Ingredients Market Revenue Share (%), by Product Type 2025 & 2033
- Figure 42: South America Cognitive Health Ingredients Market Volume Share (%), by Product Type 2025 & 2033
- Figure 43: South America Cognitive Health Ingredients Market Revenue (Million), by Application 2025 & 2033
- Figure 44: South America Cognitive Health Ingredients Market Volume (K Tons), by Application 2025 & 2033
- Figure 45: South America Cognitive Health Ingredients Market Revenue Share (%), by Application 2025 & 2033
- Figure 46: South America Cognitive Health Ingredients Market Volume Share (%), by Application 2025 & 2033
- Figure 47: South America Cognitive Health Ingredients Market Revenue (Million), by Country 2025 & 2033
- Figure 48: South America Cognitive Health Ingredients Market Volume (K Tons), by Country 2025 & 2033
- Figure 49: South America Cognitive Health Ingredients Market Revenue Share (%), by Country 2025 & 2033
- Figure 50: South America Cognitive Health Ingredients Market Volume Share (%), by Country 2025 & 2033
- Figure 51: Middle East and Africa Cognitive Health Ingredients Market Revenue (Million), by Product Type 2025 & 2033
- Figure 52: Middle East and Africa Cognitive Health Ingredients Market Volume (K Tons), by Product Type 2025 & 2033
- Figure 53: Middle East and Africa Cognitive Health Ingredients Market Revenue Share (%), by Product Type 2025 & 2033
- Figure 54: Middle East and Africa Cognitive Health Ingredients Market Volume Share (%), by Product Type 2025 & 2033
- Figure 55: Middle East and Africa Cognitive Health Ingredients Market Revenue (Million), by Application 2025 & 2033
- Figure 56: Middle East and Africa Cognitive Health Ingredients Market Volume (K Tons), by Application 2025 & 2033
- Figure 57: Middle East and Africa Cognitive Health Ingredients Market Revenue Share (%), by Application 2025 & 2033
- Figure 58: Middle East and Africa Cognitive Health Ingredients Market Volume Share (%), by Application 2025 & 2033
- Figure 59: Middle East and Africa Cognitive Health Ingredients Market Revenue (Million), by Country 2025 & 2033
- Figure 60: Middle East and Africa Cognitive Health Ingredients Market Volume (K Tons), by Country 2025 & 2033
- Figure 61: Middle East and Africa Cognitive Health Ingredients Market Revenue Share (%), by Country 2025 & 2033
- Figure 62: Middle East and Africa Cognitive Health Ingredients Market Volume Share (%), by Country 2025 & 2033
List of Tables
- Table 1: Global Cognitive Health Ingredients Market Revenue Million Forecast, by Product Type 2020 & 2033
- Table 2: Global Cognitive Health Ingredients Market Volume K Tons Forecast, by Product Type 2020 & 2033
- Table 3: Global Cognitive Health Ingredients Market Revenue Million Forecast, by Application 2020 & 2033
- Table 4: Global Cognitive Health Ingredients Market Volume K Tons Forecast, by Application 2020 & 2033
- Table 5: Global Cognitive Health Ingredients Market Revenue Million Forecast, by Region 2020 & 2033
- Table 6: Global Cognitive Health Ingredients Market Volume K Tons Forecast, by Region 2020 & 2033
- Table 7: Global Cognitive Health Ingredients Market Revenue Million Forecast, by Product Type 2020 & 2033
- Table 8: Global Cognitive Health Ingredients Market Volume K Tons Forecast, by Product Type 2020 & 2033
- Table 9: Global Cognitive Health Ingredients Market Revenue Million Forecast, by Application 2020 & 2033
- Table 10: Global Cognitive Health Ingredients Market Volume K Tons Forecast, by Application 2020 & 2033
- Table 11: Global Cognitive Health Ingredients Market Revenue Million Forecast, by Country 2020 & 2033
- Table 12: Global Cognitive Health Ingredients Market Volume K Tons Forecast, by Country 2020 & 2033
- Table 13: United States Cognitive Health Ingredients Market Revenue (Million) Forecast, by Application 2020 & 2033
- Table 14: United States Cognitive Health Ingredients Market Volume (K Tons) Forecast, by Application 2020 & 2033
- Table 15: Canada Cognitive Health Ingredients Market Revenue (Million) Forecast, by Application 2020 & 2033
- Table 16: Canada Cognitive Health Ingredients Market Volume (K Tons) Forecast, by Application 2020 & 2033
- Table 17: Mexico Cognitive Health Ingredients Market Revenue (Million) Forecast, by Application 2020 & 2033
- Table 18: Mexico Cognitive Health Ingredients Market Volume (K Tons) Forecast, by Application 2020 & 2033
- Table 19: Rest of North America Cognitive Health Ingredients Market Revenue (Million) Forecast, by Application 2020 & 2033
- Table 20: Rest of North America Cognitive Health Ingredients Market Volume (K Tons) Forecast, by Application 2020 & 2033
- Table 21: Global Cognitive Health Ingredients Market Revenue Million Forecast, by Product Type 2020 & 2033
- Table 22: Global Cognitive Health Ingredients Market Volume K Tons Forecast, by Product Type 2020 & 2033
- Table 23: Global Cognitive Health Ingredients Market Revenue Million Forecast, by Application 2020 & 2033
- Table 24: Global Cognitive Health Ingredients Market Volume K Tons Forecast, by Application 2020 & 2033
- Table 25: Global Cognitive Health Ingredients Market Revenue Million Forecast, by Country 2020 & 2033
- Table 26: Global Cognitive Health Ingredients Market Volume K Tons Forecast, by Country 2020 & 2033
- Table 27: Germany Cognitive Health Ingredients Market Revenue (Million) Forecast, by Application 2020 & 2033
- Table 28: Germany Cognitive Health Ingredients Market Volume (K Tons) Forecast, by Application 2020 & 2033
- Table 29: United Kingdom Cognitive Health Ingredients Market Revenue (Million) Forecast, by Application 2020 & 2033
- Table 30: United Kingdom Cognitive Health Ingredients Market Volume (K Tons) Forecast, by Application 2020 & 2033
- Table 31: France Cognitive Health Ingredients Market Revenue (Million) Forecast, by Application 2020 & 2033
- Table 32: France Cognitive Health Ingredients Market Volume (K Tons) Forecast, by Application 2020 & 2033
- Table 33: Russia Cognitive Health Ingredients Market Revenue (Million) Forecast, by Application 2020 & 2033
- Table 34: Russia Cognitive Health Ingredients Market Volume (K Tons) Forecast, by Application 2020 & 2033
- Table 35: Spain Cognitive Health Ingredients Market Revenue (Million) Forecast, by Application 2020 & 2033
- Table 36: Spain Cognitive Health Ingredients Market Volume (K Tons) Forecast, by Application 2020 & 2033
- Table 37: Italy Cognitive Health Ingredients Market Revenue (Million) Forecast, by Application 2020 & 2033
- Table 38: Italy Cognitive Health Ingredients Market Volume (K Tons) Forecast, by Application 2020 & 2033
- Table 39: Rest of Europe Cognitive Health Ingredients Market Revenue (Million) Forecast, by Application 2020 & 2033
- Table 40: Rest of Europe Cognitive Health Ingredients Market Volume (K Tons) Forecast, by Application 2020 & 2033
- Table 41: Global Cognitive Health Ingredients Market Revenue Million Forecast, by Product Type 2020 & 2033
- Table 42: Global Cognitive Health Ingredients Market Volume K Tons Forecast, by Product Type 2020 & 2033
- Table 43: Global Cognitive Health Ingredients Market Revenue Million Forecast, by Application 2020 & 2033
- Table 44: Global Cognitive Health Ingredients Market Volume K Tons Forecast, by Application 2020 & 2033
- Table 45: Global Cognitive Health Ingredients Market Revenue Million Forecast, by Country 2020 & 2033
- Table 46: Global Cognitive Health Ingredients Market Volume K Tons Forecast, by Country 2020 & 2033
- Table 47: India Cognitive Health Ingredients Market Revenue (Million) Forecast, by Application 2020 & 2033
- Table 48: India Cognitive Health Ingredients Market Volume (K Tons) Forecast, by Application 2020 & 2033
- Table 49: China Cognitive Health Ingredients Market Revenue (Million) Forecast, by Application 2020 & 2033
- Table 50: China Cognitive Health Ingredients Market Volume (K Tons) Forecast, by Application 2020 & 2033
- Table 51: Japan Cognitive Health Ingredients Market Revenue (Million) Forecast, by Application 2020 & 2033
- Table 52: Japan Cognitive Health Ingredients Market Volume (K Tons) Forecast, by Application 2020 & 2033
- Table 53: Australia Cognitive Health Ingredients Market Revenue (Million) Forecast, by Application 2020 & 2033
- Table 54: Australia Cognitive Health Ingredients Market Volume (K Tons) Forecast, by Application 2020 & 2033
- Table 55: Rest of Asia Pacific Cognitive Health Ingredients Market Revenue (Million) Forecast, by Application 2020 & 2033
- Table 56: Rest of Asia Pacific Cognitive Health Ingredients Market Volume (K Tons) Forecast, by Application 2020 & 2033
- Table 57: Global Cognitive Health Ingredients Market Revenue Million Forecast, by Product Type 2020 & 2033
- Table 58: Global Cognitive Health Ingredients Market Volume K Tons Forecast, by Product Type 2020 & 2033
- Table 59: Global Cognitive Health Ingredients Market Revenue Million Forecast, by Application 2020 & 2033
- Table 60: Global Cognitive Health Ingredients Market Volume K Tons Forecast, by Application 2020 & 2033
- Table 61: Global Cognitive Health Ingredients Market Revenue Million Forecast, by Country 2020 & 2033
- Table 62: Global Cognitive Health Ingredients Market Volume K Tons Forecast, by Country 2020 & 2033
- Table 63: Brazil Cognitive Health Ingredients Market Revenue (Million) Forecast, by Application 2020 & 2033
- Table 64: Brazil Cognitive Health Ingredients Market Volume (K Tons) Forecast, by Application 2020 & 2033
- Table 65: Argentina Cognitive Health Ingredients Market Revenue (Million) Forecast, by Application 2020 & 2033
- Table 66: Argentina Cognitive Health Ingredients Market Volume (K Tons) Forecast, by Application 2020 & 2033
- Table 67: Rest of South America Cognitive Health Ingredients Market Revenue (Million) Forecast, by Application 2020 & 2033
- Table 68: Rest of South America Cognitive Health Ingredients Market Volume (K Tons) Forecast, by Application 2020 & 2033
- Table 69: Global Cognitive Health Ingredients Market Revenue Million Forecast, by Product Type 2020 & 2033
- Table 70: Global Cognitive Health Ingredients Market Volume K Tons Forecast, by Product Type 2020 & 2033
- Table 71: Global Cognitive Health Ingredients Market Revenue Million Forecast, by Application 2020 & 2033
- Table 72: Global Cognitive Health Ingredients Market Volume K Tons Forecast, by Application 2020 & 2033
- Table 73: Global Cognitive Health Ingredients Market Revenue Million Forecast, by Country 2020 & 2033
- Table 74: Global Cognitive Health Ingredients Market Volume K Tons Forecast, by Country 2020 & 2033
- Table 75: South Africa Cognitive Health Ingredients Market Revenue (Million) Forecast, by Application 2020 & 2033
- Table 76: South Africa Cognitive Health Ingredients Market Volume (K Tons) Forecast, by Application 2020 & 2033
- Table 77: Saudi Arabia Cognitive Health Ingredients Market Revenue (Million) Forecast, by Application 2020 & 2033
- Table 78: Saudi Arabia Cognitive Health Ingredients Market Volume (K Tons) Forecast, by Application 2020 & 2033
- Table 79: Rest of Middle East and Africa Cognitive Health Ingredients Market Revenue (Million) Forecast, by Application 2020 & 2033
- Table 80: Rest of Middle East and Africa Cognitive Health Ingredients Market Volume (K Tons) Forecast, by Application 2020 & 2033
Frequently Asked Questions
1. What is the projected Compound Annual Growth Rate (CAGR) of the Cognitive Health Ingredients Market?
The projected CAGR is approximately 5.87%.
2. Which companies are prominent players in the Cognitive Health Ingredients Market?
Key companies in the market include Koninklijke DSM, Food Chem Internationa, Kerry Inc, DuPont de Nemours Inc, Archer Daniels Midland Company, BASF SE, Corbion N V, Cargill Inc, Ingredion Incorporated, Rousselot BV.
3. What are the main segments of the Cognitive Health Ingredients Market?
The market segments include Product Type, Application.
4. Can you provide details about the market size?
The market size is estimated to be USD 9000 Million as of 2022.
5. What are some drivers contributing to market growth?
Increasing Demand For Convenience & Processed Food.
6. What are the notable trends driving market growth?
Natural Health Ingredients Perceived to Be Highly Effective among Arthritis Patients.
7. Are there any restraints impacting market growth?
Increased Consumer Awareness On Side-Effects Of Chemical Additives.
8. Can you provide examples of recent developments in the market?
The launch of new products by major players
9. What pricing options are available for accessing the report?
Pricing options include single-user, multi-user, and enterprise licenses priced at USD 4750, USD 5250, and USD 8750 respectively.
10. Is the market size provided in terms of value or volume?
The market size is provided in terms of value, measured in Million and volume, measured in K Tons.
11. Are there any specific market keywords associated with the report?
Yes, the market keyword associated with the report is "Cognitive Health Ingredients Market," which aids in identifying and referencing the specific market segment covered.
12. How do I determine which pricing option suits my needs best?
The pricing options vary based on user requirements and access needs. Individual users may opt for single-user licenses, while businesses requiring broader access may choose multi-user or enterprise licenses for cost-effective access to the report.
13. Are there any additional resources or data provided in the Cognitive Health Ingredients Market report?
While the report offers comprehensive insights, it's advisable to review the specific contents or supplementary materials provided to ascertain if additional resources or data are available.
14. How can I stay updated on further developments or reports in the Cognitive Health Ingredients Market?
To stay informed about further developments, trends, and reports in the Cognitive Health Ingredients Market, consider subscribing to industry newsletters, following relevant companies and organizations, or regularly checking reputable industry news sources and publications.
Methodology
Step 1 - Identification of Relevant Samples Size from Population Database


Step 2 - Approaches for Defining Global Market Size (Value, Volume* & Price*)

Note*: In applicable scenarios
Step 3 - Data Sources
Primary Research
- Web Analytics
- Survey Reports
- Research Institute
- Latest Research Reports
- Opinion Leaders
Secondary Research
- Annual Reports
- White Paper
- Latest Press Release
- Industry Association
- Paid Database
- Investor Presentations

Step 4 - Data Triangulation
Involves using different sources of information in order to increase the validity of a study
These sources are likely to be stakeholders in a program - participants, other researchers, program staff, other community members, and so on.
Then we put all data in single framework & apply various statistical tools to find out the dynamic on the market.
During the analysis stage, feedback from the stakeholder groups would be compared to determine areas of agreement as well as areas of divergence

