Key Insights
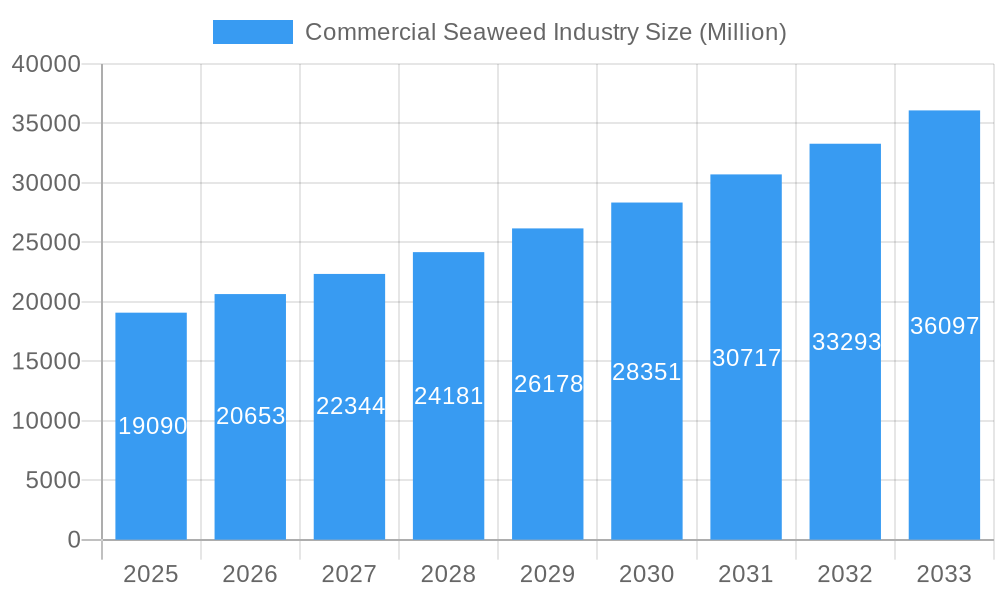
The commercial seaweed industry, valued at $19.09 billion in 2025, is experiencing robust growth, projected to expand at a compound annual growth rate (CAGR) of 8.18% from 2025 to 2033. This expansion is driven by several key factors. Increasing consumer awareness of seaweed's nutritional benefits and its versatility as a sustainable ingredient in food and beverages are fueling demand. The burgeoning dietary supplement market, leveraging seaweed's rich micronutrient profile, further contributes to market growth. Furthermore, the pharmaceutical industry's exploration of seaweed's bioactive compounds for drug development presents significant opportunities. The growing demand for sustainable and ethically sourced ingredients across various sectors also boosts the industry's appeal. Segment-wise, brown seaweed currently dominates the product type segment due to its wide applications, followed by red and green seaweed. The food and beverage sector is the largest application segment, followed by dietary supplements and pharmaceuticals. Geographically, North America and Asia Pacific are currently the leading markets, driven by high consumer demand and established industry infrastructure. However, emerging markets in other regions are anticipated to show significant growth in the coming years as awareness of seaweed's benefits increases.
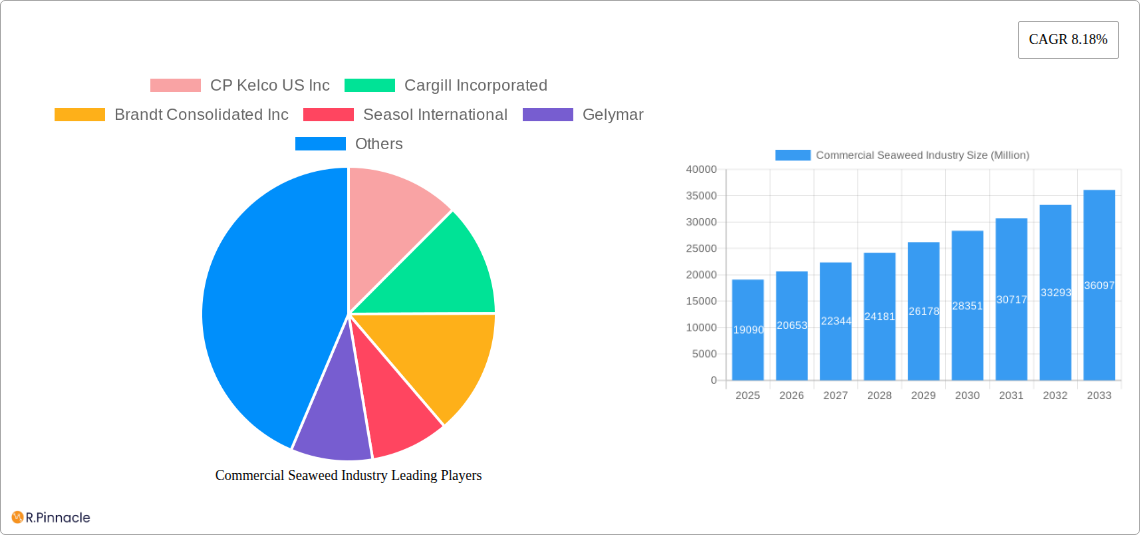
Commercial Seaweed Industry Market Size (In Billion)
The industry faces certain challenges, including fluctuating seaweed harvests due to environmental factors and the need for consistent quality control to meet industry standards. To overcome these, increased investment in sustainable seaweed farming practices, advanced processing techniques, and robust quality assurance measures are crucial. Moreover, further research and development are needed to fully explore the potential of seaweed in various applications and to address any concerns regarding consumer perception and product safety. Despite these challenges, the positive outlook for sustainable and healthy ingredients positions the commercial seaweed industry for continued strong growth over the forecast period, with significant potential for expansion in both established and emerging markets globally. Major players like CP Kelco, Cargill, and Acadian Seaplants are strategically positioning themselves to benefit from this expansion through investments in research, sustainable sourcing, and global distribution networks.
Commercial Seaweed Industry Company Market Share
Commercial Seaweed Industry: Market Analysis & Forecast (2019-2033)
This comprehensive report provides a detailed analysis of the global commercial seaweed industry, offering invaluable insights for industry professionals, investors, and researchers. With a focus on market trends, innovation, and key players, this report covers the period from 2019 to 2033, projecting significant growth opportunities. The study period spans 2019-2024 (Historical Period), with the base year as 2025 and the forecast period extending from 2025-2033 (Forecast Period). The Estimated Year is 2025. The report projects a market value exceeding xx Million by 2033.
Commercial Seaweed Industry Market Structure & Innovation Trends
This section analyzes the competitive landscape, innovation drivers, and regulatory aspects of the commercial seaweed industry. The market is moderately concentrated, with several key players holding significant market share. However, a growing number of startups are entering the market, particularly in regions like Australia, indicating a dynamic and competitive environment.
Market Concentration: The market share distribution among the top 5 players is estimated at approximately 60% in 2025. The remaining market share is distributed across numerous smaller players and emerging startups. Mergers and acquisitions (M&A) activity has been moderate, with deal values ranging from xx Million to xx Million in recent years.
Innovation Drivers: Key drivers include advancements in seaweed cultivation techniques, the development of novel seaweed-derived products (e.g., nutraceuticals, bioplastics), and increasing demand for sustainable and natural ingredients across diverse industries.
Regulatory Frameworks: Regulatory frameworks vary across different regions, influencing seaweed harvesting practices and product approvals. Streamlining regulations and establishing clear industry standards can further accelerate market growth.
Product Substitutes: While certain seaweed applications have direct substitutes (e.g., carrageenan alternatives in food processing), seaweed's unique properties and sustainability benefits position it as a preferred choice in many applications.
End-User Demographics: The demand for seaweed products spans various demographics, including health-conscious consumers, food and beverage manufacturers, pharmaceutical companies, and cosmetics producers.
M&A Activities: Recent M&A activities have primarily focused on consolidating production capacity and expanding market reach for major players. Further consolidation is expected in the coming years.
Commercial Seaweed Industry Market Dynamics & Trends
The commercial seaweed industry is experiencing robust growth, driven by factors such as increasing consumer awareness of health benefits, rising demand for sustainable ingredients, and technological advancements in seaweed cultivation and processing. The Compound Annual Growth Rate (CAGR) is projected to be xx% during the forecast period. Market penetration in key applications, such as food and beverages, is steadily increasing, reaching xx% in 2025 and projected to rise further.
Technological advancements are significantly impacting the industry, enhancing productivity and product diversification. Consumer preferences are shifting towards natural and sustainable alternatives, fueling demand for seaweed-based products. Competition is increasing, with both established players and new entrants vying for market share.
Dominant Regions & Segments in Commercial Seaweed Industry
The Asia-Pacific region currently dominates the global commercial seaweed industry, with significant production and consumption in countries like China, Japan, and South Korea. Europe and North America are also substantial markets, showing steady growth.
Key Drivers by Region:
- Asia-Pacific: Strong traditional consumption, established infrastructure, government support for seaweed farming, and abundant coastal resources.
- Europe: Growing demand for health foods, focus on sustainability, and supportive policies promoting seaweed cultivation.
- North America: Increasing awareness of seaweed's health benefits, high disposable incomes, and emerging market for seaweed-based products.
Dominant Segments:
- Product Type: Brown seaweed holds the largest market share due to its widespread use in food and industrial applications.
- Application: The food and beverage segment is the largest, followed by dietary supplements and pharmaceuticals.
Commercial Seaweed Industry Product Innovations
The commercial seaweed industry is a hotbed of innovation, with recent product developments underscoring its dynamism and forward-thinking nature. A prime example is Cargill's WavePure® ADG seaweed powder, a versatile ingredient now recognized as a traditional food ingredient in the EU. This innovation highlights advancements in creating functional ingredients that offer superior texture and enhanced stability for a wide range of food applications, catering to evolving consumer preferences for natural and functional food components. Furthermore, the development of Cadalmin™ LivCure extract by CMFRI exemplifies the burgeoning potential of seaweed-derived nutraceuticals. This extract is specifically designed to target and support liver health, showcasing the industry's increasing focus on producing high-value, specialized ingredients with demonstrable health benefits. These cutting-edge innovations collectively point towards a clear industry trend: the production of sophisticated, functional ingredients tailored for specific applications and designed to meet precise consumer needs and wellness aspirations.
Report Scope & Segmentation Analysis
This report segments the commercial seaweed market by product type (Brown, Green, Red seaweed) and application (Food & Beverages, Dietary Supplements, Pharmaceuticals, Other Applications). Each segment's growth projections, market size estimates, and competitive dynamics are analyzed. The Brown seaweed segment leads in market share. Within applications, the food and beverage industry holds the largest share, with steady growth projected for dietary supplements and pharmaceuticals. Competitive analysis assesses the market share, strategic positioning, and future growth prospects of key players in each segment.
Key Drivers of Commercial Seaweed Industry Growth
The commercial seaweed industry is experiencing robust growth, propelled by a confluence of powerful market forces. At the forefront is the escalating consumer demand for health-conscious, natural, and sustainably produced food products. This trend directly fuels the expansion of seaweed's applications within the food sector and the rapidly growing dietary supplement market. Simultaneously, the continuous scientific discovery of novel bioactive compounds present in seaweed, possessing a diverse array of beneficial health properties, is a significant catalyst for market growth, particularly within the pharmaceutical and nutraceutical segments. Adding to this momentum, supportive governmental policies that champion sustainable aquaculture practices and encourage substantial investment in research and development (R&D) are critically important for fostering continued expansion and innovation within the industry.
Challenges in the Commercial Seaweed Industry Sector
The industry faces challenges, including inconsistent seaweed quality, seasonality of harvests, and the high costs associated with sustainable cultivation. Supply chain complexities and the need for efficient processing techniques also pose significant hurdles. Moreover, stringent regulatory approvals for new products in certain markets can slow down innovation and market entry. These challenges, if not effectively addressed, may impact overall market growth.
Emerging Opportunities in Commercial Seaweed Industry
The commercial seaweed industry is poised for significant expansion, driven by a spectrum of exciting emerging opportunities. The global imperative for sustainable packaging materials is directly translating into a surge of interest and investment in seaweed-based bioplastics, offering an eco-friendly alternative to conventional plastics. Beyond packaging, the industry is actively exploring seaweed's immense potential in a variety of other industrial applications, including its use in the production of biofuels and its incorporation into cosmetic formulations, both of which represent substantial growth avenues. Moreover, ongoing and intensified research into seaweed's rich array of bioactive compounds promises to unlock new frontiers, paving the way for the development of groundbreaking novel pharmaceuticals and advanced nutraceuticals that address unmet health needs.
Leading Players in the Commercial Seaweed Industry Market
- CP Kelco US Inc
- Cargill Incorporated
- Brandt Consolidated Inc
- Seasol International
- Gelymar
- E I du Pont de Nemours & Company
- Rhodomaxx
- Algaia SA
- Dycolor Seaweed Industries
- Acadian Seaplants
Key Developments in Commercial Seaweed Industry Industry
- September 2022: The launch of Cadalmin™ LivCure extract by CMFRI, a pioneering seaweed-based nutraceutical specifically formulated for liver health. This development underscores the significant and growing potential of seaweed in the specialized nutraceutical market, highlighting its therapeutic applications.
- March 2021: A notable surge in the establishment of Australian seaweed farming startups. This trend signifies a substantial increase in investment and entrepreneurial activity within the sector, reflecting a growing market opportunity and positive governmental support for marine-based agriculture.
- February 2021: Cargill's introduction of WavePure® ADG, a novel seaweed-based food ingredient. This launch signals a significant advancement in the provision of functional food ingredients, offering enhanced texture and superior stability for food manufacturers seeking innovative and natural solutions.
Future Outlook for Commercial Seaweed Industry Market
The commercial seaweed industry is charting a course towards a highly promising future, characterized by substantial growth potential. This optimistic outlook is underpinned by a dynamic interplay of factors: a burgeoning consumer demand for natural and sustainable products, continuous advancements in technological innovation across cultivation and processing, and robust governmental support for the sector. The strategic expansion into diverse new applications, coupled with an unwavering commitment to sustainable cultivation practices, will be paramount in fully realizing the industry's vast potential. Experts predict that these concerted efforts will enable the commercial seaweed market to achieve significant global market value by 2033 and continue its upward trajectory well into the future.
Commercial Seaweed Industry Segmentation
-
1. Product Type
- 1.1. Brown Seaweed
- 1.2. Green Seaweed
- 1.3. Red Seaweed
-
2. Application
- 2.1. Food and Beverages
- 2.2. Dietary Supplements
- 2.3. Pharmaceuticals
- 2.4. Other Applications
Commercial Seaweed Industry Segmentation By Geography
-
1. North America
- 1.1. United States
- 1.2. Canada
- 1.3. Mexico
- 1.4. Rest of North America
-
2. Europe
- 2.1. Germany
- 2.2. United Kingdom
- 2.3. France
- 2.4. Spain
- 2.5. Russia
- 2.6. Italy
- 2.7. Rest of Europe
-
3. Asia Pacific
- 3.1. China
- 3.2. India
- 3.3. Japan
- 3.4. Australia
- 3.5. Rest of Asia Pacific
-
4. South America
- 4.1. Brazil
- 4.2. Argentina
- 4.3. Rest of South America
-
5. Middle East and Africa
- 5.1. United Arab Emirates
- 5.2. South Africa
- 5.3. Rest Middle East and Africa
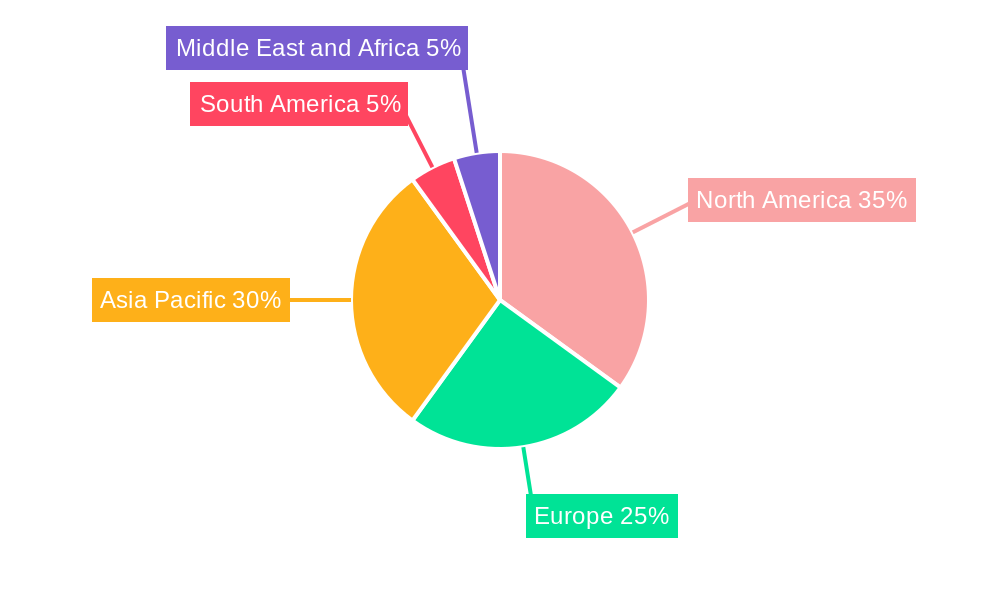
Commercial Seaweed Industry Regional Market Share
Geographic Coverage of Commercial Seaweed Industry
Commercial Seaweed Industry REPORT HIGHLIGHTS
| Aspects | Details |
|---|---|
| Study Period | 2020-2034 |
| Base Year | 2025 |
| Estimated Year | 2026 |
| Forecast Period | 2026-2034 |
| Historical Period | 2020-2025 |
| Growth Rate | CAGR of 8.18% from 2020-2034 |
| Segmentation |
|
Table of Contents
- 1. Introduction
- 1.1. Research Scope
- 1.2. Market Segmentation
- 1.3. Research Methodology
- 1.4. Definitions and Assumptions
- 2. Executive Summary
- 2.1. Introduction
- 3. Market Dynamics
- 3.1. Introduction
- 3.2. Market Drivers
- 3.2.1. Increasing Demand for Low-Fat and Low-Calorie Food; Increasing Product Innovation
- 3.3. Market Restrains
- 3.3.1. ; Threat of New Entrants; Bargaining Power of Buyers/Consumers; Bargaining Power of Suppliers; Threat of Substitute Products; Degree Of Competition
- 3.4. Market Trends
- 3.4.1. Increased Usage of Seaweed in Food Sector due to it Functional Properties and Nutritional Benefits
- 4. Market Factor Analysis
- 4.1. Porters Five Forces
- 4.2. Supply/Value Chain
- 4.3. PESTEL analysis
- 4.4. Market Entropy
- 4.5. Patent/Trademark Analysis
- 5. Global Commercial Seaweed Industry Analysis, Insights and Forecast, 2020-2032
- 5.1. Market Analysis, Insights and Forecast - by Product Type
- 5.1.1. Brown Seaweed
- 5.1.2. Green Seaweed
- 5.1.3. Red Seaweed
- 5.2. Market Analysis, Insights and Forecast - by Application
- 5.2.1. Food and Beverages
- 5.2.2. Dietary Supplements
- 5.2.3. Pharmaceuticals
- 5.2.4. Other Applications
- 5.3. Market Analysis, Insights and Forecast - by Region
- 5.3.1. North America
- 5.3.2. Europe
- 5.3.3. Asia Pacific
- 5.3.4. South America
- 5.3.5. Middle East and Africa
- 5.1. Market Analysis, Insights and Forecast - by Product Type
- 6. North America Commercial Seaweed Industry Analysis, Insights and Forecast, 2020-2032
- 6.1. Market Analysis, Insights and Forecast - by Product Type
- 6.1.1. Brown Seaweed
- 6.1.2. Green Seaweed
- 6.1.3. Red Seaweed
- 6.2. Market Analysis, Insights and Forecast - by Application
- 6.2.1. Food and Beverages
- 6.2.2. Dietary Supplements
- 6.2.3. Pharmaceuticals
- 6.2.4. Other Applications
- 6.1. Market Analysis, Insights and Forecast - by Product Type
- 7. Europe Commercial Seaweed Industry Analysis, Insights and Forecast, 2020-2032
- 7.1. Market Analysis, Insights and Forecast - by Product Type
- 7.1.1. Brown Seaweed
- 7.1.2. Green Seaweed
- 7.1.3. Red Seaweed
- 7.2. Market Analysis, Insights and Forecast - by Application
- 7.2.1. Food and Beverages
- 7.2.2. Dietary Supplements
- 7.2.3. Pharmaceuticals
- 7.2.4. Other Applications
- 7.1. Market Analysis, Insights and Forecast - by Product Type
- 8. Asia Pacific Commercial Seaweed Industry Analysis, Insights and Forecast, 2020-2032
- 8.1. Market Analysis, Insights and Forecast - by Product Type
- 8.1.1. Brown Seaweed
- 8.1.2. Green Seaweed
- 8.1.3. Red Seaweed
- 8.2. Market Analysis, Insights and Forecast - by Application
- 8.2.1. Food and Beverages
- 8.2.2. Dietary Supplements
- 8.2.3. Pharmaceuticals
- 8.2.4. Other Applications
- 8.1. Market Analysis, Insights and Forecast - by Product Type
- 9. South America Commercial Seaweed Industry Analysis, Insights and Forecast, 2020-2032
- 9.1. Market Analysis, Insights and Forecast - by Product Type
- 9.1.1. Brown Seaweed
- 9.1.2. Green Seaweed
- 9.1.3. Red Seaweed
- 9.2. Market Analysis, Insights and Forecast - by Application
- 9.2.1. Food and Beverages
- 9.2.2. Dietary Supplements
- 9.2.3. Pharmaceuticals
- 9.2.4. Other Applications
- 9.1. Market Analysis, Insights and Forecast - by Product Type
- 10. Middle East and Africa Commercial Seaweed Industry Analysis, Insights and Forecast, 2020-2032
- 10.1. Market Analysis, Insights and Forecast - by Product Type
- 10.1.1. Brown Seaweed
- 10.1.2. Green Seaweed
- 10.1.3. Red Seaweed
- 10.2. Market Analysis, Insights and Forecast - by Application
- 10.2.1. Food and Beverages
- 10.2.2. Dietary Supplements
- 10.2.3. Pharmaceuticals
- 10.2.4. Other Applications
- 10.1. Market Analysis, Insights and Forecast - by Product Type
- 11. Competitive Analysis
- 11.1. Global Market Share Analysis 2025
- 11.2. Company Profiles
- 11.2.1 CP Kelco US Inc
- 11.2.1.1. Overview
- 11.2.1.2. Products
- 11.2.1.3. SWOT Analysis
- 11.2.1.4. Recent Developments
- 11.2.1.5. Financials (Based on Availability)
- 11.2.2 Cargill Incorporated
- 11.2.2.1. Overview
- 11.2.2.2. Products
- 11.2.2.3. SWOT Analysis
- 11.2.2.4. Recent Developments
- 11.2.2.5. Financials (Based on Availability)
- 11.2.3 Brandt Consolidated Inc
- 11.2.3.1. Overview
- 11.2.3.2. Products
- 11.2.3.3. SWOT Analysis
- 11.2.3.4. Recent Developments
- 11.2.3.5. Financials (Based on Availability)
- 11.2.4 Seasol International
- 11.2.4.1. Overview
- 11.2.4.2. Products
- 11.2.4.3. SWOT Analysis
- 11.2.4.4. Recent Developments
- 11.2.4.5. Financials (Based on Availability)
- 11.2.5 Gelymar
- 11.2.5.1. Overview
- 11.2.5.2. Products
- 11.2.5.3. SWOT Analysis
- 11.2.5.4. Recent Developments
- 11.2.5.5. Financials (Based on Availability)
- 11.2.6 E I du Pont de Nemours & Company
- 11.2.6.1. Overview
- 11.2.6.2. Products
- 11.2.6.3. SWOT Analysis
- 11.2.6.4. Recent Developments
- 11.2.6.5. Financials (Based on Availability)
- 11.2.7 Rhodomaxx
- 11.2.7.1. Overview
- 11.2.7.2. Products
- 11.2.7.3. SWOT Analysis
- 11.2.7.4. Recent Developments
- 11.2.7.5. Financials (Based on Availability)
- 11.2.8 Algaia SA*List Not Exhaustive
- 11.2.8.1. Overview
- 11.2.8.2. Products
- 11.2.8.3. SWOT Analysis
- 11.2.8.4. Recent Developments
- 11.2.8.5. Financials (Based on Availability)
- 11.2.9 Dycolor Seaweed Industries
- 11.2.9.1. Overview
- 11.2.9.2. Products
- 11.2.9.3. SWOT Analysis
- 11.2.9.4. Recent Developments
- 11.2.9.5. Financials (Based on Availability)
- 11.2.10 Acadian Seaplants
- 11.2.10.1. Overview
- 11.2.10.2. Products
- 11.2.10.3. SWOT Analysis
- 11.2.10.4. Recent Developments
- 11.2.10.5. Financials (Based on Availability)
- 11.2.1 CP Kelco US Inc
List of Figures
- Figure 1: Global Commercial Seaweed Industry Revenue Breakdown (Million, %) by Region 2025 & 2033
- Figure 2: North America Commercial Seaweed Industry Revenue (Million), by Product Type 2025 & 2033
- Figure 3: North America Commercial Seaweed Industry Revenue Share (%), by Product Type 2025 & 2033
- Figure 4: North America Commercial Seaweed Industry Revenue (Million), by Application 2025 & 2033
- Figure 5: North America Commercial Seaweed Industry Revenue Share (%), by Application 2025 & 2033
- Figure 6: North America Commercial Seaweed Industry Revenue (Million), by Country 2025 & 2033
- Figure 7: North America Commercial Seaweed Industry Revenue Share (%), by Country 2025 & 2033
- Figure 8: Europe Commercial Seaweed Industry Revenue (Million), by Product Type 2025 & 2033
- Figure 9: Europe Commercial Seaweed Industry Revenue Share (%), by Product Type 2025 & 2033
- Figure 10: Europe Commercial Seaweed Industry Revenue (Million), by Application 2025 & 2033
- Figure 11: Europe Commercial Seaweed Industry Revenue Share (%), by Application 2025 & 2033
- Figure 12: Europe Commercial Seaweed Industry Revenue (Million), by Country 2025 & 2033
- Figure 13: Europe Commercial Seaweed Industry Revenue Share (%), by Country 2025 & 2033
- Figure 14: Asia Pacific Commercial Seaweed Industry Revenue (Million), by Product Type 2025 & 2033
- Figure 15: Asia Pacific Commercial Seaweed Industry Revenue Share (%), by Product Type 2025 & 2033
- Figure 16: Asia Pacific Commercial Seaweed Industry Revenue (Million), by Application 2025 & 2033
- Figure 17: Asia Pacific Commercial Seaweed Industry Revenue Share (%), by Application 2025 & 2033
- Figure 18: Asia Pacific Commercial Seaweed Industry Revenue (Million), by Country 2025 & 2033
- Figure 19: Asia Pacific Commercial Seaweed Industry Revenue Share (%), by Country 2025 & 2033
- Figure 20: South America Commercial Seaweed Industry Revenue (Million), by Product Type 2025 & 2033
- Figure 21: South America Commercial Seaweed Industry Revenue Share (%), by Product Type 2025 & 2033
- Figure 22: South America Commercial Seaweed Industry Revenue (Million), by Application 2025 & 2033
- Figure 23: South America Commercial Seaweed Industry Revenue Share (%), by Application 2025 & 2033
- Figure 24: South America Commercial Seaweed Industry Revenue (Million), by Country 2025 & 2033
- Figure 25: South America Commercial Seaweed Industry Revenue Share (%), by Country 2025 & 2033
- Figure 26: Middle East and Africa Commercial Seaweed Industry Revenue (Million), by Product Type 2025 & 2033
- Figure 27: Middle East and Africa Commercial Seaweed Industry Revenue Share (%), by Product Type 2025 & 2033
- Figure 28: Middle East and Africa Commercial Seaweed Industry Revenue (Million), by Application 2025 & 2033
- Figure 29: Middle East and Africa Commercial Seaweed Industry Revenue Share (%), by Application 2025 & 2033
- Figure 30: Middle East and Africa Commercial Seaweed Industry Revenue (Million), by Country 2025 & 2033
- Figure 31: Middle East and Africa Commercial Seaweed Industry Revenue Share (%), by Country 2025 & 2033
List of Tables
- Table 1: Global Commercial Seaweed Industry Revenue Million Forecast, by Product Type 2020 & 2033
- Table 2: Global Commercial Seaweed Industry Revenue Million Forecast, by Application 2020 & 2033
- Table 3: Global Commercial Seaweed Industry Revenue Million Forecast, by Region 2020 & 2033
- Table 4: Global Commercial Seaweed Industry Revenue Million Forecast, by Product Type 2020 & 2033
- Table 5: Global Commercial Seaweed Industry Revenue Million Forecast, by Application 2020 & 2033
- Table 6: Global Commercial Seaweed Industry Revenue Million Forecast, by Country 2020 & 2033
- Table 7: United States Commercial Seaweed Industry Revenue (Million) Forecast, by Application 2020 & 2033
- Table 8: Canada Commercial Seaweed Industry Revenue (Million) Forecast, by Application 2020 & 2033
- Table 9: Mexico Commercial Seaweed Industry Revenue (Million) Forecast, by Application 2020 & 2033
- Table 10: Rest of North America Commercial Seaweed Industry Revenue (Million) Forecast, by Application 2020 & 2033
- Table 11: Global Commercial Seaweed Industry Revenue Million Forecast, by Product Type 2020 & 2033
- Table 12: Global Commercial Seaweed Industry Revenue Million Forecast, by Application 2020 & 2033
- Table 13: Global Commercial Seaweed Industry Revenue Million Forecast, by Country 2020 & 2033
- Table 14: Germany Commercial Seaweed Industry Revenue (Million) Forecast, by Application 2020 & 2033
- Table 15: United Kingdom Commercial Seaweed Industry Revenue (Million) Forecast, by Application 2020 & 2033
- Table 16: France Commercial Seaweed Industry Revenue (Million) Forecast, by Application 2020 & 2033
- Table 17: Spain Commercial Seaweed Industry Revenue (Million) Forecast, by Application 2020 & 2033
- Table 18: Russia Commercial Seaweed Industry Revenue (Million) Forecast, by Application 2020 & 2033
- Table 19: Italy Commercial Seaweed Industry Revenue (Million) Forecast, by Application 2020 & 2033
- Table 20: Rest of Europe Commercial Seaweed Industry Revenue (Million) Forecast, by Application 2020 & 2033
- Table 21: Global Commercial Seaweed Industry Revenue Million Forecast, by Product Type 2020 & 2033
- Table 22: Global Commercial Seaweed Industry Revenue Million Forecast, by Application 2020 & 2033
- Table 23: Global Commercial Seaweed Industry Revenue Million Forecast, by Country 2020 & 2033
- Table 24: China Commercial Seaweed Industry Revenue (Million) Forecast, by Application 2020 & 2033
- Table 25: India Commercial Seaweed Industry Revenue (Million) Forecast, by Application 2020 & 2033
- Table 26: Japan Commercial Seaweed Industry Revenue (Million) Forecast, by Application 2020 & 2033
- Table 27: Australia Commercial Seaweed Industry Revenue (Million) Forecast, by Application 2020 & 2033
- Table 28: Rest of Asia Pacific Commercial Seaweed Industry Revenue (Million) Forecast, by Application 2020 & 2033
- Table 29: Global Commercial Seaweed Industry Revenue Million Forecast, by Product Type 2020 & 2033
- Table 30: Global Commercial Seaweed Industry Revenue Million Forecast, by Application 2020 & 2033
- Table 31: Global Commercial Seaweed Industry Revenue Million Forecast, by Country 2020 & 2033
- Table 32: Brazil Commercial Seaweed Industry Revenue (Million) Forecast, by Application 2020 & 2033
- Table 33: Argentina Commercial Seaweed Industry Revenue (Million) Forecast, by Application 2020 & 2033
- Table 34: Rest of South America Commercial Seaweed Industry Revenue (Million) Forecast, by Application 2020 & 2033
- Table 35: Global Commercial Seaweed Industry Revenue Million Forecast, by Product Type 2020 & 2033
- Table 36: Global Commercial Seaweed Industry Revenue Million Forecast, by Application 2020 & 2033
- Table 37: Global Commercial Seaweed Industry Revenue Million Forecast, by Country 2020 & 2033
- Table 38: United Arab Emirates Commercial Seaweed Industry Revenue (Million) Forecast, by Application 2020 & 2033
- Table 39: South Africa Commercial Seaweed Industry Revenue (Million) Forecast, by Application 2020 & 2033
- Table 40: Rest Middle East and Africa Commercial Seaweed Industry Revenue (Million) Forecast, by Application 2020 & 2033
Frequently Asked Questions
1. What is the projected Compound Annual Growth Rate (CAGR) of the Commercial Seaweed Industry?
The projected CAGR is approximately 8.18%.
2. Which companies are prominent players in the Commercial Seaweed Industry?
Key companies in the market include CP Kelco US Inc, Cargill Incorporated, Brandt Consolidated Inc, Seasol International, Gelymar, E I du Pont de Nemours & Company, Rhodomaxx, Algaia SA*List Not Exhaustive, Dycolor Seaweed Industries, Acadian Seaplants.
3. What are the main segments of the Commercial Seaweed Industry?
The market segments include Product Type, Application.
4. Can you provide details about the market size?
The market size is estimated to be USD 19.09 Million as of 2022.
5. What are some drivers contributing to market growth?
Increasing Demand for Low-Fat and Low-Calorie Food; Increasing Product Innovation.
6. What are the notable trends driving market growth?
Increased Usage of Seaweed in Food Sector due to it Functional Properties and Nutritional Benefits.
7. Are there any restraints impacting market growth?
; Threat of New Entrants; Bargaining Power of Buyers/Consumers; Bargaining Power of Suppliers; Threat of Substitute Products; Degree Of Competition.
8. Can you provide examples of recent developments in the market?
September 2022: CadalminTM LivCure extract, a patent-protected nutraceutical product developed by the ICAR-Central Marine Fisheries Research Institute (CMFRI) from seaweeds to combat non-alcoholic fatty liver disease, will be available in the market soon. The product contains 100% natural bioactive ingredients extracted from select seaweeds. The product is made using eco-friendly green technology to improve liver health and is the 9th nutraceutical developed by CMFRI
9. What pricing options are available for accessing the report?
Pricing options include single-user, multi-user, and enterprise licenses priced at USD 4750, USD 5250, and USD 8750 respectively.
10. Is the market size provided in terms of value or volume?
The market size is provided in terms of value, measured in Million.
11. Are there any specific market keywords associated with the report?
Yes, the market keyword associated with the report is "Commercial Seaweed Industry," which aids in identifying and referencing the specific market segment covered.
12. How do I determine which pricing option suits my needs best?
The pricing options vary based on user requirements and access needs. Individual users may opt for single-user licenses, while businesses requiring broader access may choose multi-user or enterprise licenses for cost-effective access to the report.
13. Are there any additional resources or data provided in the Commercial Seaweed Industry report?
While the report offers comprehensive insights, it's advisable to review the specific contents or supplementary materials provided to ascertain if additional resources or data are available.
14. How can I stay updated on further developments or reports in the Commercial Seaweed Industry?
To stay informed about further developments, trends, and reports in the Commercial Seaweed Industry, consider subscribing to industry newsletters, following relevant companies and organizations, or regularly checking reputable industry news sources and publications.
Methodology
Step 1 - Identification of Relevant Samples Size from Population Database


Step 2 - Approaches for Defining Global Market Size (Value, Volume* & Price*)

Note*: In applicable scenarios
Step 3 - Data Sources
Primary Research
- Web Analytics
- Survey Reports
- Research Institute
- Latest Research Reports
- Opinion Leaders
Secondary Research
- Annual Reports
- White Paper
- Latest Press Release
- Industry Association
- Paid Database
- Investor Presentations

Step 4 - Data Triangulation
Involves using different sources of information in order to increase the validity of a study
These sources are likely to be stakeholders in a program - participants, other researchers, program staff, other community members, and so on.
Then we put all data in single framework & apply various statistical tools to find out the dynamic on the market.
During the analysis stage, feedback from the stakeholder groups would be compared to determine areas of agreement as well as areas of divergence

