

Key Insights
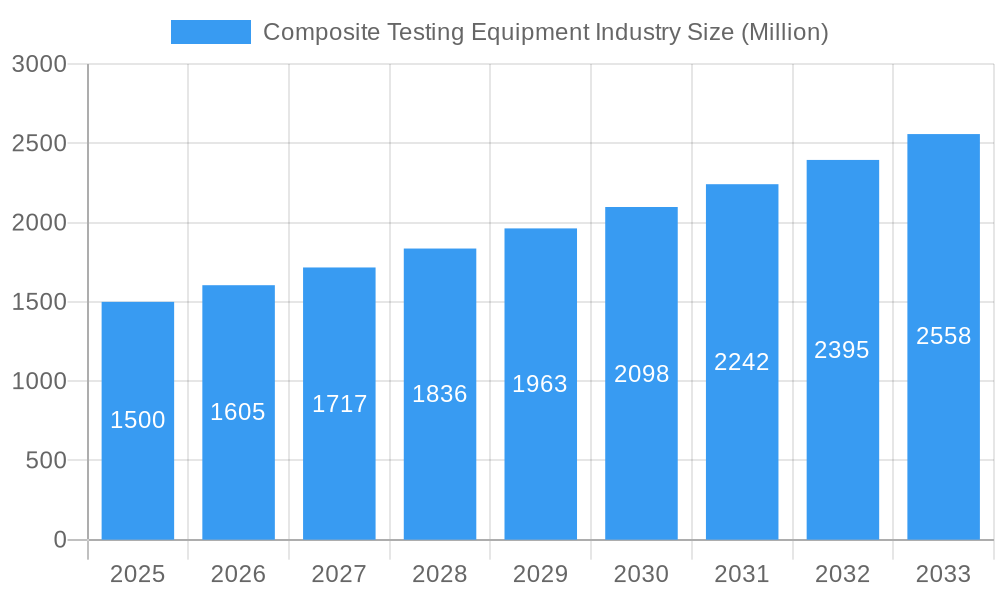
The global Composite Testing Equipment market is poised for significant expansion, driven by the escalating adoption of composite materials across a wide spectrum of industries. The market, estimated at $2.58 billion in 2025, is projected to grow at a Compound Annual Growth Rate (CAGR) of 7.16% from 2025 to 2033. Key growth drivers include the burgeoning demand for lightweight, high-strength materials in aerospace and automotive sectors, where stringent quality assurance mandates the use of advanced testing solutions. Furthermore, the expanding construction and renewable energy industries, particularly wind power, are increasingly integrating composite materials, contributing to market momentum. Innovations in testing methodologies, especially non-destructive testing (NDT), are enhancing efficiency and cost-effectiveness, further stimulating market development.
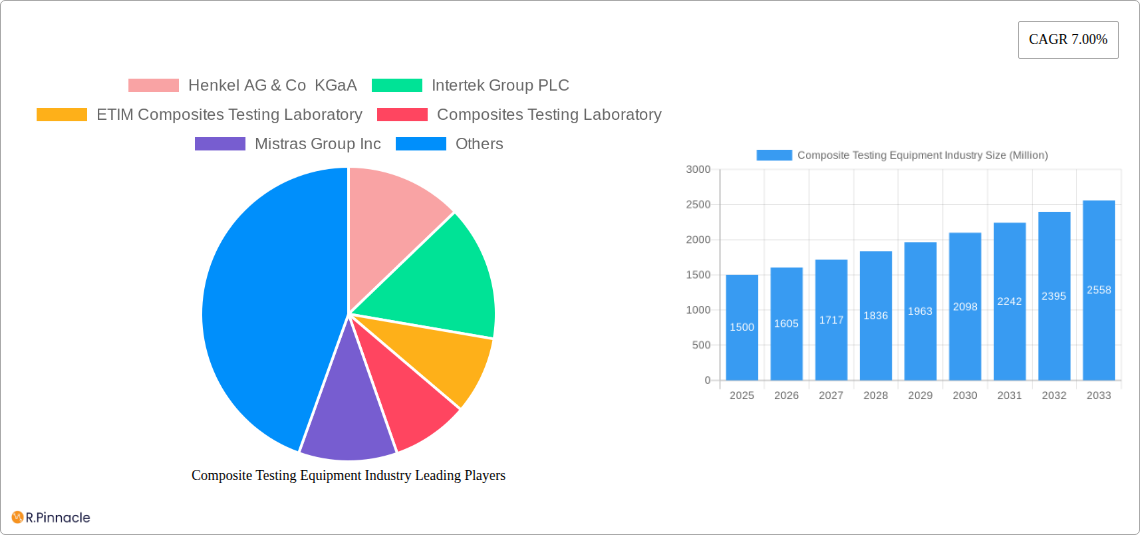
Composite Testing Equipment Industry Market Size (In Billion)
Market segmentation highlights the prominence of Ceramic Matrix Composites, Continuous Fiber Composites, and Polymer Matrix Composites as leading product types. Both destructive and non-destructive testing methods address diverse quality control requirements. Geographically, North America and Europe currently dominate market share, supported by mature industrial bases and robust regulatory landscapes. However, the Asia-Pacific region is anticipated to experience substantial growth, fueled by increasing manufacturing capabilities and infrastructure development. Leading market participants, such as Henkel AG & Co KGaA, Intertek Group PLC, and Element Materials Technology, are committed to continuous innovation to address evolving industry demands, fostering a competitive environment and driving technological progress. Despite challenges like substantial initial equipment investment and the requirement for skilled personnel, the Composite Testing Equipment market outlook remains highly optimistic, propelled by technological advancements and sustained demand from diverse end-use sectors.
Composite Testing Equipment Industry Company Market Share
Composite Testing Equipment Industry Market Report: 2019-2033
This comprehensive report provides an in-depth analysis of the global Composite Testing Equipment industry, offering invaluable insights for industry professionals, investors, and strategic decision-makers. The report covers the period from 2019 to 2033, with a focus on the forecast period of 2025-2033 and a base year of 2025. The market size is projected to reach xx Million by 2033, exhibiting a CAGR of xx% during the forecast period.
Composite Testing Equipment Industry Market Structure & Innovation Trends
This section analyzes the competitive landscape, innovation drivers, and regulatory influences shaping the Composite Testing Equipment market. The industry exhibits a moderately concentrated structure, with key players holding significant market share. For example, Henkel AG & Co KGaA, Intertek Group PLC, and Instron Corporation (Illinois Tool Works Inc) collectively account for an estimated xx% of the market share in 2025. Innovation is driven by the need for more accurate, efficient, and versatile testing solutions to meet the demands of increasingly sophisticated composite materials.
- Market Concentration: Moderately concentrated with top 5 players holding approximately xx% market share in 2025.
- Innovation Drivers: Advancements in sensor technology, automation, and data analytics.
- Regulatory Frameworks: Stringent safety and quality standards influence equipment design and testing protocols.
- Product Substitutes: Limited direct substitutes, but alternative testing methods exist, influencing market competition.
- M&A Activities: The industry has witnessed xx Million in M&A deals during the historical period (2019-2024), primarily focused on expanding capabilities and market reach. Further consolidation is anticipated during the forecast period.
- End-user Demographics: Primarily focused on Aerospace & Defense, Automotive, and Building & Construction sectors.
Composite Testing Equipment Industry Market Dynamics & Trends
The Composite Testing Equipment market is experiencing robust growth fueled by several key factors. The increasing demand for lightweight, high-strength composite materials across various industries, particularly aerospace and automotive, is a major driver. Technological advancements, such as the development of non-destructive testing techniques and automated systems, are further enhancing market expansion. Consumer preference for sustainable and high-performance products is also contributing to the market growth. However, the industry faces challenges from economic fluctuations and intense competition.
The market is projected to register a CAGR of xx% during 2025-2033, driven by increasing adoption of advanced composites in various applications and technological innovations in testing methodologies. Market penetration of automated testing systems is also expected to increase significantly during the forecast period.
Dominant Regions & Segments in Composite Testing Equipment Industry
North America currently dominates the Composite Testing Equipment market, driven by strong demand from the aerospace and defense sectors and a robust manufacturing base. However, Asia-Pacific is expected to exhibit the highest growth rate during the forecast period due to rapid industrialization and increasing investments in infrastructure development.
- By Product Type: Polymer Matrix Composites holds the largest market share, followed by Continuous Fiber Composites.
- By Testing Method: Destructive testing dominates the market due to its reliability in assessing material properties. However, non-destructive testing methods are experiencing significant growth due to their cost-effectiveness and ability to maintain the integrity of the tested material.
- By Application: The aerospace and defense sector is the leading application segment, driven by stringent quality control requirements and the need for reliable testing methods. The automotive sector is also a significant contributor.
Key Drivers:
- North America: Strong aerospace and defense sectors, advanced manufacturing capabilities.
- Asia-Pacific: Rapid industrialization, increasing infrastructure investments, rising disposable income.
- Europe: Stringent regulations, focus on sustainable manufacturing.
Composite Testing Equipment Industry Product Innovations
Recent innovations focus on improving the accuracy, speed, and automation of testing procedures. The development of portable and handheld testing equipment has broadened application possibilities. Integration of data analytics and AI-powered systems enhances data interpretation and predictive maintenance. These innovations are crucial for meeting the evolving needs of the composites industry and maintaining a competitive edge.
Report Scope & Segmentation Analysis
This report comprehensively segments the Composite Testing Equipment market by product type (Ceramic Matrix Composites, Continuous Fiber Composites, Discontinuous Fiber Composites, Polymer Matrix Composites, Other Composites), testing method (Destructive, Non-destructive), and application (Aerospace and Defense, Automotive, Building & Construction, Electricals & Electronics, Others). Each segment's growth projections, market sizes, and competitive dynamics are analyzed individually, providing a detailed understanding of the market structure.
Key Drivers of Composite Testing Equipment Industry Growth
The growth of the Composite Testing Equipment industry is fueled by several key factors: the increasing demand for lightweight and high-strength materials in various end-use sectors; advances in composite material technology demanding more sophisticated testing methods; and stringent quality and safety regulations driving the adoption of advanced testing equipment. Government initiatives promoting the use of composites in infrastructure and transportation are also contributing to market growth.
Challenges in the Composite Testing Equipment Industry Sector
The industry faces challenges such as high initial investment costs for advanced equipment, the need for skilled technicians to operate and maintain sophisticated testing systems, and the potential for obsolescence due to rapid technological advancements. Supply chain disruptions and intense competition from established players and new entrants also pose significant challenges.
Emerging Opportunities in Composite Testing Equipment Industry
The emergence of new composite materials, particularly bio-based composites, presents significant opportunities for the Composite Testing Equipment industry. The development of advanced testing techniques, such as micro-computed tomography (micro-CT) and digital image correlation (DIC), offers avenues for innovation. The expansion of the composite materials market in emerging economies presents considerable growth potential.
Leading Players in the Composite Testing Equipment Industry Market
- Henkel AG & Co KGaA
- Intertek Group PLC
- ETIM Composites Testing Laboratory
- Composites Testing Laboratory
- Mistras Group Inc
- Westmoreland Mechanical Testing & Research Inc
- Element Materials Technology
- Matrix Composites Inc (ITT Inc)
- Instron Corporation (Illinois Tool Works Inc)
Key Developments in Composite Testing Equipment Industry Industry
- 2022-Q4: Instron launched a new series of automated testing systems for advanced composite materials.
- 2023-Q1: Intertek acquired a specialized composites testing laboratory, expanding its service offerings.
- 2023-Q2: Henkel invested xx Million in R&D for advanced composite testing technologies. (Note: Specific values for investments might need further research)
Future Outlook for Composite Testing Equipment Industry Market
The Composite Testing Equipment market is poised for continued growth, driven by the expanding use of composite materials across diverse sectors and the ongoing development of innovative testing technologies. The increasing focus on sustainability and the rising demand for high-performance materials are likely to further accelerate market expansion. Strategic partnerships and collaborations are expected to play a crucial role in shaping the future of the industry.
Composite Testing Equipment Industry Segmentation
-
1. Product Type
- 1.1. Ceramic Matrix Composites
- 1.2. Continuous Fiber Composites
- 1.3. Discontinuous Fiber Composites
- 1.4. Polymer Matrix Composites
- 1.5. Other Composites
-
2. Testing Method
- 2.1. Destructive
- 2.2. Non-destructive
-
3. Application
- 3.1. Aerospace and Defense
- 3.2. Automotive
- 3.3. Building & Construction
- 3.4. Electricals & Electronics
- 3.5. Others (Sporting Goods, Wind Energy, etc. )
Composite Testing Equipment Industry Segmentation By Geography
- 1. North America
- 2. Europe
- 3. Asia Pacific
- 4. Latin America
- 5. Middle East
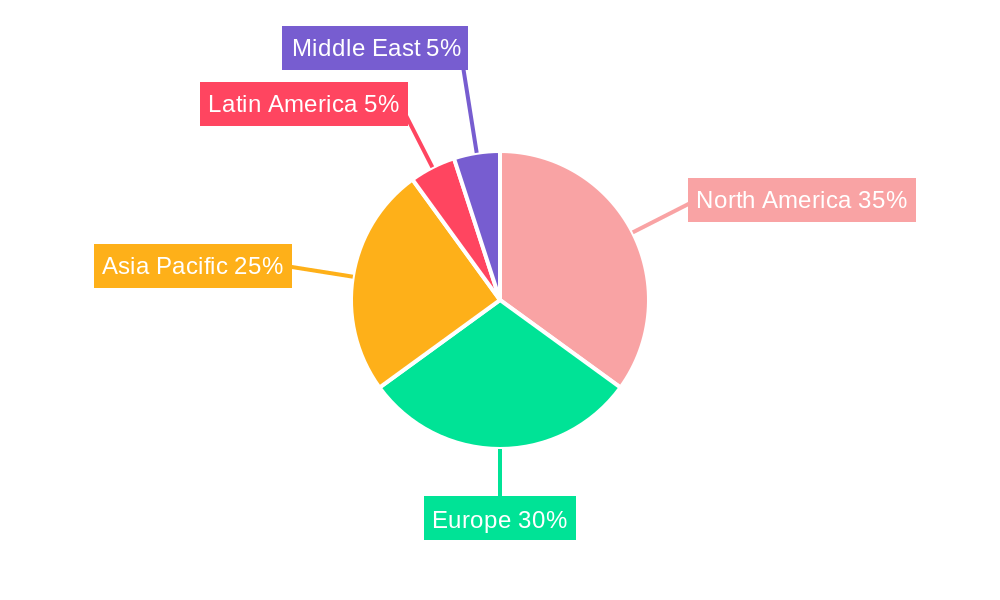
Composite Testing Equipment Industry Regional Market Share
Geographic Coverage of Composite Testing Equipment Industry
Composite Testing Equipment Industry REPORT HIGHLIGHTS
| Aspects | Details |
|---|---|
| Study Period | 2020-2034 |
| Base Year | 2025 |
| Estimated Year | 2026 |
| Forecast Period | 2026-2034 |
| Historical Period | 2020-2025 |
| Growth Rate | CAGR of 7.16% from 2020-2034 |
| Segmentation |
|
Table of Contents
- 1. Introduction
- 1.1. Research Scope
- 1.2. Market Segmentation
- 1.3. Research Objective
- 1.4. Definitions and Assumptions
- 2. Executive Summary
- 2.1. Market Snapshot
- 3. Market Dynamics
- 3.1. Market Drivers
- 3.2. Market Restrains
- 3.3. Market Trends
- 3.4. Market Opportunities
- 4. Market Factor Analysis
- 4.1. Porters Five Forces
- 4.1.1. Bargaining Power of Suppliers
- 4.1.2. Bargaining Power of Buyers
- 4.1.3. Threat of New Entrants
- 4.1.4. Threat of Substitutes
- 4.1.5. Competitive Rivalry
- 4.2. PESTEL analysis
- 4.3. BCG Analysis
- 4.3.1. Stars (High Growth, High Market Share)
- 4.3.2. Cash Cows (Low Growth, High Market Share)
- 4.3.3. Question Mark (High Growth, Low Market Share)
- 4.3.4. Dogs (Low Growth, Low Market Share)
- 4.4. Ansoff Matrix Analysis
- 4.5. Supply Chain Analysis
- 4.6. Regulatory Landscape
- 4.7. Current Market Potential and Opportunity Assessment (TAM–SAM–SOM Framework)
- 4.8. PRI Analyst Note
- 4.1. Porters Five Forces
- 5. Market Analysis, Insights and Forecast 2021-2033
- 5.1. Market Analysis, Insights and Forecast - by Product Type
- 5.1.1. Ceramic Matrix Composites
- 5.1.2. Continuous Fiber Composites
- 5.1.3. Discontinuous Fiber Composites
- 5.1.4. Polymer Matrix Composites
- 5.1.5. Other Composites
- 5.2. Market Analysis, Insights and Forecast - by Testing Method
- 5.2.1. Destructive
- 5.2.2. Non-destructive
- 5.3. Market Analysis, Insights and Forecast - by Application
- 5.3.1. Aerospace and Defense
- 5.3.2. Automotive
- 5.3.3. Building & Construction
- 5.3.4. Electricals & Electronics
- 5.3.5. Others (Sporting Goods, Wind Energy, etc. )
- 5.4. Market Analysis, Insights and Forecast - by Region
- 5.4.1. North America
- 5.4.2. Europe
- 5.4.3. Asia Pacific
- 5.4.4. Latin America
- 5.4.5. Middle East
- 5.1. Market Analysis, Insights and Forecast - by Product Type
- 6. Global Composite Testing Equipment Industry Analysis, Insights and Forecast, 2021-2033
- 6.1. Market Analysis, Insights and Forecast - by Product Type
- 6.1.1. Ceramic Matrix Composites
- 6.1.2. Continuous Fiber Composites
- 6.1.3. Discontinuous Fiber Composites
- 6.1.4. Polymer Matrix Composites
- 6.1.5. Other Composites
- 6.2. Market Analysis, Insights and Forecast - by Testing Method
- 6.2.1. Destructive
- 6.2.2. Non-destructive
- 6.3. Market Analysis, Insights and Forecast - by Application
- 6.3.1. Aerospace and Defense
- 6.3.2. Automotive
- 6.3.3. Building & Construction
- 6.3.4. Electricals & Electronics
- 6.3.5. Others (Sporting Goods, Wind Energy, etc. )
- 6.1. Market Analysis, Insights and Forecast - by Product Type
- 7. North America Composite Testing Equipment Industry Analysis, Insights and Forecast, 2020-2032
- 7.1. Market Analysis, Insights and Forecast - by Product Type
- 7.1.1. Ceramic Matrix Composites
- 7.1.2. Continuous Fiber Composites
- 7.1.3. Discontinuous Fiber Composites
- 7.1.4. Polymer Matrix Composites
- 7.1.5. Other Composites
- 7.2. Market Analysis, Insights and Forecast - by Testing Method
- 7.2.1. Destructive
- 7.2.2. Non-destructive
- 7.3. Market Analysis, Insights and Forecast - by Application
- 7.3.1. Aerospace and Defense
- 7.3.2. Automotive
- 7.3.3. Building & Construction
- 7.3.4. Electricals & Electronics
- 7.3.5. Others (Sporting Goods, Wind Energy, etc. )
- 7.1. Market Analysis, Insights and Forecast - by Product Type
- 8. Europe Composite Testing Equipment Industry Analysis, Insights and Forecast, 2020-2032
- 8.1. Market Analysis, Insights and Forecast - by Product Type
- 8.1.1. Ceramic Matrix Composites
- 8.1.2. Continuous Fiber Composites
- 8.1.3. Discontinuous Fiber Composites
- 8.1.4. Polymer Matrix Composites
- 8.1.5. Other Composites
- 8.2. Market Analysis, Insights and Forecast - by Testing Method
- 8.2.1. Destructive
- 8.2.2. Non-destructive
- 8.3. Market Analysis, Insights and Forecast - by Application
- 8.3.1. Aerospace and Defense
- 8.3.2. Automotive
- 8.3.3. Building & Construction
- 8.3.4. Electricals & Electronics
- 8.3.5. Others (Sporting Goods, Wind Energy, etc. )
- 8.1. Market Analysis, Insights and Forecast - by Product Type
- 9. Asia Pacific Composite Testing Equipment Industry Analysis, Insights and Forecast, 2020-2032
- 9.1. Market Analysis, Insights and Forecast - by Product Type
- 9.1.1. Ceramic Matrix Composites
- 9.1.2. Continuous Fiber Composites
- 9.1.3. Discontinuous Fiber Composites
- 9.1.4. Polymer Matrix Composites
- 9.1.5. Other Composites
- 9.2. Market Analysis, Insights and Forecast - by Testing Method
- 9.2.1. Destructive
- 9.2.2. Non-destructive
- 9.3. Market Analysis, Insights and Forecast - by Application
- 9.3.1. Aerospace and Defense
- 9.3.2. Automotive
- 9.3.3. Building & Construction
- 9.3.4. Electricals & Electronics
- 9.3.5. Others (Sporting Goods, Wind Energy, etc. )
- 9.1. Market Analysis, Insights and Forecast - by Product Type
- 10. Latin America Composite Testing Equipment Industry Analysis, Insights and Forecast, 2020-2032
- 10.1. Market Analysis, Insights and Forecast - by Product Type
- 10.1.1. Ceramic Matrix Composites
- 10.1.2. Continuous Fiber Composites
- 10.1.3. Discontinuous Fiber Composites
- 10.1.4. Polymer Matrix Composites
- 10.1.5. Other Composites
- 10.2. Market Analysis, Insights and Forecast - by Testing Method
- 10.2.1. Destructive
- 10.2.2. Non-destructive
- 10.3. Market Analysis, Insights and Forecast - by Application
- 10.3.1. Aerospace and Defense
- 10.3.2. Automotive
- 10.3.3. Building & Construction
- 10.3.4. Electricals & Electronics
- 10.3.5. Others (Sporting Goods, Wind Energy, etc. )
- 10.1. Market Analysis, Insights and Forecast - by Product Type
- 11. Middle East Composite Testing Equipment Industry Analysis, Insights and Forecast, 2020-2032
- 11.1. Market Analysis, Insights and Forecast - by Product Type
- 11.1.1. Ceramic Matrix Composites
- 11.1.2. Continuous Fiber Composites
- 11.1.3. Discontinuous Fiber Composites
- 11.1.4. Polymer Matrix Composites
- 11.1.5. Other Composites
- 11.2. Market Analysis, Insights and Forecast - by Testing Method
- 11.2.1. Destructive
- 11.2.2. Non-destructive
- 11.3. Market Analysis, Insights and Forecast - by Application
- 11.3.1. Aerospace and Defense
- 11.3.2. Automotive
- 11.3.3. Building & Construction
- 11.3.4. Electricals & Electronics
- 11.3.5. Others (Sporting Goods, Wind Energy, etc. )
- 11.1. Market Analysis, Insights and Forecast - by Product Type
- 12. Competitive Analysis
- 12.1. Company Profiles
- 12.1.1 Henkel AG & Co KGaA
- 12.1.1.1. Company Overview
- 12.1.1.2. Products
- 12.1.1.3. Company Financials
- 12.1.1.4. SWOT Analysis
- 12.1.2 Intertek Group PLC
- 12.1.2.1. Company Overview
- 12.1.2.2. Products
- 12.1.2.3. Company Financials
- 12.1.2.4. SWOT Analysis
- 12.1.3 ETIM Composites Testing Laboratory
- 12.1.3.1. Company Overview
- 12.1.3.2. Products
- 12.1.3.3. Company Financials
- 12.1.3.4. SWOT Analysis
- 12.1.4 Composites Testing Laboratory
- 12.1.4.1. Company Overview
- 12.1.4.2. Products
- 12.1.4.3. Company Financials
- 12.1.4.4. SWOT Analysis
- 12.1.5 Mistras Group Inc
- 12.1.5.1. Company Overview
- 12.1.5.2. Products
- 12.1.5.3. Company Financials
- 12.1.5.4. SWOT Analysis
- 12.1.6 Westmoreland Mechanical Testing & Research Inc
- 12.1.6.1. Company Overview
- 12.1.6.2. Products
- 12.1.6.3. Company Financials
- 12.1.6.4. SWOT Analysis
- 12.1.7 Element Materials Technology
- 12.1.7.1. Company Overview
- 12.1.7.2. Products
- 12.1.7.3. Company Financials
- 12.1.7.4. SWOT Analysis
- 12.1.8 Matrix Composites Inc (ITT Inc )
- 12.1.8.1. Company Overview
- 12.1.8.2. Products
- 12.1.8.3. Company Financials
- 12.1.8.4. SWOT Analysis
- 12.1.9 Instron Corporation (Illinois Tool Works Inc )
- 12.1.9.1. Company Overview
- 12.1.9.2. Products
- 12.1.9.3. Company Financials
- 12.1.9.4. SWOT Analysis
- 12.1.1 Henkel AG & Co KGaA
- 12.2. Market Entropy
- 12.2.1 Company's Key Areas Served
- 12.2.2 Recent Developments
- 12.3. Company Market Share Analysis 2025
- 12.3.1 Top 5 Companies Market Share Analysis
- 12.3.2 Top 3 Companies Market Share Analysis
- 12.4. List of Potential Customers
- 13. Research Methodology
List of Figures
- Figure 1: Global Composite Testing Equipment Industry Revenue Breakdown (billion, %) by Region 2025 & 2033
- Figure 2: Global Composite Testing Equipment Industry Volume Breakdown (K Unit, %) by Region 2025 & 2033
- Figure 3: North America Composite Testing Equipment Industry Revenue (billion), by Product Type 2025 & 2033
- Figure 4: North America Composite Testing Equipment Industry Volume (K Unit), by Product Type 2025 & 2033
- Figure 5: North America Composite Testing Equipment Industry Revenue Share (%), by Product Type 2025 & 2033
- Figure 6: North America Composite Testing Equipment Industry Volume Share (%), by Product Type 2025 & 2033
- Figure 7: North America Composite Testing Equipment Industry Revenue (billion), by Testing Method 2025 & 2033
- Figure 8: North America Composite Testing Equipment Industry Volume (K Unit), by Testing Method 2025 & 2033
- Figure 9: North America Composite Testing Equipment Industry Revenue Share (%), by Testing Method 2025 & 2033
- Figure 10: North America Composite Testing Equipment Industry Volume Share (%), by Testing Method 2025 & 2033
- Figure 11: North America Composite Testing Equipment Industry Revenue (billion), by Application 2025 & 2033
- Figure 12: North America Composite Testing Equipment Industry Volume (K Unit), by Application 2025 & 2033
- Figure 13: North America Composite Testing Equipment Industry Revenue Share (%), by Application 2025 & 2033
- Figure 14: North America Composite Testing Equipment Industry Volume Share (%), by Application 2025 & 2033
- Figure 15: North America Composite Testing Equipment Industry Revenue (billion), by Country 2025 & 2033
- Figure 16: North America Composite Testing Equipment Industry Volume (K Unit), by Country 2025 & 2033
- Figure 17: North America Composite Testing Equipment Industry Revenue Share (%), by Country 2025 & 2033
- Figure 18: North America Composite Testing Equipment Industry Volume Share (%), by Country 2025 & 2033
- Figure 19: Europe Composite Testing Equipment Industry Revenue (billion), by Product Type 2025 & 2033
- Figure 20: Europe Composite Testing Equipment Industry Volume (K Unit), by Product Type 2025 & 2033
- Figure 21: Europe Composite Testing Equipment Industry Revenue Share (%), by Product Type 2025 & 2033
- Figure 22: Europe Composite Testing Equipment Industry Volume Share (%), by Product Type 2025 & 2033
- Figure 23: Europe Composite Testing Equipment Industry Revenue (billion), by Testing Method 2025 & 2033
- Figure 24: Europe Composite Testing Equipment Industry Volume (K Unit), by Testing Method 2025 & 2033
- Figure 25: Europe Composite Testing Equipment Industry Revenue Share (%), by Testing Method 2025 & 2033
- Figure 26: Europe Composite Testing Equipment Industry Volume Share (%), by Testing Method 2025 & 2033
- Figure 27: Europe Composite Testing Equipment Industry Revenue (billion), by Application 2025 & 2033
- Figure 28: Europe Composite Testing Equipment Industry Volume (K Unit), by Application 2025 & 2033
- Figure 29: Europe Composite Testing Equipment Industry Revenue Share (%), by Application 2025 & 2033
- Figure 30: Europe Composite Testing Equipment Industry Volume Share (%), by Application 2025 & 2033
- Figure 31: Europe Composite Testing Equipment Industry Revenue (billion), by Country 2025 & 2033
- Figure 32: Europe Composite Testing Equipment Industry Volume (K Unit), by Country 2025 & 2033
- Figure 33: Europe Composite Testing Equipment Industry Revenue Share (%), by Country 2025 & 2033
- Figure 34: Europe Composite Testing Equipment Industry Volume Share (%), by Country 2025 & 2033
- Figure 35: Asia Pacific Composite Testing Equipment Industry Revenue (billion), by Product Type 2025 & 2033
- Figure 36: Asia Pacific Composite Testing Equipment Industry Volume (K Unit), by Product Type 2025 & 2033
- Figure 37: Asia Pacific Composite Testing Equipment Industry Revenue Share (%), by Product Type 2025 & 2033
- Figure 38: Asia Pacific Composite Testing Equipment Industry Volume Share (%), by Product Type 2025 & 2033
- Figure 39: Asia Pacific Composite Testing Equipment Industry Revenue (billion), by Testing Method 2025 & 2033
- Figure 40: Asia Pacific Composite Testing Equipment Industry Volume (K Unit), by Testing Method 2025 & 2033
- Figure 41: Asia Pacific Composite Testing Equipment Industry Revenue Share (%), by Testing Method 2025 & 2033
- Figure 42: Asia Pacific Composite Testing Equipment Industry Volume Share (%), by Testing Method 2025 & 2033
- Figure 43: Asia Pacific Composite Testing Equipment Industry Revenue (billion), by Application 2025 & 2033
- Figure 44: Asia Pacific Composite Testing Equipment Industry Volume (K Unit), by Application 2025 & 2033
- Figure 45: Asia Pacific Composite Testing Equipment Industry Revenue Share (%), by Application 2025 & 2033
- Figure 46: Asia Pacific Composite Testing Equipment Industry Volume Share (%), by Application 2025 & 2033
- Figure 47: Asia Pacific Composite Testing Equipment Industry Revenue (billion), by Country 2025 & 2033
- Figure 48: Asia Pacific Composite Testing Equipment Industry Volume (K Unit), by Country 2025 & 2033
- Figure 49: Asia Pacific Composite Testing Equipment Industry Revenue Share (%), by Country 2025 & 2033
- Figure 50: Asia Pacific Composite Testing Equipment Industry Volume Share (%), by Country 2025 & 2033
- Figure 51: Latin America Composite Testing Equipment Industry Revenue (billion), by Product Type 2025 & 2033
- Figure 52: Latin America Composite Testing Equipment Industry Volume (K Unit), by Product Type 2025 & 2033
- Figure 53: Latin America Composite Testing Equipment Industry Revenue Share (%), by Product Type 2025 & 2033
- Figure 54: Latin America Composite Testing Equipment Industry Volume Share (%), by Product Type 2025 & 2033
- Figure 55: Latin America Composite Testing Equipment Industry Revenue (billion), by Testing Method 2025 & 2033
- Figure 56: Latin America Composite Testing Equipment Industry Volume (K Unit), by Testing Method 2025 & 2033
- Figure 57: Latin America Composite Testing Equipment Industry Revenue Share (%), by Testing Method 2025 & 2033
- Figure 58: Latin America Composite Testing Equipment Industry Volume Share (%), by Testing Method 2025 & 2033
- Figure 59: Latin America Composite Testing Equipment Industry Revenue (billion), by Application 2025 & 2033
- Figure 60: Latin America Composite Testing Equipment Industry Volume (K Unit), by Application 2025 & 2033
- Figure 61: Latin America Composite Testing Equipment Industry Revenue Share (%), by Application 2025 & 2033
- Figure 62: Latin America Composite Testing Equipment Industry Volume Share (%), by Application 2025 & 2033
- Figure 63: Latin America Composite Testing Equipment Industry Revenue (billion), by Country 2025 & 2033
- Figure 64: Latin America Composite Testing Equipment Industry Volume (K Unit), by Country 2025 & 2033
- Figure 65: Latin America Composite Testing Equipment Industry Revenue Share (%), by Country 2025 & 2033
- Figure 66: Latin America Composite Testing Equipment Industry Volume Share (%), by Country 2025 & 2033
- Figure 67: Middle East Composite Testing Equipment Industry Revenue (billion), by Product Type 2025 & 2033
- Figure 68: Middle East Composite Testing Equipment Industry Volume (K Unit), by Product Type 2025 & 2033
- Figure 69: Middle East Composite Testing Equipment Industry Revenue Share (%), by Product Type 2025 & 2033
- Figure 70: Middle East Composite Testing Equipment Industry Volume Share (%), by Product Type 2025 & 2033
- Figure 71: Middle East Composite Testing Equipment Industry Revenue (billion), by Testing Method 2025 & 2033
- Figure 72: Middle East Composite Testing Equipment Industry Volume (K Unit), by Testing Method 2025 & 2033
- Figure 73: Middle East Composite Testing Equipment Industry Revenue Share (%), by Testing Method 2025 & 2033
- Figure 74: Middle East Composite Testing Equipment Industry Volume Share (%), by Testing Method 2025 & 2033
- Figure 75: Middle East Composite Testing Equipment Industry Revenue (billion), by Application 2025 & 2033
- Figure 76: Middle East Composite Testing Equipment Industry Volume (K Unit), by Application 2025 & 2033
- Figure 77: Middle East Composite Testing Equipment Industry Revenue Share (%), by Application 2025 & 2033
- Figure 78: Middle East Composite Testing Equipment Industry Volume Share (%), by Application 2025 & 2033
- Figure 79: Middle East Composite Testing Equipment Industry Revenue (billion), by Country 2025 & 2033
- Figure 80: Middle East Composite Testing Equipment Industry Volume (K Unit), by Country 2025 & 2033
- Figure 81: Middle East Composite Testing Equipment Industry Revenue Share (%), by Country 2025 & 2033
- Figure 82: Middle East Composite Testing Equipment Industry Volume Share (%), by Country 2025 & 2033
List of Tables
- Table 1: Global Composite Testing Equipment Industry Revenue billion Forecast, by Product Type 2020 & 2033
- Table 2: Global Composite Testing Equipment Industry Volume K Unit Forecast, by Product Type 2020 & 2033
- Table 3: Global Composite Testing Equipment Industry Revenue billion Forecast, by Testing Method 2020 & 2033
- Table 4: Global Composite Testing Equipment Industry Volume K Unit Forecast, by Testing Method 2020 & 2033
- Table 5: Global Composite Testing Equipment Industry Revenue billion Forecast, by Application 2020 & 2033
- Table 6: Global Composite Testing Equipment Industry Volume K Unit Forecast, by Application 2020 & 2033
- Table 7: Global Composite Testing Equipment Industry Revenue billion Forecast, by Region 2020 & 2033
- Table 8: Global Composite Testing Equipment Industry Volume K Unit Forecast, by Region 2020 & 2033
- Table 9: Global Composite Testing Equipment Industry Revenue billion Forecast, by Product Type 2020 & 2033
- Table 10: Global Composite Testing Equipment Industry Volume K Unit Forecast, by Product Type 2020 & 2033
- Table 11: Global Composite Testing Equipment Industry Revenue billion Forecast, by Testing Method 2020 & 2033
- Table 12: Global Composite Testing Equipment Industry Volume K Unit Forecast, by Testing Method 2020 & 2033
- Table 13: Global Composite Testing Equipment Industry Revenue billion Forecast, by Application 2020 & 2033
- Table 14: Global Composite Testing Equipment Industry Volume K Unit Forecast, by Application 2020 & 2033
- Table 15: Global Composite Testing Equipment Industry Revenue billion Forecast, by Country 2020 & 2033
- Table 16: Global Composite Testing Equipment Industry Volume K Unit Forecast, by Country 2020 & 2033
- Table 17: Global Composite Testing Equipment Industry Revenue billion Forecast, by Product Type 2020 & 2033
- Table 18: Global Composite Testing Equipment Industry Volume K Unit Forecast, by Product Type 2020 & 2033
- Table 19: Global Composite Testing Equipment Industry Revenue billion Forecast, by Testing Method 2020 & 2033
- Table 20: Global Composite Testing Equipment Industry Volume K Unit Forecast, by Testing Method 2020 & 2033
- Table 21: Global Composite Testing Equipment Industry Revenue billion Forecast, by Application 2020 & 2033
- Table 22: Global Composite Testing Equipment Industry Volume K Unit Forecast, by Application 2020 & 2033
- Table 23: Global Composite Testing Equipment Industry Revenue billion Forecast, by Country 2020 & 2033
- Table 24: Global Composite Testing Equipment Industry Volume K Unit Forecast, by Country 2020 & 2033
- Table 25: Global Composite Testing Equipment Industry Revenue billion Forecast, by Product Type 2020 & 2033
- Table 26: Global Composite Testing Equipment Industry Volume K Unit Forecast, by Product Type 2020 & 2033
- Table 27: Global Composite Testing Equipment Industry Revenue billion Forecast, by Testing Method 2020 & 2033
- Table 28: Global Composite Testing Equipment Industry Volume K Unit Forecast, by Testing Method 2020 & 2033
- Table 29: Global Composite Testing Equipment Industry Revenue billion Forecast, by Application 2020 & 2033
- Table 30: Global Composite Testing Equipment Industry Volume K Unit Forecast, by Application 2020 & 2033
- Table 31: Global Composite Testing Equipment Industry Revenue billion Forecast, by Country 2020 & 2033
- Table 32: Global Composite Testing Equipment Industry Volume K Unit Forecast, by Country 2020 & 2033
- Table 33: Global Composite Testing Equipment Industry Revenue billion Forecast, by Product Type 2020 & 2033
- Table 34: Global Composite Testing Equipment Industry Volume K Unit Forecast, by Product Type 2020 & 2033
- Table 35: Global Composite Testing Equipment Industry Revenue billion Forecast, by Testing Method 2020 & 2033
- Table 36: Global Composite Testing Equipment Industry Volume K Unit Forecast, by Testing Method 2020 & 2033
- Table 37: Global Composite Testing Equipment Industry Revenue billion Forecast, by Application 2020 & 2033
- Table 38: Global Composite Testing Equipment Industry Volume K Unit Forecast, by Application 2020 & 2033
- Table 39: Global Composite Testing Equipment Industry Revenue billion Forecast, by Country 2020 & 2033
- Table 40: Global Composite Testing Equipment Industry Volume K Unit Forecast, by Country 2020 & 2033
- Table 41: Global Composite Testing Equipment Industry Revenue billion Forecast, by Product Type 2020 & 2033
- Table 42: Global Composite Testing Equipment Industry Volume K Unit Forecast, by Product Type 2020 & 2033
- Table 43: Global Composite Testing Equipment Industry Revenue billion Forecast, by Testing Method 2020 & 2033
- Table 44: Global Composite Testing Equipment Industry Volume K Unit Forecast, by Testing Method 2020 & 2033
- Table 45: Global Composite Testing Equipment Industry Revenue billion Forecast, by Application 2020 & 2033
- Table 46: Global Composite Testing Equipment Industry Volume K Unit Forecast, by Application 2020 & 2033
- Table 47: Global Composite Testing Equipment Industry Revenue billion Forecast, by Country 2020 & 2033
- Table 48: Global Composite Testing Equipment Industry Volume K Unit Forecast, by Country 2020 & 2033
Frequently Asked Questions
1. What is the projected Compound Annual Growth Rate (CAGR) of the Composite Testing Equipment Industry?
The projected CAGR is approximately 7.16%.
2. Which companies are prominent players in the Composite Testing Equipment Industry?
Key companies in the market include Henkel AG & Co KGaA, Intertek Group PLC, ETIM Composites Testing Laboratory, Composites Testing Laboratory, Mistras Group Inc, Westmoreland Mechanical Testing & Research Inc , Element Materials Technology, Matrix Composites Inc (ITT Inc ), Instron Corporation (Illinois Tool Works Inc ).
3. What are the main segments of the Composite Testing Equipment Industry?
The market segments include Product Type, Testing Method, Application.
4. Can you provide details about the market size?
The market size is estimated to be USD 2.58 billion as of 2022.
5. What are some drivers contributing to market growth?
; Large Investments on Composites Testing Facilities in Asia-Pacific; Increasing Demand for Composite Testing From Automotive and Aerospace & Defense; Growing Demand for Testing of Hydraulic Frames in Aerospace & Defense Application.
6. What are the notable trends driving market growth?
Building and Construction Segment Expected to Show Significant Growth in Application.
7. Are there any restraints impacting market growth?
; Lack of Trained Operators and Expertise in Developing Regions; Issues Related to Recyclability of Composites.
8. Can you provide examples of recent developments in the market?
N/A
9. What pricing options are available for accessing the report?
Pricing options include single-user, multi-user, and enterprise licenses priced at USD 4750, USD 5250, and USD 8750 respectively.
10. Is the market size provided in terms of value or volume?
The market size is provided in terms of value, measured in billion and volume, measured in K Unit.
11. Are there any specific market keywords associated with the report?
Yes, the market keyword associated with the report is "Composite Testing Equipment Industry," which aids in identifying and referencing the specific market segment covered.
12. How do I determine which pricing option suits my needs best?
The pricing options vary based on user requirements and access needs. Individual users may opt for single-user licenses, while businesses requiring broader access may choose multi-user or enterprise licenses for cost-effective access to the report.
13. Are there any additional resources or data provided in the Composite Testing Equipment Industry report?
While the report offers comprehensive insights, it's advisable to review the specific contents or supplementary materials provided to ascertain if additional resources or data are available.
14. How can I stay updated on further developments or reports in the Composite Testing Equipment Industry?
To stay informed about further developments, trends, and reports in the Composite Testing Equipment Industry, consider subscribing to industry newsletters, following relevant companies and organizations, or regularly checking reputable industry news sources and publications.
Methodology
Step 1 - Identification of Relevant Samples Size from Population Database


Step 2 - Approaches for Defining Global Market Size (Value, Volume* & Price*)

Note*: In applicable scenarios
Step 3 - Data Sources
Primary Research
- Web Analytics
- Survey Reports
- Research Institute
- Latest Research Reports
- Opinion Leaders
Secondary Research
- Annual Reports
- White Paper
- Latest Press Release
- Industry Association
- Paid Database
- Investor Presentations

Step 4 - Data Triangulation
Involves using different sources of information in order to increase the validity of a study
These sources are likely to be stakeholders in a program - participants, other researchers, program staff, other community members, and so on.
Then we put all data in single framework & apply various statistical tools to find out the dynamic on the market.
During the analysis stage, feedback from the stakeholder groups would be compared to determine areas of agreement as well as areas of divergence