
Key Insights
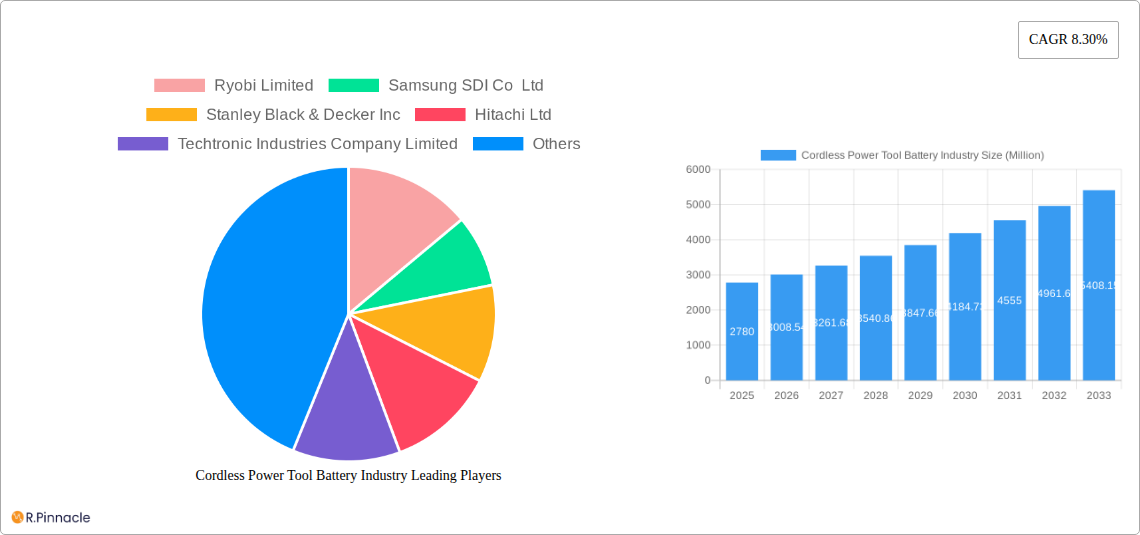
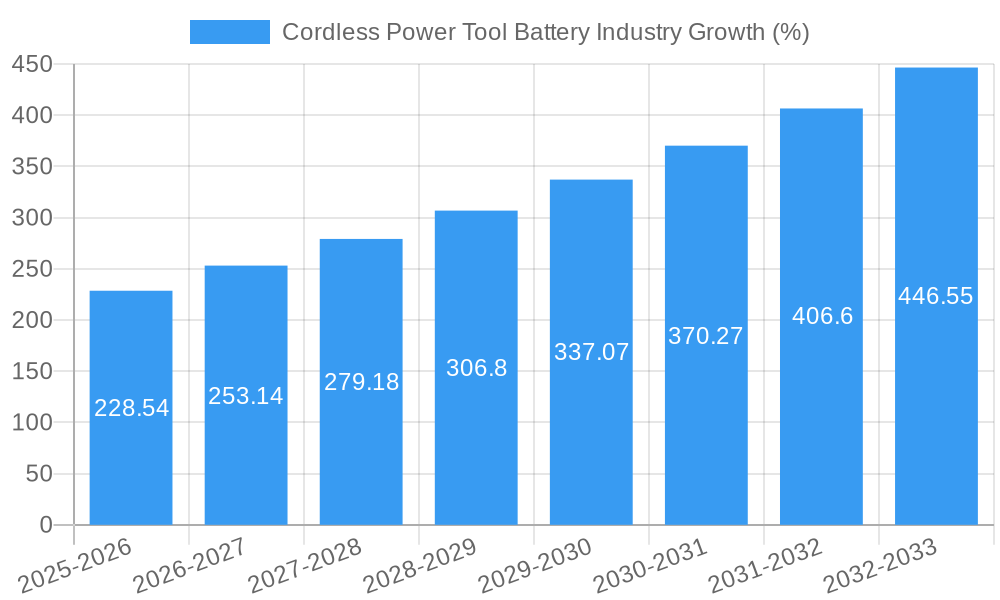
The cordless power tool battery market, valued at $2.78 billion in 2025, is experiencing robust growth, projected to expand at a compound annual growth rate (CAGR) of 8.30% from 2025 to 2033. This growth is fueled by several key factors. The increasing adoption of cordless power tools across diverse sectors like construction, DIY, and industrial applications is a primary driver. Consumers and professionals alike are drawn to the convenience, portability, and reduced noise pollution offered by cordless models compared to their corded counterparts. Furthermore, advancements in battery technology, particularly in lithium-ion batteries, are enhancing performance metrics such as power output, longevity, and charging times. This technological progress is leading to lighter, more efficient tools, further boosting market demand. The rise of e-commerce and improved distribution channels are also contributing to market expansion by making cordless power tools and their replacement batteries more accessible globally. However, the market faces certain restraints, including the relatively higher initial cost of cordless tools compared to corded alternatives and concerns regarding battery life and environmental impact related to disposal and recycling.
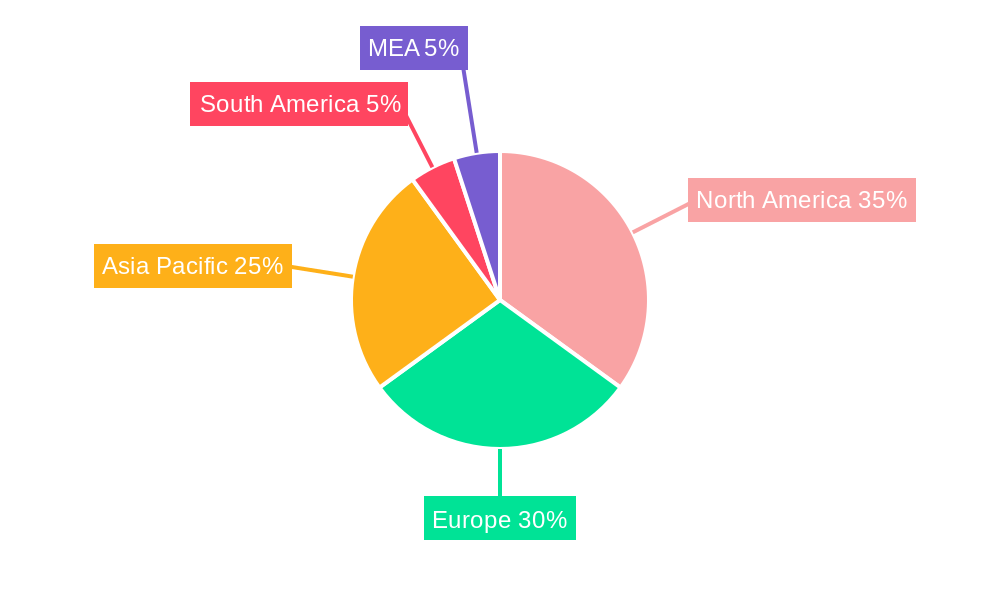
Segment-wise, lithium-ion batteries dominate the technology type segment due to their superior energy density and performance characteristics. The geographic landscape shows a strong presence in North America and Europe, driven by high adoption rates and strong economies. However, the Asia-Pacific region is expected to witness significant growth in the coming years, fueled by rapid industrialization and increasing infrastructure development in countries like China and India. Key players like Ryobi, Samsung SDI, Stanley Black & Decker, Hitachi, Techtronic Industries, Hilti, Sony, Bosch, Panasonic, and Makita are shaping the competitive landscape through innovation, strategic partnerships, and geographic expansion. The market is characterized by intense competition, driven by product differentiation, technological advancements, and pricing strategies. The forecast period suggests a continued upward trajectory for the cordless power tool battery market, with potential for further growth based on innovations in battery chemistry, faster charging technologies, and increased focus on sustainability.
Cordless Power Tool Battery Industry Market Report: 2019-2033
This comprehensive report provides a detailed analysis of the cordless power tool battery industry, offering invaluable insights for industry professionals, investors, and strategic decision-makers. The report covers the period 2019-2033, with a focus on the forecast period 2025-2033 and a base year of 2025. The market is segmented by technology type (Lithium-ion, Nickel-Cadmium, Other) and geographically analyzed to reveal key trends and opportunities. The total market value is expected to reach xx Million by 2033.
Cordless Power Tool Battery Industry Market Structure & Innovation Trends
This section analyzes the market's competitive landscape, focusing on market concentration, innovation drivers, regulatory influences, and M&A activity. Key players like Ryobi Limited, Samsung SDI Co Ltd, Stanley Black & Decker Inc, Hitachi Ltd, Techtronic Industries Company Limited, Hilti Corporation, Sony Group Corporation, Bosch Ltd, Panasonic Corporation, and Makita Corporation, contribute to a dynamic market structure with varying market shares. The report includes a detailed 6x4 market ranking/share (%) analysis to illustrate the competitive dynamics. Several significant M&A deals have reshaped the industry landscape in recent years, with deal values totaling xx Million during the historical period. The analysis includes metrics such as market concentration ratios and the impact of regulatory frameworks on innovation and product development. It also explores the influence of substitute products and the evolving end-user demographics driving demand.
- Market Concentration: High, with the top 6 players controlling xx% of the market in 2024.
- Innovation Drivers: Demand for higher energy density batteries, improved safety features, and sustainable materials.
- Regulatory Frameworks: Stringent environmental regulations and safety standards impacting battery production and disposal.
- M&A Activity: Significant consolidation in the industry through mergers and acquisitions, with total deal values reaching xx Million between 2019 and 2024.
Cordless Power Tool Battery Industry Market Dynamics & Trends
This section delves into the key drivers and trends shaping the cordless power tool battery market. It examines market growth drivers, including rising demand for cordless power tools across diverse sectors, the increasing adoption of lithium-ion technology, and growing investments in research and development. The report also highlights technological disruptions, such as advancements in battery chemistry and energy storage capacity. Analysis of consumer preferences, encompassing factors like price sensitivity, battery life, and sustainability concerns, is also included. The competitive dynamics, encompassing strategies employed by key players, are thoroughly explored. The report projects a CAGR of xx% during the forecast period (2025-2033), with market penetration expected to reach xx% by 2033.
Dominant Regions & Segments in Cordless Power Tool Battery Industry
This section identifies the leading regions and segments within the cordless power tool battery market. The analysis focuses on geographical dominance, pinpointing key regions driving market growth and factors contributing to their success. The report also provides a detailed segmental analysis, highlighting the leading technology type: Lithium-ion, and explores the dynamics of Nickel-Cadmium and Other Technology Types.
- Dominant Region: North America, driven by strong demand from the construction and DIY sectors.
- Key Drivers for North America:
- Strong economic growth and infrastructure development.
- High adoption of advanced cordless power tools.
- Favorable government policies supporting sustainable technologies.
- Lithium-ion Dominance: The lithium-ion segment holds the largest market share, driven by its high energy density and long lifespan.
Cordless Power Tool Battery Industry Product Innovations
This section summarizes recent product developments and their impact on market competition. The focus is on technological advancements, such as improved battery chemistries and enhanced power management systems. The analysis highlights how these innovations contribute to improved product performance, longer battery life, and enhanced safety features. The report also examines how these innovations contribute to the market fit and competitive positioning of different players.
Report Scope & Segmentation Analysis
The report covers the global cordless power tool battery market, segmented by technology type:
Lithium-ion: This segment is projected to experience substantial growth due to its high energy density, long lifespan, and improved safety features. Market size is estimated at xx Million in 2025 and is projected to reach xx Million by 2033. Competitive dynamics are intense, with leading players vying for market share through technological advancements and strategic partnerships.
Nickel-cadmium: This segment is experiencing a decline due to environmental concerns and the emergence of superior alternatives. Market size is currently xx Million in 2025 and projected to decline to xx Million by 2033. Competition is limited to a few niche players.
Other Technology Types: This segment includes emerging technologies with potential for future growth. The market size for 2025 is estimated at xx Million and is projected to reach xx Million by 2033. This segment is characterized by higher innovation activity.
Key Drivers of Cordless Power Tool Battery Industry Growth
Several factors are driving the growth of the cordless power tool battery industry. These include advancements in battery technology, leading to increased energy density, improved performance, and longer lifespan. The rising demand for cordless power tools across various sectors, particularly construction and DIY, also fuels market expansion. Government regulations promoting sustainable technologies and supportive economic policies further contribute to growth.
Challenges in the Cordless Power Tool Battery Industry Sector
The industry faces challenges, including volatile raw material prices affecting production costs and supply chain disruptions. Stringent environmental regulations and the need for responsible battery disposal pose significant hurdles. Intense competition among major players also creates pricing pressures and necessitates continuous innovation. These factors can impact profitability and sustainable growth.
Emerging Opportunities in Cordless Power Tool Battery Industry
The industry presents exciting opportunities, including the expansion into new markets, particularly in developing economies. Advancements in battery technology, such as solid-state batteries, offer considerable potential. The growing demand for eco-friendly and sustainable battery solutions creates a significant opportunity for innovation and market expansion. The increasing focus on smart tools and IoT integration creates opportunities for value-added services and data analytics.
Leading Players in the Cordless Power Tool Battery Industry Market
- Ryobi Limited
- Samsung SDI Co Ltd
- Stanley Black & Decker Inc
- Hitachi Ltd
- Techtronic Industries Company Limited
- Hilti Corporation
- Sony Group Corporation
- Bosch Ltd
- Panasonic Corporation
- Makita Corporation
Key Developments in Cordless Power Tool Battery Industry
- January 2023: Hilti North America announced the addition of over 30 new cordless tools to its Nuron battery-powered tool portfolio.
- October 2022: Stanley Black & Decker's Black & Decker brand launched a new line of Reviva cordless power tools.
Future Outlook for Cordless Power Tool Battery Industry Market
The future outlook for the cordless power tool battery industry is positive, driven by continuous technological advancements, increasing demand from various sectors, and supportive government policies. The market is expected to experience robust growth, with opportunities for expansion into new geographical markets and the development of innovative battery technologies. Strategic collaborations and mergers & acquisitions will likely shape the industry's competitive landscape. The focus on sustainability and environmental concerns will drive the adoption of eco-friendly battery solutions.
Cordless Power Tool Battery Industry Segmentation
-
1. Technology Type
- 1.1. Lithium-ion
- 1.2. Nickel-cadmium
- 1.3. Other Technology Types
Cordless Power Tool Battery Industry Segmentation By Geography
-
1. North America
- 1.1. United States
- 1.2. Canada
- 1.3. Rest of North America
-
2. Europe
- 2.1. Germany
- 2.2. France
- 2.3. United Kingdom
- 2.4. Italy
- 2.5. Rest of Europe
-
3. Asia Pacific
- 3.1. China
- 3.2. India
- 3.3. Japan
- 3.4. Australia
- 3.5. Rest of Asia Pacific
-
4. South America
- 4.1. Brazil
- 4.2. Argentina
- 4.3. Chile
- 4.4. Rest of South America
-
5. Middle East and Africa
- 5.1. United Arab Emirates
- 5.2. Saudi Arabia
- 5.3. Qatar
- 5.4. South Africa
- 5.5. Egypt
- 5.6. Rest of Middle East and Africa
Cordless Power Tool Battery Industry REPORT HIGHLIGHTS
| Aspects | Details |
|---|---|
| Study Period | 2019-2033 |
| Base Year | 2024 |
| Estimated Year | 2025 |
| Forecast Period | 2025-2033 |
| Historical Period | 2019-2024 |
| Growth Rate | CAGR of 8.30% from 2019-2033 |
| Segmentation |
|
Table of Contents
- 1. Introduction
- 1.1. Research Scope
- 1.2. Market Segmentation
- 1.3. Research Methodology
- 1.4. Definitions and Assumptions
- 2. Executive Summary
- 2.1. Introduction
- 3. Market Dynamics
- 3.1. Introduction
- 3.2. Market Drivers
- 3.2.1. 4.; Increasing Adoption Of Battery-Powered Power Tools4.; Rapidly Growing Automotive Industry
- 3.3. Market Restrains
- 3.3.1. 4.; High Cost Associated With Cordless Power Tool Equipment
- 3.4. Market Trends
- 3.4.1. The Lithium-ion Type is Expected to Dominate the Market
- 4. Market Factor Analysis
- 4.1. Porters Five Forces
- 4.2. Supply/Value Chain
- 4.3. PESTEL analysis
- 4.4. Market Entropy
- 4.5. Patent/Trademark Analysis
- 5. Global Cordless Power Tool Battery Industry Analysis, Insights and Forecast, 2019-2031
- 5.1. Market Analysis, Insights and Forecast - by Technology Type
- 5.1.1. Lithium-ion
- 5.1.2. Nickel-cadmium
- 5.1.3. Other Technology Types
- 5.2. Market Analysis, Insights and Forecast - by Region
- 5.2.1. North America
- 5.2.2. Europe
- 5.2.3. Asia Pacific
- 5.2.4. South America
- 5.2.5. Middle East and Africa
- 5.1. Market Analysis, Insights and Forecast - by Technology Type
- 6. North America Cordless Power Tool Battery Industry Analysis, Insights and Forecast, 2019-2031
- 6.1. Market Analysis, Insights and Forecast - by Technology Type
- 6.1.1. Lithium-ion
- 6.1.2. Nickel-cadmium
- 6.1.3. Other Technology Types
- 6.1. Market Analysis, Insights and Forecast - by Technology Type
- 7. Europe Cordless Power Tool Battery Industry Analysis, Insights and Forecast, 2019-2031
- 7.1. Market Analysis, Insights and Forecast - by Technology Type
- 7.1.1. Lithium-ion
- 7.1.2. Nickel-cadmium
- 7.1.3. Other Technology Types
- 7.1. Market Analysis, Insights and Forecast - by Technology Type
- 8. Asia Pacific Cordless Power Tool Battery Industry Analysis, Insights and Forecast, 2019-2031
- 8.1. Market Analysis, Insights and Forecast - by Technology Type
- 8.1.1. Lithium-ion
- 8.1.2. Nickel-cadmium
- 8.1.3. Other Technology Types
- 8.1. Market Analysis, Insights and Forecast - by Technology Type
- 9. South America Cordless Power Tool Battery Industry Analysis, Insights and Forecast, 2019-2031
- 9.1. Market Analysis, Insights and Forecast - by Technology Type
- 9.1.1. Lithium-ion
- 9.1.2. Nickel-cadmium
- 9.1.3. Other Technology Types
- 9.1. Market Analysis, Insights and Forecast - by Technology Type
- 10. Middle East and Africa Cordless Power Tool Battery Industry Analysis, Insights and Forecast, 2019-2031
- 10.1. Market Analysis, Insights and Forecast - by Technology Type
- 10.1.1. Lithium-ion
- 10.1.2. Nickel-cadmium
- 10.1.3. Other Technology Types
- 10.1. Market Analysis, Insights and Forecast - by Technology Type
- 11. North America Cordless Power Tool Battery Industry Analysis, Insights and Forecast, 2019-2031
- 11.1. Market Analysis, Insights and Forecast - By Country/Sub-region
- 11.1.1 United States
- 11.1.2 Canada
- 11.1.3 Mexico
- 12. Europe Cordless Power Tool Battery Industry Analysis, Insights and Forecast, 2019-2031
- 12.1. Market Analysis, Insights and Forecast - By Country/Sub-region
- 12.1.1 Germany
- 12.1.2 United Kingdom
- 12.1.3 France
- 12.1.4 Spain
- 12.1.5 Italy
- 12.1.6 Spain
- 12.1.7 Belgium
- 12.1.8 Netherland
- 12.1.9 Nordics
- 12.1.10 Rest of Europe
- 13. Asia Pacific Cordless Power Tool Battery Industry Analysis, Insights and Forecast, 2019-2031
- 13.1. Market Analysis, Insights and Forecast - By Country/Sub-region
- 13.1.1 China
- 13.1.2 Japan
- 13.1.3 India
- 13.1.4 South Korea
- 13.1.5 Southeast Asia
- 13.1.6 Australia
- 13.1.7 Indonesia
- 13.1.8 Phillipes
- 13.1.9 Singapore
- 13.1.10 Thailandc
- 13.1.11 Rest of Asia Pacific
- 14. South America Cordless Power Tool Battery Industry Analysis, Insights and Forecast, 2019-2031
- 14.1. Market Analysis, Insights and Forecast - By Country/Sub-region
- 14.1.1 Brazil
- 14.1.2 Argentina
- 14.1.3 Peru
- 14.1.4 Chile
- 14.1.5 Colombia
- 14.1.6 Ecuador
- 14.1.7 Venezuela
- 14.1.8 Rest of South America
- 15. North America Cordless Power Tool Battery Industry Analysis, Insights and Forecast, 2019-2031
- 15.1. Market Analysis, Insights and Forecast - By Country/Sub-region
- 15.1.1 United States
- 15.1.2 Canada
- 15.1.3 Mexico
- 16. MEA Cordless Power Tool Battery Industry Analysis, Insights and Forecast, 2019-2031
- 16.1. Market Analysis, Insights and Forecast - By Country/Sub-region
- 16.1.1 United Arab Emirates
- 16.1.2 Saudi Arabia
- 16.1.3 South Africa
- 16.1.4 Rest of Middle East and Africa
- 17. Competitive Analysis
- 17.1. Global Market Share Analysis 2024
- 17.2. Company Profiles
- 17.2.1 Ryobi Limited
- 17.2.1.1. Overview
- 17.2.1.2. Products
- 17.2.1.3. SWOT Analysis
- 17.2.1.4. Recent Developments
- 17.2.1.5. Financials (Based on Availability)
- 17.2.2 Samsung SDI Co Ltd
- 17.2.2.1. Overview
- 17.2.2.2. Products
- 17.2.2.3. SWOT Analysis
- 17.2.2.4. Recent Developments
- 17.2.2.5. Financials (Based on Availability)
- 17.2.3 Stanley Black & Decker Inc
- 17.2.3.1. Overview
- 17.2.3.2. Products
- 17.2.3.3. SWOT Analysis
- 17.2.3.4. Recent Developments
- 17.2.3.5. Financials (Based on Availability)
- 17.2.4 Hitachi Ltd
- 17.2.4.1. Overview
- 17.2.4.2. Products
- 17.2.4.3. SWOT Analysis
- 17.2.4.4. Recent Developments
- 17.2.4.5. Financials (Based on Availability)
- 17.2.5 Techtronic Industries Company Limited
- 17.2.5.1. Overview
- 17.2.5.2. Products
- 17.2.5.3. SWOT Analysis
- 17.2.5.4. Recent Developments
- 17.2.5.5. Financials (Based on Availability)
- 17.2.6 Hilti Corporation*List Not Exhaustive 6 4 Market Ranking/Share (%) Analysi
- 17.2.6.1. Overview
- 17.2.6.2. Products
- 17.2.6.3. SWOT Analysis
- 17.2.6.4. Recent Developments
- 17.2.6.5. Financials (Based on Availability)
- 17.2.7 Sony Group Corporation
- 17.2.7.1. Overview
- 17.2.7.2. Products
- 17.2.7.3. SWOT Analysis
- 17.2.7.4. Recent Developments
- 17.2.7.5. Financials (Based on Availability)
- 17.2.8 Bosch Ltd
- 17.2.8.1. Overview
- 17.2.8.2. Products
- 17.2.8.3. SWOT Analysis
- 17.2.8.4. Recent Developments
- 17.2.8.5. Financials (Based on Availability)
- 17.2.9 Panasonic Corporation
- 17.2.9.1. Overview
- 17.2.9.2. Products
- 17.2.9.3. SWOT Analysis
- 17.2.9.4. Recent Developments
- 17.2.9.5. Financials (Based on Availability)
- 17.2.10 Makita Corporation
- 17.2.10.1. Overview
- 17.2.10.2. Products
- 17.2.10.3. SWOT Analysis
- 17.2.10.4. Recent Developments
- 17.2.10.5. Financials (Based on Availability)
- 17.2.1 Ryobi Limited
List of Figures
- Figure 1: Global Cordless Power Tool Battery Industry Revenue Breakdown (Million, %) by Region 2024 & 2032
- Figure 2: Global Cordless Power Tool Battery Industry Volume Breakdown (K Unit, %) by Region 2024 & 2032
- Figure 3: North America Cordless Power Tool Battery Industry Revenue (Million), by Country 2024 & 2032
- Figure 4: North America Cordless Power Tool Battery Industry Volume (K Unit), by Country 2024 & 2032
- Figure 5: North America Cordless Power Tool Battery Industry Revenue Share (%), by Country 2024 & 2032
- Figure 6: North America Cordless Power Tool Battery Industry Volume Share (%), by Country 2024 & 2032
- Figure 7: Europe Cordless Power Tool Battery Industry Revenue (Million), by Country 2024 & 2032
- Figure 8: Europe Cordless Power Tool Battery Industry Volume (K Unit), by Country 2024 & 2032
- Figure 9: Europe Cordless Power Tool Battery Industry Revenue Share (%), by Country 2024 & 2032
- Figure 10: Europe Cordless Power Tool Battery Industry Volume Share (%), by Country 2024 & 2032
- Figure 11: Asia Pacific Cordless Power Tool Battery Industry Revenue (Million), by Country 2024 & 2032
- Figure 12: Asia Pacific Cordless Power Tool Battery Industry Volume (K Unit), by Country 2024 & 2032
- Figure 13: Asia Pacific Cordless Power Tool Battery Industry Revenue Share (%), by Country 2024 & 2032
- Figure 14: Asia Pacific Cordless Power Tool Battery Industry Volume Share (%), by Country 2024 & 2032
- Figure 15: South America Cordless Power Tool Battery Industry Revenue (Million), by Country 2024 & 2032
- Figure 16: South America Cordless Power Tool Battery Industry Volume (K Unit), by Country 2024 & 2032
- Figure 17: South America Cordless Power Tool Battery Industry Revenue Share (%), by Country 2024 & 2032
- Figure 18: South America Cordless Power Tool Battery Industry Volume Share (%), by Country 2024 & 2032
- Figure 19: North America Cordless Power Tool Battery Industry Revenue (Million), by Country 2024 & 2032
- Figure 20: North America Cordless Power Tool Battery Industry Volume (K Unit), by Country 2024 & 2032
- Figure 21: North America Cordless Power Tool Battery Industry Revenue Share (%), by Country 2024 & 2032
- Figure 22: North America Cordless Power Tool Battery Industry Volume Share (%), by Country 2024 & 2032
- Figure 23: MEA Cordless Power Tool Battery Industry Revenue (Million), by Country 2024 & 2032
- Figure 24: MEA Cordless Power Tool Battery Industry Volume (K Unit), by Country 2024 & 2032
- Figure 25: MEA Cordless Power Tool Battery Industry Revenue Share (%), by Country 2024 & 2032
- Figure 26: MEA Cordless Power Tool Battery Industry Volume Share (%), by Country 2024 & 2032
- Figure 27: North America Cordless Power Tool Battery Industry Revenue (Million), by Technology Type 2024 & 2032
- Figure 28: North America Cordless Power Tool Battery Industry Volume (K Unit), by Technology Type 2024 & 2032
- Figure 29: North America Cordless Power Tool Battery Industry Revenue Share (%), by Technology Type 2024 & 2032
- Figure 30: North America Cordless Power Tool Battery Industry Volume Share (%), by Technology Type 2024 & 2032
- Figure 31: North America Cordless Power Tool Battery Industry Revenue (Million), by Country 2024 & 2032
- Figure 32: North America Cordless Power Tool Battery Industry Volume (K Unit), by Country 2024 & 2032
- Figure 33: North America Cordless Power Tool Battery Industry Revenue Share (%), by Country 2024 & 2032
- Figure 34: North America Cordless Power Tool Battery Industry Volume Share (%), by Country 2024 & 2032
- Figure 35: Europe Cordless Power Tool Battery Industry Revenue (Million), by Technology Type 2024 & 2032
- Figure 36: Europe Cordless Power Tool Battery Industry Volume (K Unit), by Technology Type 2024 & 2032
- Figure 37: Europe Cordless Power Tool Battery Industry Revenue Share (%), by Technology Type 2024 & 2032
- Figure 38: Europe Cordless Power Tool Battery Industry Volume Share (%), by Technology Type 2024 & 2032
- Figure 39: Europe Cordless Power Tool Battery Industry Revenue (Million), by Country 2024 & 2032
- Figure 40: Europe Cordless Power Tool Battery Industry Volume (K Unit), by Country 2024 & 2032
- Figure 41: Europe Cordless Power Tool Battery Industry Revenue Share (%), by Country 2024 & 2032
- Figure 42: Europe Cordless Power Tool Battery Industry Volume Share (%), by Country 2024 & 2032
- Figure 43: Asia Pacific Cordless Power Tool Battery Industry Revenue (Million), by Technology Type 2024 & 2032
- Figure 44: Asia Pacific Cordless Power Tool Battery Industry Volume (K Unit), by Technology Type 2024 & 2032
- Figure 45: Asia Pacific Cordless Power Tool Battery Industry Revenue Share (%), by Technology Type 2024 & 2032
- Figure 46: Asia Pacific Cordless Power Tool Battery Industry Volume Share (%), by Technology Type 2024 & 2032
- Figure 47: Asia Pacific Cordless Power Tool Battery Industry Revenue (Million), by Country 2024 & 2032
- Figure 48: Asia Pacific Cordless Power Tool Battery Industry Volume (K Unit), by Country 2024 & 2032
- Figure 49: Asia Pacific Cordless Power Tool Battery Industry Revenue Share (%), by Country 2024 & 2032
- Figure 50: Asia Pacific Cordless Power Tool Battery Industry Volume Share (%), by Country 2024 & 2032
- Figure 51: South America Cordless Power Tool Battery Industry Revenue (Million), by Technology Type 2024 & 2032
- Figure 52: South America Cordless Power Tool Battery Industry Volume (K Unit), by Technology Type 2024 & 2032
- Figure 53: South America Cordless Power Tool Battery Industry Revenue Share (%), by Technology Type 2024 & 2032
- Figure 54: South America Cordless Power Tool Battery Industry Volume Share (%), by Technology Type 2024 & 2032
- Figure 55: South America Cordless Power Tool Battery Industry Revenue (Million), by Country 2024 & 2032
- Figure 56: South America Cordless Power Tool Battery Industry Volume (K Unit), by Country 2024 & 2032
- Figure 57: South America Cordless Power Tool Battery Industry Revenue Share (%), by Country 2024 & 2032
- Figure 58: South America Cordless Power Tool Battery Industry Volume Share (%), by Country 2024 & 2032
- Figure 59: Middle East and Africa Cordless Power Tool Battery Industry Revenue (Million), by Technology Type 2024 & 2032
- Figure 60: Middle East and Africa Cordless Power Tool Battery Industry Volume (K Unit), by Technology Type 2024 & 2032
- Figure 61: Middle East and Africa Cordless Power Tool Battery Industry Revenue Share (%), by Technology Type 2024 & 2032
- Figure 62: Middle East and Africa Cordless Power Tool Battery Industry Volume Share (%), by Technology Type 2024 & 2032
- Figure 63: Middle East and Africa Cordless Power Tool Battery Industry Revenue (Million), by Country 2024 & 2032
- Figure 64: Middle East and Africa Cordless Power Tool Battery Industry Volume (K Unit), by Country 2024 & 2032
- Figure 65: Middle East and Africa Cordless Power Tool Battery Industry Revenue Share (%), by Country 2024 & 2032
- Figure 66: Middle East and Africa Cordless Power Tool Battery Industry Volume Share (%), by Country 2024 & 2032
List of Tables
- Table 1: Global Cordless Power Tool Battery Industry Revenue Million Forecast, by Region 2019 & 2032
- Table 2: Global Cordless Power Tool Battery Industry Volume K Unit Forecast, by Region 2019 & 2032
- Table 3: Global Cordless Power Tool Battery Industry Revenue Million Forecast, by Technology Type 2019 & 2032
- Table 4: Global Cordless Power Tool Battery Industry Volume K Unit Forecast, by Technology Type 2019 & 2032
- Table 5: Global Cordless Power Tool Battery Industry Revenue Million Forecast, by Region 2019 & 2032
- Table 6: Global Cordless Power Tool Battery Industry Volume K Unit Forecast, by Region 2019 & 2032
- Table 7: Global Cordless Power Tool Battery Industry Revenue Million Forecast, by Country 2019 & 2032
- Table 8: Global Cordless Power Tool Battery Industry Volume K Unit Forecast, by Country 2019 & 2032
- Table 9: United States Cordless Power Tool Battery Industry Revenue (Million) Forecast, by Application 2019 & 2032
- Table 10: United States Cordless Power Tool Battery Industry Volume (K Unit) Forecast, by Application 2019 & 2032
- Table 11: Canada Cordless Power Tool Battery Industry Revenue (Million) Forecast, by Application 2019 & 2032
- Table 12: Canada Cordless Power Tool Battery Industry Volume (K Unit) Forecast, by Application 2019 & 2032
- Table 13: Mexico Cordless Power Tool Battery Industry Revenue (Million) Forecast, by Application 2019 & 2032
- Table 14: Mexico Cordless Power Tool Battery Industry Volume (K Unit) Forecast, by Application 2019 & 2032
- Table 15: Global Cordless Power Tool Battery Industry Revenue Million Forecast, by Country 2019 & 2032
- Table 16: Global Cordless Power Tool Battery Industry Volume K Unit Forecast, by Country 2019 & 2032
- Table 17: Germany Cordless Power Tool Battery Industry Revenue (Million) Forecast, by Application 2019 & 2032
- Table 18: Germany Cordless Power Tool Battery Industry Volume (K Unit) Forecast, by Application 2019 & 2032
- Table 19: United Kingdom Cordless Power Tool Battery Industry Revenue (Million) Forecast, by Application 2019 & 2032
- Table 20: United Kingdom Cordless Power Tool Battery Industry Volume (K Unit) Forecast, by Application 2019 & 2032
- Table 21: France Cordless Power Tool Battery Industry Revenue (Million) Forecast, by Application 2019 & 2032
- Table 22: France Cordless Power Tool Battery Industry Volume (K Unit) Forecast, by Application 2019 & 2032
- Table 23: Spain Cordless Power Tool Battery Industry Revenue (Million) Forecast, by Application 2019 & 2032
- Table 24: Spain Cordless Power Tool Battery Industry Volume (K Unit) Forecast, by Application 2019 & 2032
- Table 25: Italy Cordless Power Tool Battery Industry Revenue (Million) Forecast, by Application 2019 & 2032
- Table 26: Italy Cordless Power Tool Battery Industry Volume (K Unit) Forecast, by Application 2019 & 2032
- Table 27: Spain Cordless Power Tool Battery Industry Revenue (Million) Forecast, by Application 2019 & 2032
- Table 28: Spain Cordless Power Tool Battery Industry Volume (K Unit) Forecast, by Application 2019 & 2032
- Table 29: Belgium Cordless Power Tool Battery Industry Revenue (Million) Forecast, by Application 2019 & 2032
- Table 30: Belgium Cordless Power Tool Battery Industry Volume (K Unit) Forecast, by Application 2019 & 2032
- Table 31: Netherland Cordless Power Tool Battery Industry Revenue (Million) Forecast, by Application 2019 & 2032
- Table 32: Netherland Cordless Power Tool Battery Industry Volume (K Unit) Forecast, by Application 2019 & 2032
- Table 33: Nordics Cordless Power Tool Battery Industry Revenue (Million) Forecast, by Application 2019 & 2032
- Table 34: Nordics Cordless Power Tool Battery Industry Volume (K Unit) Forecast, by Application 2019 & 2032
- Table 35: Rest of Europe Cordless Power Tool Battery Industry Revenue (Million) Forecast, by Application 2019 & 2032
- Table 36: Rest of Europe Cordless Power Tool Battery Industry Volume (K Unit) Forecast, by Application 2019 & 2032
- Table 37: Global Cordless Power Tool Battery Industry Revenue Million Forecast, by Country 2019 & 2032
- Table 38: Global Cordless Power Tool Battery Industry Volume K Unit Forecast, by Country 2019 & 2032
- Table 39: China Cordless Power Tool Battery Industry Revenue (Million) Forecast, by Application 2019 & 2032
- Table 40: China Cordless Power Tool Battery Industry Volume (K Unit) Forecast, by Application 2019 & 2032
- Table 41: Japan Cordless Power Tool Battery Industry Revenue (Million) Forecast, by Application 2019 & 2032
- Table 42: Japan Cordless Power Tool Battery Industry Volume (K Unit) Forecast, by Application 2019 & 2032
- Table 43: India Cordless Power Tool Battery Industry Revenue (Million) Forecast, by Application 2019 & 2032
- Table 44: India Cordless Power Tool Battery Industry Volume (K Unit) Forecast, by Application 2019 & 2032
- Table 45: South Korea Cordless Power Tool Battery Industry Revenue (Million) Forecast, by Application 2019 & 2032
- Table 46: South Korea Cordless Power Tool Battery Industry Volume (K Unit) Forecast, by Application 2019 & 2032
- Table 47: Southeast Asia Cordless Power Tool Battery Industry Revenue (Million) Forecast, by Application 2019 & 2032
- Table 48: Southeast Asia Cordless Power Tool Battery Industry Volume (K Unit) Forecast, by Application 2019 & 2032
- Table 49: Australia Cordless Power Tool Battery Industry Revenue (Million) Forecast, by Application 2019 & 2032
- Table 50: Australia Cordless Power Tool Battery Industry Volume (K Unit) Forecast, by Application 2019 & 2032
- Table 51: Indonesia Cordless Power Tool Battery Industry Revenue (Million) Forecast, by Application 2019 & 2032
- Table 52: Indonesia Cordless Power Tool Battery Industry Volume (K Unit) Forecast, by Application 2019 & 2032
- Table 53: Phillipes Cordless Power Tool Battery Industry Revenue (Million) Forecast, by Application 2019 & 2032
- Table 54: Phillipes Cordless Power Tool Battery Industry Volume (K Unit) Forecast, by Application 2019 & 2032
- Table 55: Singapore Cordless Power Tool Battery Industry Revenue (Million) Forecast, by Application 2019 & 2032
- Table 56: Singapore Cordless Power Tool Battery Industry Volume (K Unit) Forecast, by Application 2019 & 2032
- Table 57: Thailandc Cordless Power Tool Battery Industry Revenue (Million) Forecast, by Application 2019 & 2032
- Table 58: Thailandc Cordless Power Tool Battery Industry Volume (K Unit) Forecast, by Application 2019 & 2032
- Table 59: Rest of Asia Pacific Cordless Power Tool Battery Industry Revenue (Million) Forecast, by Application 2019 & 2032
- Table 60: Rest of Asia Pacific Cordless Power Tool Battery Industry Volume (K Unit) Forecast, by Application 2019 & 2032
- Table 61: Global Cordless Power Tool Battery Industry Revenue Million Forecast, by Country 2019 & 2032
- Table 62: Global Cordless Power Tool Battery Industry Volume K Unit Forecast, by Country 2019 & 2032
- Table 63: Brazil Cordless Power Tool Battery Industry Revenue (Million) Forecast, by Application 2019 & 2032
- Table 64: Brazil Cordless Power Tool Battery Industry Volume (K Unit) Forecast, by Application 2019 & 2032
- Table 65: Argentina Cordless Power Tool Battery Industry Revenue (Million) Forecast, by Application 2019 & 2032
- Table 66: Argentina Cordless Power Tool Battery Industry Volume (K Unit) Forecast, by Application 2019 & 2032
- Table 67: Peru Cordless Power Tool Battery Industry Revenue (Million) Forecast, by Application 2019 & 2032
- Table 68: Peru Cordless Power Tool Battery Industry Volume (K Unit) Forecast, by Application 2019 & 2032
- Table 69: Chile Cordless Power Tool Battery Industry Revenue (Million) Forecast, by Application 2019 & 2032
- Table 70: Chile Cordless Power Tool Battery Industry Volume (K Unit) Forecast, by Application 2019 & 2032
- Table 71: Colombia Cordless Power Tool Battery Industry Revenue (Million) Forecast, by Application 2019 & 2032
- Table 72: Colombia Cordless Power Tool Battery Industry Volume (K Unit) Forecast, by Application 2019 & 2032
- Table 73: Ecuador Cordless Power Tool Battery Industry Revenue (Million) Forecast, by Application 2019 & 2032
- Table 74: Ecuador Cordless Power Tool Battery Industry Volume (K Unit) Forecast, by Application 2019 & 2032
- Table 75: Venezuela Cordless Power Tool Battery Industry Revenue (Million) Forecast, by Application 2019 & 2032
- Table 76: Venezuela Cordless Power Tool Battery Industry Volume (K Unit) Forecast, by Application 2019 & 2032
- Table 77: Rest of South America Cordless Power Tool Battery Industry Revenue (Million) Forecast, by Application 2019 & 2032
- Table 78: Rest of South America Cordless Power Tool Battery Industry Volume (K Unit) Forecast, by Application 2019 & 2032
- Table 79: Global Cordless Power Tool Battery Industry Revenue Million Forecast, by Country 2019 & 2032
- Table 80: Global Cordless Power Tool Battery Industry Volume K Unit Forecast, by Country 2019 & 2032
- Table 81: United States Cordless Power Tool Battery Industry Revenue (Million) Forecast, by Application 2019 & 2032
- Table 82: United States Cordless Power Tool Battery Industry Volume (K Unit) Forecast, by Application 2019 & 2032
- Table 83: Canada Cordless Power Tool Battery Industry Revenue (Million) Forecast, by Application 2019 & 2032
- Table 84: Canada Cordless Power Tool Battery Industry Volume (K Unit) Forecast, by Application 2019 & 2032
- Table 85: Mexico Cordless Power Tool Battery Industry Revenue (Million) Forecast, by Application 2019 & 2032
- Table 86: Mexico Cordless Power Tool Battery Industry Volume (K Unit) Forecast, by Application 2019 & 2032
- Table 87: Global Cordless Power Tool Battery Industry Revenue Million Forecast, by Country 2019 & 2032
- Table 88: Global Cordless Power Tool Battery Industry Volume K Unit Forecast, by Country 2019 & 2032
- Table 89: United Arab Emirates Cordless Power Tool Battery Industry Revenue (Million) Forecast, by Application 2019 & 2032
- Table 90: United Arab Emirates Cordless Power Tool Battery Industry Volume (K Unit) Forecast, by Application 2019 & 2032
- Table 91: Saudi Arabia Cordless Power Tool Battery Industry Revenue (Million) Forecast, by Application 2019 & 2032
- Table 92: Saudi Arabia Cordless Power Tool Battery Industry Volume (K Unit) Forecast, by Application 2019 & 2032
- Table 93: South Africa Cordless Power Tool Battery Industry Revenue (Million) Forecast, by Application 2019 & 2032
- Table 94: South Africa Cordless Power Tool Battery Industry Volume (K Unit) Forecast, by Application 2019 & 2032
- Table 95: Rest of Middle East and Africa Cordless Power Tool Battery Industry Revenue (Million) Forecast, by Application 2019 & 2032
- Table 96: Rest of Middle East and Africa Cordless Power Tool Battery Industry Volume (K Unit) Forecast, by Application 2019 & 2032
- Table 97: Global Cordless Power Tool Battery Industry Revenue Million Forecast, by Technology Type 2019 & 2032
- Table 98: Global Cordless Power Tool Battery Industry Volume K Unit Forecast, by Technology Type 2019 & 2032
- Table 99: Global Cordless Power Tool Battery Industry Revenue Million Forecast, by Country 2019 & 2032
- Table 100: Global Cordless Power Tool Battery Industry Volume K Unit Forecast, by Country 2019 & 2032
- Table 101: United States Cordless Power Tool Battery Industry Revenue (Million) Forecast, by Application 2019 & 2032
- Table 102: United States Cordless Power Tool Battery Industry Volume (K Unit) Forecast, by Application 2019 & 2032
- Table 103: Canada Cordless Power Tool Battery Industry Revenue (Million) Forecast, by Application 2019 & 2032
- Table 104: Canada Cordless Power Tool Battery Industry Volume (K Unit) Forecast, by Application 2019 & 2032
- Table 105: Rest of North America Cordless Power Tool Battery Industry Revenue (Million) Forecast, by Application 2019 & 2032
- Table 106: Rest of North America Cordless Power Tool Battery Industry Volume (K Unit) Forecast, by Application 2019 & 2032
- Table 107: Global Cordless Power Tool Battery Industry Revenue Million Forecast, by Technology Type 2019 & 2032
- Table 108: Global Cordless Power Tool Battery Industry Volume K Unit Forecast, by Technology Type 2019 & 2032
- Table 109: Global Cordless Power Tool Battery Industry Revenue Million Forecast, by Country 2019 & 2032
- Table 110: Global Cordless Power Tool Battery Industry Volume K Unit Forecast, by Country 2019 & 2032
- Table 111: Germany Cordless Power Tool Battery Industry Revenue (Million) Forecast, by Application 2019 & 2032
- Table 112: Germany Cordless Power Tool Battery Industry Volume (K Unit) Forecast, by Application 2019 & 2032
- Table 113: France Cordless Power Tool Battery Industry Revenue (Million) Forecast, by Application 2019 & 2032
- Table 114: France Cordless Power Tool Battery Industry Volume (K Unit) Forecast, by Application 2019 & 2032
- Table 115: United Kingdom Cordless Power Tool Battery Industry Revenue (Million) Forecast, by Application 2019 & 2032
- Table 116: United Kingdom Cordless Power Tool Battery Industry Volume (K Unit) Forecast, by Application 2019 & 2032
- Table 117: Italy Cordless Power Tool Battery Industry Revenue (Million) Forecast, by Application 2019 & 2032
- Table 118: Italy Cordless Power Tool Battery Industry Volume (K Unit) Forecast, by Application 2019 & 2032
- Table 119: Rest of Europe Cordless Power Tool Battery Industry Revenue (Million) Forecast, by Application 2019 & 2032
- Table 120: Rest of Europe Cordless Power Tool Battery Industry Volume (K Unit) Forecast, by Application 2019 & 2032
- Table 121: Global Cordless Power Tool Battery Industry Revenue Million Forecast, by Technology Type 2019 & 2032
- Table 122: Global Cordless Power Tool Battery Industry Volume K Unit Forecast, by Technology Type 2019 & 2032
- Table 123: Global Cordless Power Tool Battery Industry Revenue Million Forecast, by Country 2019 & 2032
- Table 124: Global Cordless Power Tool Battery Industry Volume K Unit Forecast, by Country 2019 & 2032
- Table 125: China Cordless Power Tool Battery Industry Revenue (Million) Forecast, by Application 2019 & 2032
- Table 126: China Cordless Power Tool Battery Industry Volume (K Unit) Forecast, by Application 2019 & 2032
- Table 127: India Cordless Power Tool Battery Industry Revenue (Million) Forecast, by Application 2019 & 2032
- Table 128: India Cordless Power Tool Battery Industry Volume (K Unit) Forecast, by Application 2019 & 2032
- Table 129: Japan Cordless Power Tool Battery Industry Revenue (Million) Forecast, by Application 2019 & 2032
- Table 130: Japan Cordless Power Tool Battery Industry Volume (K Unit) Forecast, by Application 2019 & 2032
- Table 131: Australia Cordless Power Tool Battery Industry Revenue (Million) Forecast, by Application 2019 & 2032
- Table 132: Australia Cordless Power Tool Battery Industry Volume (K Unit) Forecast, by Application 2019 & 2032
- Table 133: Rest of Asia Pacific Cordless Power Tool Battery Industry Revenue (Million) Forecast, by Application 2019 & 2032
- Table 134: Rest of Asia Pacific Cordless Power Tool Battery Industry Volume (K Unit) Forecast, by Application 2019 & 2032
- Table 135: Global Cordless Power Tool Battery Industry Revenue Million Forecast, by Technology Type 2019 & 2032
- Table 136: Global Cordless Power Tool Battery Industry Volume K Unit Forecast, by Technology Type 2019 & 2032
- Table 137: Global Cordless Power Tool Battery Industry Revenue Million Forecast, by Country 2019 & 2032
- Table 138: Global Cordless Power Tool Battery Industry Volume K Unit Forecast, by Country 2019 & 2032
- Table 139: Brazil Cordless Power Tool Battery Industry Revenue (Million) Forecast, by Application 2019 & 2032
- Table 140: Brazil Cordless Power Tool Battery Industry Volume (K Unit) Forecast, by Application 2019 & 2032
- Table 141: Argentina Cordless Power Tool Battery Industry Revenue (Million) Forecast, by Application 2019 & 2032
- Table 142: Argentina Cordless Power Tool Battery Industry Volume (K Unit) Forecast, by Application 2019 & 2032
- Table 143: Chile Cordless Power Tool Battery Industry Revenue (Million) Forecast, by Application 2019 & 2032
- Table 144: Chile Cordless Power Tool Battery Industry Volume (K Unit) Forecast, by Application 2019 & 2032
- Table 145: Rest of South America Cordless Power Tool Battery Industry Revenue (Million) Forecast, by Application 2019 & 2032
- Table 146: Rest of South America Cordless Power Tool Battery Industry Volume (K Unit) Forecast, by Application 2019 & 2032
- Table 147: Global Cordless Power Tool Battery Industry Revenue Million Forecast, by Technology Type 2019 & 2032
- Table 148: Global Cordless Power Tool Battery Industry Volume K Unit Forecast, by Technology Type 2019 & 2032
- Table 149: Global Cordless Power Tool Battery Industry Revenue Million Forecast, by Country 2019 & 2032
- Table 150: Global Cordless Power Tool Battery Industry Volume K Unit Forecast, by Country 2019 & 2032
- Table 151: United Arab Emirates Cordless Power Tool Battery Industry Revenue (Million) Forecast, by Application 2019 & 2032
- Table 152: United Arab Emirates Cordless Power Tool Battery Industry Volume (K Unit) Forecast, by Application 2019 & 2032
- Table 153: Saudi Arabia Cordless Power Tool Battery Industry Revenue (Million) Forecast, by Application 2019 & 2032
- Table 154: Saudi Arabia Cordless Power Tool Battery Industry Volume (K Unit) Forecast, by Application 2019 & 2032
- Table 155: Qatar Cordless Power Tool Battery Industry Revenue (Million) Forecast, by Application 2019 & 2032
- Table 156: Qatar Cordless Power Tool Battery Industry Volume (K Unit) Forecast, by Application 2019 & 2032
- Table 157: South Africa Cordless Power Tool Battery Industry Revenue (Million) Forecast, by Application 2019 & 2032
- Table 158: South Africa Cordless Power Tool Battery Industry Volume (K Unit) Forecast, by Application 2019 & 2032
- Table 159: Egypt Cordless Power Tool Battery Industry Revenue (Million) Forecast, by Application 2019 & 2032
- Table 160: Egypt Cordless Power Tool Battery Industry Volume (K Unit) Forecast, by Application 2019 & 2032
- Table 161: Rest of Middle East and Africa Cordless Power Tool Battery Industry Revenue (Million) Forecast, by Application 2019 & 2032
- Table 162: Rest of Middle East and Africa Cordless Power Tool Battery Industry Volume (K Unit) Forecast, by Application 2019 & 2032
Frequently Asked Questions
1. What is the projected Compound Annual Growth Rate (CAGR) of the Cordless Power Tool Battery Industry?
The projected CAGR is approximately 8.30%.
2. Which companies are prominent players in the Cordless Power Tool Battery Industry?
Key companies in the market include Ryobi Limited, Samsung SDI Co Ltd, Stanley Black & Decker Inc, Hitachi Ltd, Techtronic Industries Company Limited, Hilti Corporation*List Not Exhaustive 6 4 Market Ranking/Share (%) Analysi, Sony Group Corporation, Bosch Ltd, Panasonic Corporation, Makita Corporation.
3. What are the main segments of the Cordless Power Tool Battery Industry?
The market segments include Technology Type.
4. Can you provide details about the market size?
The market size is estimated to be USD 2.78 Million as of 2022.
5. What are some drivers contributing to market growth?
4.; Increasing Adoption Of Battery-Powered Power Tools4.; Rapidly Growing Automotive Industry.
6. What are the notable trends driving market growth?
The Lithium-ion Type is Expected to Dominate the Market.
7. Are there any restraints impacting market growth?
4.; High Cost Associated With Cordless Power Tool Equipment.
8. Can you provide examples of recent developments in the market?
In January 2023, Hilti North America, a global leader providing innovative tools, technology, software, and services to the commercial construction industry announced that in 2023 more than 30 new cordless tools will be added to its portfolio of more than 70 existing Nuron battery-powered tools.
9. What pricing options are available for accessing the report?
Pricing options include single-user, multi-user, and enterprise licenses priced at USD 4750, USD 5250, and USD 8750 respectively.
10. Is the market size provided in terms of value or volume?
The market size is provided in terms of value, measured in Million and volume, measured in K Unit.
11. Are there any specific market keywords associated with the report?
Yes, the market keyword associated with the report is "Cordless Power Tool Battery Industry," which aids in identifying and referencing the specific market segment covered.
12. How do I determine which pricing option suits my needs best?
The pricing options vary based on user requirements and access needs. Individual users may opt for single-user licenses, while businesses requiring broader access may choose multi-user or enterprise licenses for cost-effective access to the report.
13. Are there any additional resources or data provided in the Cordless Power Tool Battery Industry report?
While the report offers comprehensive insights, it's advisable to review the specific contents or supplementary materials provided to ascertain if additional resources or data are available.
14. How can I stay updated on further developments or reports in the Cordless Power Tool Battery Industry?
To stay informed about further developments, trends, and reports in the Cordless Power Tool Battery Industry, consider subscribing to industry newsletters, following relevant companies and organizations, or regularly checking reputable industry news sources and publications.
Methodology
Step 1 - Identification of Relevant Samples Size from Population Database


Step 2 - Approaches for Defining Global Market Size (Value, Volume* & Price*)

Note*: In applicable scenarios
Step 3 - Data Sources
Primary Research
- Web Analytics
- Survey Reports
- Research Institute
- Latest Research Reports
- Opinion Leaders
Secondary Research
- Annual Reports
- White Paper
- Latest Press Release
- Industry Association
- Paid Database
- Investor Presentations

Step 4 - Data Triangulation
Involves using different sources of information in order to increase the validity of a study
These sources are likely to be stakeholders in a program - participants, other researchers, program staff, other community members, and so on.
Then we put all data in single framework & apply various statistical tools to find out the dynamic on the market.
During the analysis stage, feedback from the stakeholder groups would be compared to determine areas of agreement as well as areas of divergence


