
Key Insights
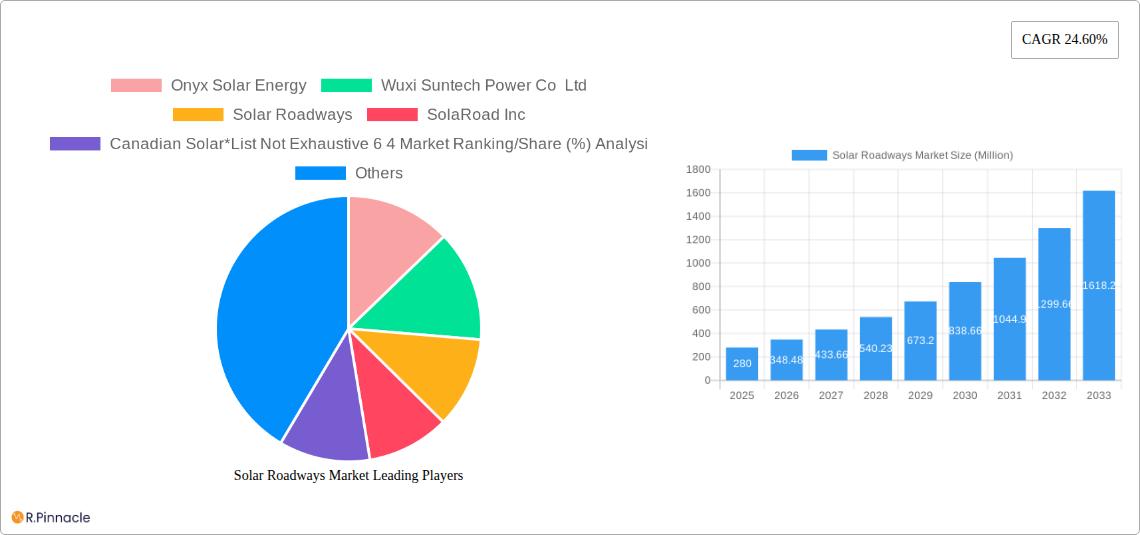
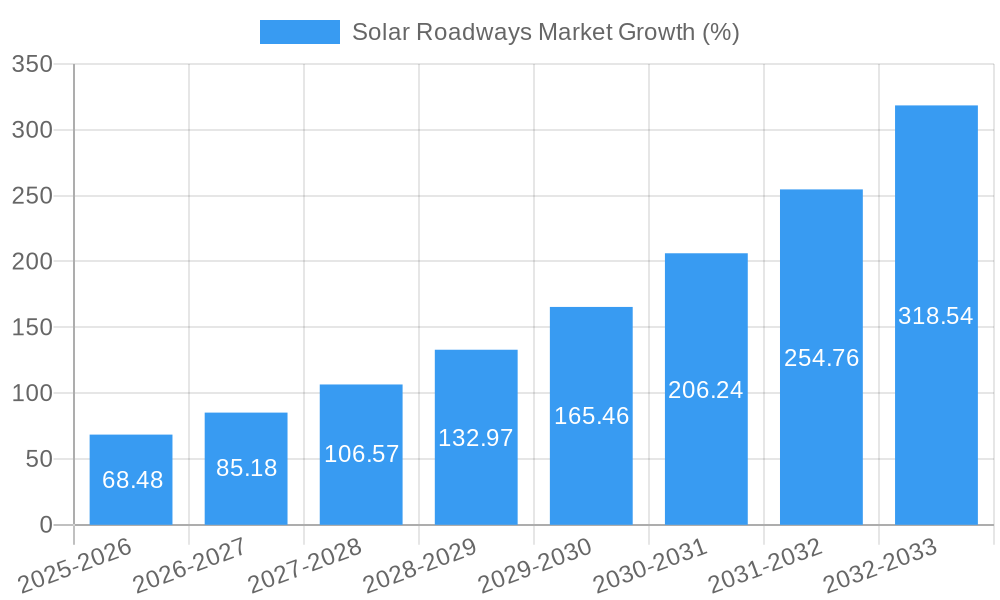
The solar roadways market, currently valued at $280 million in 2025, is experiencing robust growth, projected to expand at a Compound Annual Growth Rate (CAGR) of 24.60% from 2025 to 2033. This surge is driven by several key factors. Firstly, increasing concerns about climate change and the urgent need for sustainable energy solutions are pushing governments and private entities to explore innovative renewable energy technologies. Solar roadways, offering a unique blend of energy generation and infrastructure improvement, directly address these concerns. Secondly, advancements in photovoltaic (PV) technology, particularly in the efficiency and durability of monocrystalline and polycrystalline silicon cells, are making solar roadways more cost-effective and reliable. Finally, supportive government policies, including subsidies and tax incentives aimed at promoting renewable energy adoption, are further accelerating market growth. Key applications like driveways and parking lots are witnessing significant traction, with monocrystalline silicon emerging as the preferred material due to its higher efficiency. Leading companies such as Onyx Solar Energy, Wuxi Suntech Power Co Ltd, and Solar Roadways are spearheading innovation and market expansion through R&D and strategic partnerships.
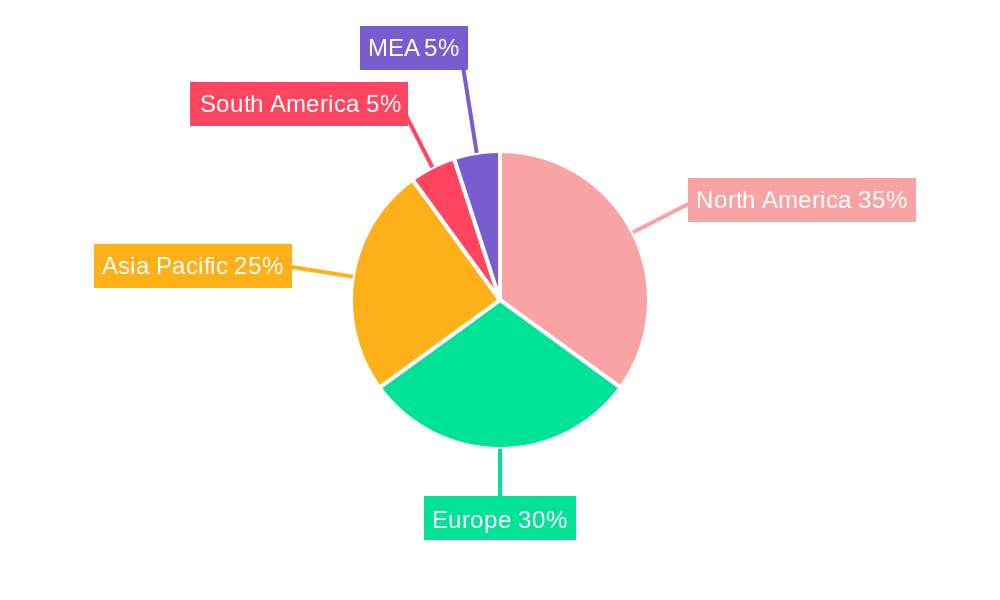
The market segmentation reveals a strong focus on North America and Europe, driven by early adoption and significant investments in sustainable infrastructure projects. However, Asia Pacific holds substantial growth potential, given its rapid urbanization and expanding renewable energy sector. While the initial high installation costs and challenges related to durability and maintenance pose certain restraints, ongoing technological advancements and economies of scale are mitigating these challenges. The competitive landscape is characterized by a mix of established solar companies diversifying into this niche market and specialized startups focusing solely on solar roadways. This dynamic interplay is fueling innovation and ensuring a competitive pricing structure, contributing to wider market adoption and expansion in the coming years. The future trajectory suggests that solar roadways will progressively integrate with smart city initiatives, leveraging technological advancements in energy storage and management to enhance grid stability and overall efficiency.
Solar Roadways Market Report: 2019-2033 Forecast
This comprehensive report provides a detailed analysis of the Solar Roadways Market, offering invaluable insights for industry professionals, investors, and strategic decision-makers. Covering the period 2019-2033, with a focus on 2025, this report unravels the market's structure, dynamics, and future potential, incorporating both historical data and forward-looking projections. The study period is 2019–2033, with 2025 as the base and estimated year. The forecast period is 2025–2033 and the historical period is 2019–2024.
Solar Roadways Market Market Structure & Innovation Trends
This section analyzes the competitive landscape of the Solar Roadways market, assessing market concentration, key innovation drivers, regulatory frameworks, and the impact of product substitutes. We examine end-user demographics and M&A activities, providing insights into market share and deal values. The market is moderately concentrated, with key players like Onyx Solar Energy, Wuxi Suntech Power Co Ltd, Solar Roadways, SolaRoad Inc, and Canadian Solar holding significant shares (xx%). However, smaller companies are entering the market, driving innovation and competition.
- Market Concentration: xx%
- Innovation Drivers: Government incentives, technological advancements (e.g., increased efficiency, durability), and growing environmental concerns.
- Regulatory Frameworks: Vary across regions, impacting market growth and adoption rates.
- Product Substitutes: Traditional asphalt and concrete remain major competitors.
- End-User Demographics: Primarily government agencies, municipalities, and private companies involved in infrastructure development.
- M&A Activities: While specific deal values are unavailable (xx Million), consolidation is expected to increase in the coming years, potentially leading to increased market concentration.
Solar Roadways Market Market Dynamics & Trends
The Solar Roadways market is experiencing significant growth, driven by increasing energy demand, rising environmental awareness, and supportive government policies. Technological advancements, including improved efficiency and durability of solar panels, are further fueling market expansion. Consumer preferences are shifting towards sustainable infrastructure solutions, creating a favorable environment for solar roadways. Competitive dynamics are intense, with companies focusing on innovation, cost reduction, and strategic partnerships to gain market share. The Compound Annual Growth Rate (CAGR) is projected at xx% during the forecast period, with market penetration reaching xx% by 2033.
Dominant Regions & Segments in Solar Roadways Market
The [Region Name, e.g., North America] region currently dominates the Solar Roadways market, driven by strong government support, advanced infrastructure, and high adoption rates. Within the Materials segment, Monocrystalline Silicon holds a larger market share than Polycrystalline Silicon due to its higher efficiency. In terms of applications, Parking Lots currently holds a larger market share than Driveways, primarily due to higher potential energy generation.
- Key Drivers in [Dominant Region]:
- Favorable government policies and incentives.
- Robust infrastructure development.
- High consumer awareness of environmental concerns.
- Dominance Analysis: This region's early adoption of solar roadways technologies, coupled with supportive policies, creates a competitive advantage, attracting significant investments and technological advancement.
Solar Roadways Market Product Innovations
Recent innovations focus on increasing the efficiency and durability of solar panels specifically designed for roadways. Improved integration techniques and materials reduce installation costs and maintenance requirements. Companies are also exploring the integration of energy storage systems within solar roadways, enhancing their performance and reliability. These innovations are improving the market fit by addressing durability and cost concerns associated with earlier generations of the technology.
Report Scope & Segmentation Analysis
The report segments the Solar Roadways Market by Material (Monocrystalline Silicon, Polycrystalline Silicon) and Application (Driveways, Parking Lots). The Monocrystalline Silicon segment is projected to witness faster growth due to its higher efficiency. The Parking Lots application segment is expected to dominate due to larger surface areas and potential energy generation. Competitive dynamics vary across segments, with varying levels of competition and innovation.
Key Drivers of Solar Roadways Market Growth
Several factors are driving the growth of the Solar Roadways market. These include increasing government incentives and subsidies promoting renewable energy adoption, rising environmental awareness and the need for sustainable infrastructure solutions, technological advancements leading to increased efficiency and durability of solar panels, and growing urbanization and infrastructure development projects. Cost reductions through economies of scale also contribute significantly.
Challenges in the Solar Roadways Market Sector
Challenges include high initial investment costs, durability concerns in harsh weather conditions, potential maintenance issues related to traffic loads, and the lack of standardized regulations and testing procedures. Supply chain disruptions and dependence on raw material prices also pose significant challenges. These factors can collectively impact market growth by delaying adoption and increasing overall project costs (quantifiable impact: xx Million in lost revenue potential).
Emerging Opportunities in Solar Roadways Market
Emerging opportunities exist in integrating smart sensors and energy storage systems within solar roadways, creating opportunities in the Internet of Things (IoT) and smart city initiatives. Expanding into developing economies presents significant potential, along with exploring new applications such as pedestrian walkways and bicycle paths.
Leading Players in the Solar Roadways Market Market
- Onyx Solar Energy
- Wuxi Suntech Power Co Ltd
- Solar Roadways
- SolaRoad Inc
- Canadian Solar
- Wattway
- Colas Group
- PLATIO Solar
Key Developments in Solar Roadways Market Industry
- May 2023: The Dutch province of North Brabant initiated a 500-meter solar cycle path project, integrating solar panels into the asphalt. This project aims to assess the durability and efficiency of solar panels under pedestrian and bicycle traffic, providing valuable insights into long-term performance and maintenance costs.
Future Outlook for Solar Roadways Market Market
The Solar Roadways market is poised for substantial growth, driven by continuous technological advancements, supportive government policies, and increasing environmental concerns. Strategic partnerships and collaborations will further enhance market expansion. Focusing on innovation, cost reduction, and addressing durability challenges will unlock greater market potential and drive future growth.
Solar Roadways Market Segmentation
-
1. Materials
- 1.1. Monocrystalline Silicon
- 1.2. Polycrystalline Silicon
-
2. Applications
- 2.1. Driveways
- 2.2. Parking Lots
Solar Roadways Market Segmentation By Geography
-
1. North America
- 1.1. United States
- 1.2. Canada
- 1.3. Rest of North America
-
2. Europe
- 2.1. Germany
- 2.2. France
- 2.3. United Kingdom
- 2.4. Italy
- 2.5. Spain
- 2.6. NORDIC
- 2.7. Turkey
- 2.8. Russia
- 2.9. Rest of Europe
-
3. Asia Pacific
- 3.1. China
- 3.2. India
- 3.3. Japan
- 3.4. Malaysia
- 3.5. Thailand
- 3.6. Indonesia
- 3.7. Vietnam
- 3.8. Rest of Asia Pacific
-
4. Middle East and Africa
- 4.1. Saudi Arabia
- 4.2. United Arab Emirates
- 4.3. South Africa
- 4.4. Qatar
- 4.5. Egypt
- 4.6. Nigeria
- 4.7. Rest of Middle East and Africa
-
5. South America
- 5.1. Brazil
- 5.2. Argentina
- 5.3. Colombia
- 5.4. Rest of South America
Solar Roadways Market REPORT HIGHLIGHTS
| Aspects | Details |
|---|---|
| Study Period | 2019-2033 |
| Base Year | 2024 |
| Estimated Year | 2025 |
| Forecast Period | 2025-2033 |
| Historical Period | 2019-2024 |
| Growth Rate | CAGR of 24.60% from 2019-2033 |
| Segmentation |
|
Table of Contents
- 1. Introduction
- 1.1. Research Scope
- 1.2. Market Segmentation
- 1.3. Research Methodology
- 1.4. Definitions and Assumptions
- 2. Executive Summary
- 2.1. Introduction
- 3. Market Dynamics
- 3.1. Introduction
- 3.2. Market Drivers
- 3.2.1. 4.; Growing Adoption of Renewable Energy4.; Efforts in Sustainable Infrastructure to Reduce Carbon Footprints
- 3.3. Market Restrains
- 3.3.1. 4.; High Initial Cost Associated With Developing the Infrastructure
- 3.4. Market Trends
- 3.4.1. The Driveways Segment is Expected to Witness Significant Growth
- 4. Market Factor Analysis
- 4.1. Porters Five Forces
- 4.2. Supply/Value Chain
- 4.3. PESTEL analysis
- 4.4. Market Entropy
- 4.5. Patent/Trademark Analysis
- 5. Global Solar Roadways Market Analysis, Insights and Forecast, 2019-2031
- 5.1. Market Analysis, Insights and Forecast - by Materials
- 5.1.1. Monocrystalline Silicon
- 5.1.2. Polycrystalline Silicon
- 5.2. Market Analysis, Insights and Forecast - by Applications
- 5.2.1. Driveways
- 5.2.2. Parking Lots
- 5.3. Market Analysis, Insights and Forecast - by Region
- 5.3.1. North America
- 5.3.2. Europe
- 5.3.3. Asia Pacific
- 5.3.4. Middle East and Africa
- 5.3.5. South America
- 5.1. Market Analysis, Insights and Forecast - by Materials
- 6. North America Solar Roadways Market Analysis, Insights and Forecast, 2019-2031
- 6.1. Market Analysis, Insights and Forecast - by Materials
- 6.1.1. Monocrystalline Silicon
- 6.1.2. Polycrystalline Silicon
- 6.2. Market Analysis, Insights and Forecast - by Applications
- 6.2.1. Driveways
- 6.2.2. Parking Lots
- 6.1. Market Analysis, Insights and Forecast - by Materials
- 7. Europe Solar Roadways Market Analysis, Insights and Forecast, 2019-2031
- 7.1. Market Analysis, Insights and Forecast - by Materials
- 7.1.1. Monocrystalline Silicon
- 7.1.2. Polycrystalline Silicon
- 7.2. Market Analysis, Insights and Forecast - by Applications
- 7.2.1. Driveways
- 7.2.2. Parking Lots
- 7.1. Market Analysis, Insights and Forecast - by Materials
- 8. Asia Pacific Solar Roadways Market Analysis, Insights and Forecast, 2019-2031
- 8.1. Market Analysis, Insights and Forecast - by Materials
- 8.1.1. Monocrystalline Silicon
- 8.1.2. Polycrystalline Silicon
- 8.2. Market Analysis, Insights and Forecast - by Applications
- 8.2.1. Driveways
- 8.2.2. Parking Lots
- 8.1. Market Analysis, Insights and Forecast - by Materials
- 9. Middle East and Africa Solar Roadways Market Analysis, Insights and Forecast, 2019-2031
- 9.1. Market Analysis, Insights and Forecast - by Materials
- 9.1.1. Monocrystalline Silicon
- 9.1.2. Polycrystalline Silicon
- 9.2. Market Analysis, Insights and Forecast - by Applications
- 9.2.1. Driveways
- 9.2.2. Parking Lots
- 9.1. Market Analysis, Insights and Forecast - by Materials
- 10. South America Solar Roadways Market Analysis, Insights and Forecast, 2019-2031
- 10.1. Market Analysis, Insights and Forecast - by Materials
- 10.1.1. Monocrystalline Silicon
- 10.1.2. Polycrystalline Silicon
- 10.2. Market Analysis, Insights and Forecast - by Applications
- 10.2.1. Driveways
- 10.2.2. Parking Lots
- 10.1. Market Analysis, Insights and Forecast - by Materials
- 11. North America Solar Roadways Market Analysis, Insights and Forecast, 2019-2031
- 11.1. Market Analysis, Insights and Forecast - By Country/Sub-region
- 11.1.1 United States
- 11.1.2 Canada
- 11.1.3 Mexico
- 12. Europe Solar Roadways Market Analysis, Insights and Forecast, 2019-2031
- 12.1. Market Analysis, Insights and Forecast - By Country/Sub-region
- 12.1.1 Germany
- 12.1.2 United Kingdom
- 12.1.3 France
- 12.1.4 Spain
- 12.1.5 Italy
- 12.1.6 Spain
- 12.1.7 Belgium
- 12.1.8 Netherland
- 12.1.9 Nordics
- 12.1.10 Rest of Europe
- 13. Asia Pacific Solar Roadways Market Analysis, Insights and Forecast, 2019-2031
- 13.1. Market Analysis, Insights and Forecast - By Country/Sub-region
- 13.1.1 China
- 13.1.2 Japan
- 13.1.3 India
- 13.1.4 South Korea
- 13.1.5 Southeast Asia
- 13.1.6 Australia
- 13.1.7 Indonesia
- 13.1.8 Phillipes
- 13.1.9 Singapore
- 13.1.10 Thailandc
- 13.1.11 Rest of Asia Pacific
- 14. South America Solar Roadways Market Analysis, Insights and Forecast, 2019-2031
- 14.1. Market Analysis, Insights and Forecast - By Country/Sub-region
- 14.1.1 Brazil
- 14.1.2 Argentina
- 14.1.3 Peru
- 14.1.4 Chile
- 14.1.5 Colombia
- 14.1.6 Ecuador
- 14.1.7 Venezuela
- 14.1.8 Rest of South America
- 15. North America Solar Roadways Market Analysis, Insights and Forecast, 2019-2031
- 15.1. Market Analysis, Insights and Forecast - By Country/Sub-region
- 15.1.1 United States
- 15.1.2 Canada
- 15.1.3 Mexico
- 16. MEA Solar Roadways Market Analysis, Insights and Forecast, 2019-2031
- 16.1. Market Analysis, Insights and Forecast - By Country/Sub-region
- 16.1.1 United Arab Emirates
- 16.1.2 Saudi Arabia
- 16.1.3 South Africa
- 16.1.4 Rest of Middle East and Africa
- 17. Competitive Analysis
- 17.1. Global Market Share Analysis 2024
- 17.2. Company Profiles
- 17.2.1 Onyx Solar Energy
- 17.2.1.1. Overview
- 17.2.1.2. Products
- 17.2.1.3. SWOT Analysis
- 17.2.1.4. Recent Developments
- 17.2.1.5. Financials (Based on Availability)
- 17.2.2 Wuxi Suntech Power Co Ltd
- 17.2.2.1. Overview
- 17.2.2.2. Products
- 17.2.2.3. SWOT Analysis
- 17.2.2.4. Recent Developments
- 17.2.2.5. Financials (Based on Availability)
- 17.2.3 Solar Roadways
- 17.2.3.1. Overview
- 17.2.3.2. Products
- 17.2.3.3. SWOT Analysis
- 17.2.3.4. Recent Developments
- 17.2.3.5. Financials (Based on Availability)
- 17.2.4 SolaRoad Inc
- 17.2.4.1. Overview
- 17.2.4.2. Products
- 17.2.4.3. SWOT Analysis
- 17.2.4.4. Recent Developments
- 17.2.4.5. Financials (Based on Availability)
- 17.2.5 Canadian Solar*List Not Exhaustive 6 4 Market Ranking/Share (%) Analysi
- 17.2.5.1. Overview
- 17.2.5.2. Products
- 17.2.5.3. SWOT Analysis
- 17.2.5.4. Recent Developments
- 17.2.5.5. Financials (Based on Availability)
- 17.2.6 Wattway
- 17.2.6.1. Overview
- 17.2.6.2. Products
- 17.2.6.3. SWOT Analysis
- 17.2.6.4. Recent Developments
- 17.2.6.5. Financials (Based on Availability)
- 17.2.7 Colas Group
- 17.2.7.1. Overview
- 17.2.7.2. Products
- 17.2.7.3. SWOT Analysis
- 17.2.7.4. Recent Developments
- 17.2.7.5. Financials (Based on Availability)
- 17.2.8 PLATIO Solar
- 17.2.8.1. Overview
- 17.2.8.2. Products
- 17.2.8.3. SWOT Analysis
- 17.2.8.4. Recent Developments
- 17.2.8.5. Financials (Based on Availability)
- 17.2.1 Onyx Solar Energy
List of Figures
- Figure 1: Global Solar Roadways Market Revenue Breakdown (Million, %) by Region 2024 & 2032
- Figure 2: North America Solar Roadways Market Revenue (Million), by Country 2024 & 2032
- Figure 3: North America Solar Roadways Market Revenue Share (%), by Country 2024 & 2032
- Figure 4: Europe Solar Roadways Market Revenue (Million), by Country 2024 & 2032
- Figure 5: Europe Solar Roadways Market Revenue Share (%), by Country 2024 & 2032
- Figure 6: Asia Pacific Solar Roadways Market Revenue (Million), by Country 2024 & 2032
- Figure 7: Asia Pacific Solar Roadways Market Revenue Share (%), by Country 2024 & 2032
- Figure 8: South America Solar Roadways Market Revenue (Million), by Country 2024 & 2032
- Figure 9: South America Solar Roadways Market Revenue Share (%), by Country 2024 & 2032
- Figure 10: North America Solar Roadways Market Revenue (Million), by Country 2024 & 2032
- Figure 11: North America Solar Roadways Market Revenue Share (%), by Country 2024 & 2032
- Figure 12: MEA Solar Roadways Market Revenue (Million), by Country 2024 & 2032
- Figure 13: MEA Solar Roadways Market Revenue Share (%), by Country 2024 & 2032
- Figure 14: North America Solar Roadways Market Revenue (Million), by Materials 2024 & 2032
- Figure 15: North America Solar Roadways Market Revenue Share (%), by Materials 2024 & 2032
- Figure 16: North America Solar Roadways Market Revenue (Million), by Applications 2024 & 2032
- Figure 17: North America Solar Roadways Market Revenue Share (%), by Applications 2024 & 2032
- Figure 18: North America Solar Roadways Market Revenue (Million), by Country 2024 & 2032
- Figure 19: North America Solar Roadways Market Revenue Share (%), by Country 2024 & 2032
- Figure 20: Europe Solar Roadways Market Revenue (Million), by Materials 2024 & 2032
- Figure 21: Europe Solar Roadways Market Revenue Share (%), by Materials 2024 & 2032
- Figure 22: Europe Solar Roadways Market Revenue (Million), by Applications 2024 & 2032
- Figure 23: Europe Solar Roadways Market Revenue Share (%), by Applications 2024 & 2032
- Figure 24: Europe Solar Roadways Market Revenue (Million), by Country 2024 & 2032
- Figure 25: Europe Solar Roadways Market Revenue Share (%), by Country 2024 & 2032
- Figure 26: Asia Pacific Solar Roadways Market Revenue (Million), by Materials 2024 & 2032
- Figure 27: Asia Pacific Solar Roadways Market Revenue Share (%), by Materials 2024 & 2032
- Figure 28: Asia Pacific Solar Roadways Market Revenue (Million), by Applications 2024 & 2032
- Figure 29: Asia Pacific Solar Roadways Market Revenue Share (%), by Applications 2024 & 2032
- Figure 30: Asia Pacific Solar Roadways Market Revenue (Million), by Country 2024 & 2032
- Figure 31: Asia Pacific Solar Roadways Market Revenue Share (%), by Country 2024 & 2032
- Figure 32: Middle East and Africa Solar Roadways Market Revenue (Million), by Materials 2024 & 2032
- Figure 33: Middle East and Africa Solar Roadways Market Revenue Share (%), by Materials 2024 & 2032
- Figure 34: Middle East and Africa Solar Roadways Market Revenue (Million), by Applications 2024 & 2032
- Figure 35: Middle East and Africa Solar Roadways Market Revenue Share (%), by Applications 2024 & 2032
- Figure 36: Middle East and Africa Solar Roadways Market Revenue (Million), by Country 2024 & 2032
- Figure 37: Middle East and Africa Solar Roadways Market Revenue Share (%), by Country 2024 & 2032
- Figure 38: South America Solar Roadways Market Revenue (Million), by Materials 2024 & 2032
- Figure 39: South America Solar Roadways Market Revenue Share (%), by Materials 2024 & 2032
- Figure 40: South America Solar Roadways Market Revenue (Million), by Applications 2024 & 2032
- Figure 41: South America Solar Roadways Market Revenue Share (%), by Applications 2024 & 2032
- Figure 42: South America Solar Roadways Market Revenue (Million), by Country 2024 & 2032
- Figure 43: South America Solar Roadways Market Revenue Share (%), by Country 2024 & 2032
List of Tables
- Table 1: Global Solar Roadways Market Revenue Million Forecast, by Region 2019 & 2032
- Table 2: Global Solar Roadways Market Revenue Million Forecast, by Materials 2019 & 2032
- Table 3: Global Solar Roadways Market Revenue Million Forecast, by Applications 2019 & 2032
- Table 4: Global Solar Roadways Market Revenue Million Forecast, by Region 2019 & 2032
- Table 5: Global Solar Roadways Market Revenue Million Forecast, by Country 2019 & 2032
- Table 6: United States Solar Roadways Market Revenue (Million) Forecast, by Application 2019 & 2032
- Table 7: Canada Solar Roadways Market Revenue (Million) Forecast, by Application 2019 & 2032
- Table 8: Mexico Solar Roadways Market Revenue (Million) Forecast, by Application 2019 & 2032
- Table 9: Global Solar Roadways Market Revenue Million Forecast, by Country 2019 & 2032
- Table 10: Germany Solar Roadways Market Revenue (Million) Forecast, by Application 2019 & 2032
- Table 11: United Kingdom Solar Roadways Market Revenue (Million) Forecast, by Application 2019 & 2032
- Table 12: France Solar Roadways Market Revenue (Million) Forecast, by Application 2019 & 2032
- Table 13: Spain Solar Roadways Market Revenue (Million) Forecast, by Application 2019 & 2032
- Table 14: Italy Solar Roadways Market Revenue (Million) Forecast, by Application 2019 & 2032
- Table 15: Spain Solar Roadways Market Revenue (Million) Forecast, by Application 2019 & 2032
- Table 16: Belgium Solar Roadways Market Revenue (Million) Forecast, by Application 2019 & 2032
- Table 17: Netherland Solar Roadways Market Revenue (Million) Forecast, by Application 2019 & 2032
- Table 18: Nordics Solar Roadways Market Revenue (Million) Forecast, by Application 2019 & 2032
- Table 19: Rest of Europe Solar Roadways Market Revenue (Million) Forecast, by Application 2019 & 2032
- Table 20: Global Solar Roadways Market Revenue Million Forecast, by Country 2019 & 2032
- Table 21: China Solar Roadways Market Revenue (Million) Forecast, by Application 2019 & 2032
- Table 22: Japan Solar Roadways Market Revenue (Million) Forecast, by Application 2019 & 2032
- Table 23: India Solar Roadways Market Revenue (Million) Forecast, by Application 2019 & 2032
- Table 24: South Korea Solar Roadways Market Revenue (Million) Forecast, by Application 2019 & 2032
- Table 25: Southeast Asia Solar Roadways Market Revenue (Million) Forecast, by Application 2019 & 2032
- Table 26: Australia Solar Roadways Market Revenue (Million) Forecast, by Application 2019 & 2032
- Table 27: Indonesia Solar Roadways Market Revenue (Million) Forecast, by Application 2019 & 2032
- Table 28: Phillipes Solar Roadways Market Revenue (Million) Forecast, by Application 2019 & 2032
- Table 29: Singapore Solar Roadways Market Revenue (Million) Forecast, by Application 2019 & 2032
- Table 30: Thailandc Solar Roadways Market Revenue (Million) Forecast, by Application 2019 & 2032
- Table 31: Rest of Asia Pacific Solar Roadways Market Revenue (Million) Forecast, by Application 2019 & 2032
- Table 32: Global Solar Roadways Market Revenue Million Forecast, by Country 2019 & 2032
- Table 33: Brazil Solar Roadways Market Revenue (Million) Forecast, by Application 2019 & 2032
- Table 34: Argentina Solar Roadways Market Revenue (Million) Forecast, by Application 2019 & 2032
- Table 35: Peru Solar Roadways Market Revenue (Million) Forecast, by Application 2019 & 2032
- Table 36: Chile Solar Roadways Market Revenue (Million) Forecast, by Application 2019 & 2032
- Table 37: Colombia Solar Roadways Market Revenue (Million) Forecast, by Application 2019 & 2032
- Table 38: Ecuador Solar Roadways Market Revenue (Million) Forecast, by Application 2019 & 2032
- Table 39: Venezuela Solar Roadways Market Revenue (Million) Forecast, by Application 2019 & 2032
- Table 40: Rest of South America Solar Roadways Market Revenue (Million) Forecast, by Application 2019 & 2032
- Table 41: Global Solar Roadways Market Revenue Million Forecast, by Country 2019 & 2032
- Table 42: United States Solar Roadways Market Revenue (Million) Forecast, by Application 2019 & 2032
- Table 43: Canada Solar Roadways Market Revenue (Million) Forecast, by Application 2019 & 2032
- Table 44: Mexico Solar Roadways Market Revenue (Million) Forecast, by Application 2019 & 2032
- Table 45: Global Solar Roadways Market Revenue Million Forecast, by Country 2019 & 2032
- Table 46: United Arab Emirates Solar Roadways Market Revenue (Million) Forecast, by Application 2019 & 2032
- Table 47: Saudi Arabia Solar Roadways Market Revenue (Million) Forecast, by Application 2019 & 2032
- Table 48: South Africa Solar Roadways Market Revenue (Million) Forecast, by Application 2019 & 2032
- Table 49: Rest of Middle East and Africa Solar Roadways Market Revenue (Million) Forecast, by Application 2019 & 2032
- Table 50: Global Solar Roadways Market Revenue Million Forecast, by Materials 2019 & 2032
- Table 51: Global Solar Roadways Market Revenue Million Forecast, by Applications 2019 & 2032
- Table 52: Global Solar Roadways Market Revenue Million Forecast, by Country 2019 & 2032
- Table 53: United States Solar Roadways Market Revenue (Million) Forecast, by Application 2019 & 2032
- Table 54: Canada Solar Roadways Market Revenue (Million) Forecast, by Application 2019 & 2032
- Table 55: Rest of North America Solar Roadways Market Revenue (Million) Forecast, by Application 2019 & 2032
- Table 56: Global Solar Roadways Market Revenue Million Forecast, by Materials 2019 & 2032
- Table 57: Global Solar Roadways Market Revenue Million Forecast, by Applications 2019 & 2032
- Table 58: Global Solar Roadways Market Revenue Million Forecast, by Country 2019 & 2032
- Table 59: Germany Solar Roadways Market Revenue (Million) Forecast, by Application 2019 & 2032
- Table 60: France Solar Roadways Market Revenue (Million) Forecast, by Application 2019 & 2032
- Table 61: United Kingdom Solar Roadways Market Revenue (Million) Forecast, by Application 2019 & 2032
- Table 62: Italy Solar Roadways Market Revenue (Million) Forecast, by Application 2019 & 2032
- Table 63: Spain Solar Roadways Market Revenue (Million) Forecast, by Application 2019 & 2032
- Table 64: NORDIC Solar Roadways Market Revenue (Million) Forecast, by Application 2019 & 2032
- Table 65: Turkey Solar Roadways Market Revenue (Million) Forecast, by Application 2019 & 2032
- Table 66: Russia Solar Roadways Market Revenue (Million) Forecast, by Application 2019 & 2032
- Table 67: Rest of Europe Solar Roadways Market Revenue (Million) Forecast, by Application 2019 & 2032
- Table 68: Global Solar Roadways Market Revenue Million Forecast, by Materials 2019 & 2032
- Table 69: Global Solar Roadways Market Revenue Million Forecast, by Applications 2019 & 2032
- Table 70: Global Solar Roadways Market Revenue Million Forecast, by Country 2019 & 2032
- Table 71: China Solar Roadways Market Revenue (Million) Forecast, by Application 2019 & 2032
- Table 72: India Solar Roadways Market Revenue (Million) Forecast, by Application 2019 & 2032
- Table 73: Japan Solar Roadways Market Revenue (Million) Forecast, by Application 2019 & 2032
- Table 74: Malaysia Solar Roadways Market Revenue (Million) Forecast, by Application 2019 & 2032
- Table 75: Thailand Solar Roadways Market Revenue (Million) Forecast, by Application 2019 & 2032
- Table 76: Indonesia Solar Roadways Market Revenue (Million) Forecast, by Application 2019 & 2032
- Table 77: Vietnam Solar Roadways Market Revenue (Million) Forecast, by Application 2019 & 2032
- Table 78: Rest of Asia Pacific Solar Roadways Market Revenue (Million) Forecast, by Application 2019 & 2032
- Table 79: Global Solar Roadways Market Revenue Million Forecast, by Materials 2019 & 2032
- Table 80: Global Solar Roadways Market Revenue Million Forecast, by Applications 2019 & 2032
- Table 81: Global Solar Roadways Market Revenue Million Forecast, by Country 2019 & 2032
- Table 82: Saudi Arabia Solar Roadways Market Revenue (Million) Forecast, by Application 2019 & 2032
- Table 83: United Arab Emirates Solar Roadways Market Revenue (Million) Forecast, by Application 2019 & 2032
- Table 84: South Africa Solar Roadways Market Revenue (Million) Forecast, by Application 2019 & 2032
- Table 85: Qatar Solar Roadways Market Revenue (Million) Forecast, by Application 2019 & 2032
- Table 86: Egypt Solar Roadways Market Revenue (Million) Forecast, by Application 2019 & 2032
- Table 87: Nigeria Solar Roadways Market Revenue (Million) Forecast, by Application 2019 & 2032
- Table 88: Rest of Middle East and Africa Solar Roadways Market Revenue (Million) Forecast, by Application 2019 & 2032
- Table 89: Global Solar Roadways Market Revenue Million Forecast, by Materials 2019 & 2032
- Table 90: Global Solar Roadways Market Revenue Million Forecast, by Applications 2019 & 2032
- Table 91: Global Solar Roadways Market Revenue Million Forecast, by Country 2019 & 2032
- Table 92: Brazil Solar Roadways Market Revenue (Million) Forecast, by Application 2019 & 2032
- Table 93: Argentina Solar Roadways Market Revenue (Million) Forecast, by Application 2019 & 2032
- Table 94: Colombia Solar Roadways Market Revenue (Million) Forecast, by Application 2019 & 2032
- Table 95: Rest of South America Solar Roadways Market Revenue (Million) Forecast, by Application 2019 & 2032
Frequently Asked Questions
1. What is the projected Compound Annual Growth Rate (CAGR) of the Solar Roadways Market?
The projected CAGR is approximately 24.60%.
2. Which companies are prominent players in the Solar Roadways Market?
Key companies in the market include Onyx Solar Energy, Wuxi Suntech Power Co Ltd, Solar Roadways, SolaRoad Inc, Canadian Solar*List Not Exhaustive 6 4 Market Ranking/Share (%) Analysi, Wattway, Colas Group, PLATIO Solar.
3. What are the main segments of the Solar Roadways Market?
The market segments include Materials, Applications.
4. Can you provide details about the market size?
The market size is estimated to be USD 280 Million as of 2022.
5. What are some drivers contributing to market growth?
4.; Growing Adoption of Renewable Energy4.; Efforts in Sustainable Infrastructure to Reduce Carbon Footprints.
6. What are the notable trends driving market growth?
The Driveways Segment is Expected to Witness Significant Growth.
7. Are there any restraints impacting market growth?
4.; High Initial Cost Associated With Developing the Infrastructure.
8. Can you provide examples of recent developments in the market?
May 2023: The Dutch province of North Brabant started constructing a 500-meter-long ground-mounted solar cycle path along the provincial N285 road near Wagenberg. The PV system will be integrated into the asphalt top layer and comprise 600 unspecified solar panels. As per the government, the project is mainly intended to gain experience deploying solar cells on bicycle paths. During five years, government experts will assess the resistance of the solar modules to the mechanical stress applied by the presence of pedestrians and bikers, the costs for their maintenance, and the PV system energy yield.
9. What pricing options are available for accessing the report?
Pricing options include single-user, multi-user, and enterprise licenses priced at USD 4750, USD 5250, and USD 8750 respectively.
10. Is the market size provided in terms of value or volume?
The market size is provided in terms of value, measured in Million.
11. Are there any specific market keywords associated with the report?
Yes, the market keyword associated with the report is "Solar Roadways Market," which aids in identifying and referencing the specific market segment covered.
12. How do I determine which pricing option suits my needs best?
The pricing options vary based on user requirements and access needs. Individual users may opt for single-user licenses, while businesses requiring broader access may choose multi-user or enterprise licenses for cost-effective access to the report.
13. Are there any additional resources or data provided in the Solar Roadways Market report?
While the report offers comprehensive insights, it's advisable to review the specific contents or supplementary materials provided to ascertain if additional resources or data are available.
14. How can I stay updated on further developments or reports in the Solar Roadways Market?
To stay informed about further developments, trends, and reports in the Solar Roadways Market, consider subscribing to industry newsletters, following relevant companies and organizations, or regularly checking reputable industry news sources and publications.
Methodology
Step 1 - Identification of Relevant Samples Size from Population Database


Step 2 - Approaches for Defining Global Market Size (Value, Volume* & Price*)

Note*: In applicable scenarios
Step 3 - Data Sources
Primary Research
- Web Analytics
- Survey Reports
- Research Institute
- Latest Research Reports
- Opinion Leaders
Secondary Research
- Annual Reports
- White Paper
- Latest Press Release
- Industry Association
- Paid Database
- Investor Presentations

Step 4 - Data Triangulation
Involves using different sources of information in order to increase the validity of a study
These sources are likely to be stakeholders in a program - participants, other researchers, program staff, other community members, and so on.
Then we put all data in single framework & apply various statistical tools to find out the dynamic on the market.
During the analysis stage, feedback from the stakeholder groups would be compared to determine areas of agreement as well as areas of divergence


