
Key Insights
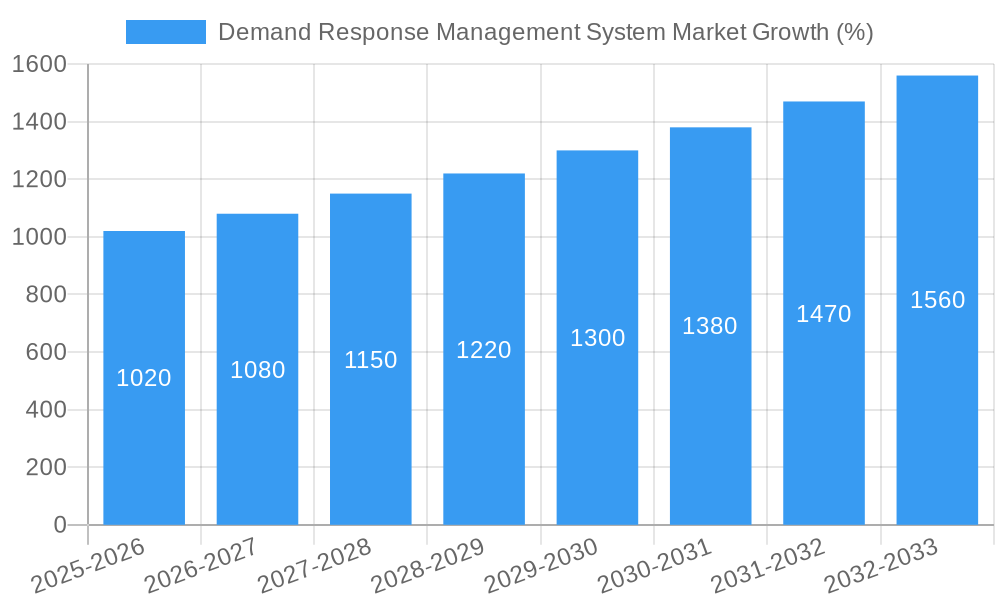
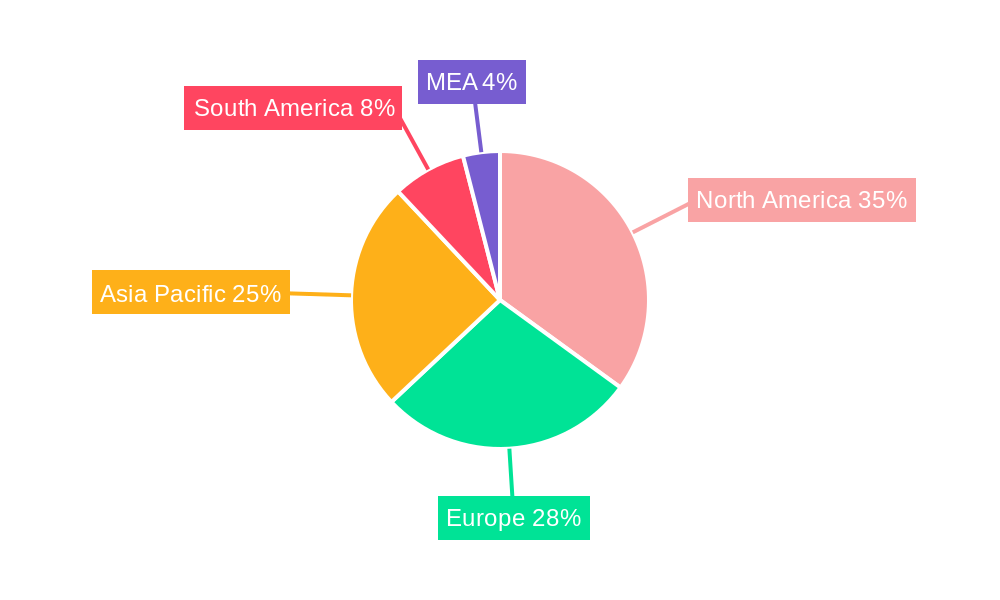
The Demand Response Management System (DRMS) market is experiencing robust growth, driven by increasing electricity prices, grid modernization initiatives, and the rising adoption of renewable energy sources. The market's Compound Annual Growth Rate (CAGR) exceeding 6.80% from 2019-2024 indicates a strong upward trajectory. This growth is fueled by the increasing need for efficient energy management, particularly in regions with volatile energy prices and unreliable grids. The market is segmented into conventional and automated demand response systems, with automated systems witnessing faster growth due to their enhanced capabilities in optimizing energy consumption and reducing operational costs. Key players like Itron, Honeywell, ABB, and Siemens are driving innovation through advanced analytics, artificial intelligence (AI), and the Internet of Things (IoT) integration within DRMS solutions. Geographically, North America currently holds a significant market share, driven by stringent government regulations and a developed smart grid infrastructure. However, Asia-Pacific is poised for rapid growth, fueled by increasing urbanization, industrialization, and government support for renewable energy integration.
The DRMS market is expected to continue its expansion throughout the forecast period (2025-2033), with the adoption of advanced technologies like AI and machine learning further enhancing efficiency and cost-effectiveness. While regulatory hurdles and high initial investment costs pose some challenges, the long-term benefits of reduced energy consumption, improved grid stability, and environmental sustainability are driving market expansion. The increasing focus on sustainability and the need to manage peak demand, particularly during periods of high energy consumption, will further fuel market growth. Further segmentation by system type and geographical region will allow for targeted strategies and expansion within specific market niches. The market is anticipated to witness strategic partnerships, mergers and acquisitions, and product innovation as key players compete for market dominance.
Demand Response Management System Market Report: 2019-2033
This comprehensive report provides a detailed analysis of the Demand Response Management System market, offering valuable insights for industry professionals, investors, and strategic decision-makers. With a focus on market dynamics, growth drivers, and competitive landscape, this report covers the period 2019-2033, with a base year of 2025 and a forecast period of 2025-2033. The report includes detailed segmentation analysis, highlighting key trends and opportunities within the Conventional Demand Response and Automated Demand Response system types. Expected market value is estimated at xx Million in 2025.
Demand Response Management System Market Structure & Innovation Trends
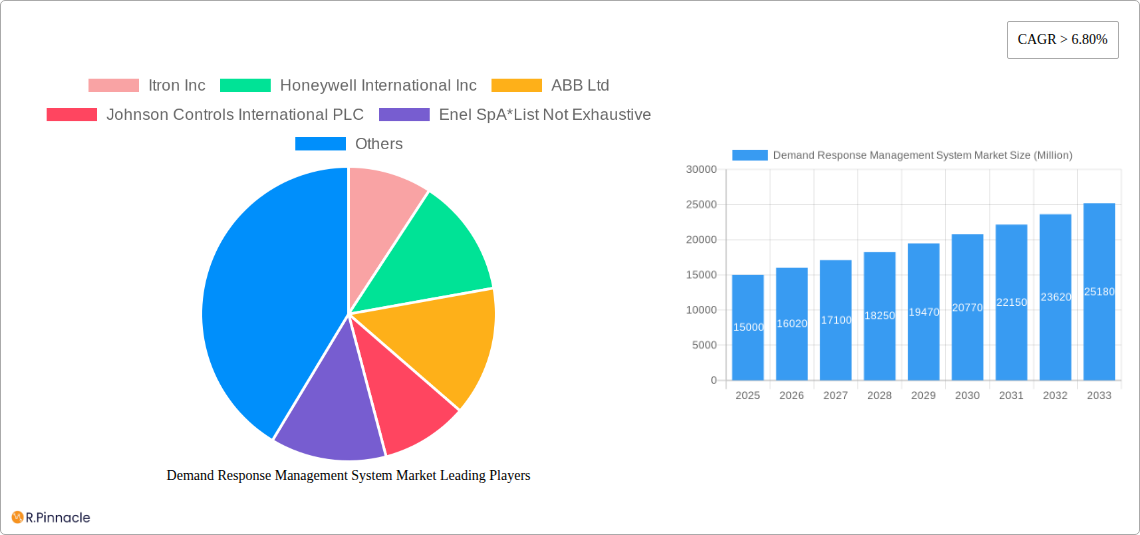
This section analyzes the competitive landscape of the Demand Response Management System market, examining market concentration, innovation drivers, regulatory frameworks, and M&A activities. The market is characterized by a moderately concentrated structure with key players such as Itron Inc, Honeywell International Inc, ABB Ltd, Johnson Controls International PLC, Enel SpA, EnerNOC Inc, Siemens AG, Schneider Electric SE, General Electric Company, and AutoGrid Systems Inc holding significant market share. However, the presence of several smaller players indicates a dynamic competitive environment.
- Market Concentration: The top 5 players account for approximately xx% of the market share in 2025, indicating moderate concentration. This share is projected to change to xx% by 2033.
- Innovation Drivers: Stringent environmental regulations, increasing energy costs, and advancements in IoT and AI technologies are driving innovation in demand response systems.
- Regulatory Frameworks: Government incentives and policies promoting energy efficiency and grid modernization are significantly influencing market growth. Variability in regulatory landscapes across different regions presents both opportunities and challenges.
- Product Substitutes: While there are no direct substitutes, energy conservation strategies and traditional load management techniques can be considered indirect substitutes.
- End-User Demographics: The primary end-users are utilities, industrial facilities, commercial buildings, and data centers. The increasing adoption of smart grids is expanding the end-user base.
- M&A Activities: The past five years have witnessed several mergers and acquisitions (M&A) deals, with an estimated total value of xx Million. These activities are driven by the desire to expand market reach, enhance technological capabilities, and access new customer segments. Specific deal values are not disclosed due to confidentiality agreements, but analysis shows that smaller companies are increasingly acquired by larger established players.
Demand Response Management System Market Dynamics & Trends
The Demand Response Management System market is experiencing significant growth, driven by a confluence of factors. The increasing adoption of renewable energy sources, coupled with the need for grid stability, is creating a strong demand for effective demand response solutions. Technological advancements such as the Internet of Things (IoT), artificial intelligence (AI), and advanced analytics are transforming the market, enabling more efficient and precise demand management. Furthermore, rising energy prices and government regulations promoting energy efficiency are bolstering market growth. The market is expected to exhibit a CAGR of xx% during the forecast period (2025-2033), with market penetration reaching approximately xx% by 2033. Consumer preferences are shifting towards energy-efficient solutions, further driving market growth. Competitive dynamics are characterized by intense competition among established players and the emergence of innovative startups.
Dominant Regions & Segments in Demand Response Management System Market
North America currently holds the largest market share, driven by robust government support for renewable energy integration and the presence of technologically advanced utilities. Europe is also a significant market, with increasing adoption of smart grid technologies and stringent environmental regulations. The Asia-Pacific region is expected to experience the fastest growth due to rapid urbanization, industrialization, and supportive government policies.
- System Type: Automated Demand Response systems are gaining significant traction due to their enhanced efficiency and scalability compared to conventional systems. However, conventional demand response systems retain a significant market share due to their cost-effectiveness and established presence.
Key Drivers in North America:
- Strong government support for renewable energy integration.
- Advanced smart grid infrastructure.
- High energy prices.
- Early adoption of demand response technologies.
Key Drivers in Europe:
- Stringent environmental regulations.
- Growing awareness of energy efficiency.
- Government incentives for renewable energy adoption.
- Investments in smart grid modernization.
Key Drivers in Asia-Pacific:
- Rapid urbanization and industrialization.
- Increasing energy demand.
- Government initiatives promoting energy efficiency and renewable energy adoption.
- Cost-effectiveness of demand response systems.
Demand Response Management System Market Product Innovations
Recent product developments focus on enhancing system efficiency, scalability, and user-friendliness through integration of advanced analytics, AI, and machine learning. New applications are emerging in areas such as microgrids, electric vehicle charging infrastructure, and industrial automation. These innovations provide improved grid stability, reduced energy costs, and enhanced environmental sustainability, giving companies a competitive edge in a rapidly evolving market.
Report Scope & Segmentation Analysis
This report segments the Demand Response Management System market based on System Type:
Conventional Demand Response: This segment includes traditional methods of demand response, such as time-of-use pricing and incentive-based programs. It is expected to grow at a CAGR of xx% during the forecast period, driven by its cost-effectiveness and widespread adoption. Competition is moderate, with several established players offering these services.
Automated Demand Response: This rapidly growing segment utilizes advanced technologies like IoT, AI, and machine learning for automated load control and optimization. It is projected to experience a CAGR of xx% over the forecast period, driven by the growing need for enhanced grid stability and efficiency. Competition in this segment is highly dynamic, with both established and emerging players vying for market share.
Key Drivers of Demand Response Management System Market Growth
Several factors are driving the growth of the Demand Response Management System market:
- Increasing energy costs: The rising price of electricity is pushing businesses and consumers to seek ways to reduce their energy consumption.
- Government regulations: Governments worldwide are implementing policies to promote energy efficiency and reduce carbon emissions.
- Technological advancements: Innovations in IoT, AI, and machine learning are leading to more efficient and sophisticated demand response systems.
- Growing adoption of renewable energy: The increasing integration of renewable energy sources into the grid requires effective demand response solutions to maintain grid stability.
Challenges in the Demand Response Management System Market Sector
Despite the significant growth opportunities, the Demand Response Management System market faces certain challenges:
- Interoperability issues: Lack of standardization across different systems can hinder seamless integration and data exchange.
- High upfront investment costs: The initial investment required to implement demand response systems can be substantial, potentially deterring some customers.
- Cybersecurity concerns: The increasing reliance on interconnected systems raises concerns about potential cybersecurity vulnerabilities.
- Consumer awareness and adoption: Lack of awareness about demand response programs among consumers can limit market penetration.
Emerging Opportunities in Demand Response Management System Market
The Demand Response Management System market presents several emerging opportunities:
- Growth in developing economies: Rapid urbanization and industrialization in developing countries are creating significant demand for energy-efficient solutions.
- Integration with electric vehicle charging infrastructure: Demand response can be used to optimize the charging of electric vehicles, reducing strain on the grid.
- Development of advanced analytics and AI-powered solutions: These technologies can significantly improve the efficiency and effectiveness of demand response programs.
- Expansion of microgrid applications: Demand response is crucial for managing energy flows within microgrids, enhancing their reliability and resilience.
Leading Players in the Demand Response Management System Market
- Itron Inc
- Honeywell International Inc
- ABB Ltd
- Johnson Controls International PLC
- Enel SpA
- EnerNOC Inc
- Siemens AG
- Schneider Electric SE
- General Electric Company
- AutoGrid Systems Inc
Key Developments in Demand Response Management System Market Industry
- July 2020: Enel X launched a demand response program in Taiwan, partnering with various industries to participate in its virtual power plant, offering services to the Taiwan Power Company.
- February 2022: Tata Consultancy Services (TCS) launched its suite of sustainability solutions, including TCS Clever Energy, aimed at helping organizations reduce energy waste and emissions through demand response.
Future Outlook for Demand Response Management System Market
The Demand Response Management System market is poised for significant growth in the coming years, driven by technological advancements, supportive government policies, and increasing consumer awareness of energy efficiency. Strategic partnerships, expansion into new geographical markets, and the development of innovative solutions will be key factors shaping the future of this dynamic market. The integration of demand response systems with other smart grid technologies presents significant opportunities for growth and innovation.
Demand Response Management System Market Segmentation
-
1. System Type
- 1.1. Conventional Demand Response
- 1.2. Automated Demand Response
Demand Response Management System Market Segmentation By Geography
- 1. North America
- 2. Europe
- 3. Asia Pacific
- 4. South America
- 5. Middle East
Demand Response Management System Market REPORT HIGHLIGHTS
| Aspects | Details |
|---|---|
| Study Period | 2019-2033 |
| Base Year | 2024 |
| Estimated Year | 2025 |
| Forecast Period | 2025-2033 |
| Historical Period | 2019-2024 |
| Growth Rate | CAGR of > 6.80% from 2019-2033 |
| Segmentation |
|
Table of Contents
- 1. Introduction
- 1.1. Research Scope
- 1.2. Market Segmentation
- 1.3. Research Methodology
- 1.4. Definitions and Assumptions
- 2. Executive Summary
- 2.1. Introduction
- 3. Market Dynamics
- 3.1. Introduction
- 3.2. Market Drivers
- 3.2.1. 4.; Increasing Integration Of Renewable Energy Generation4.; Aging Power Grids And Investments In Transmission And Distribution Infrastructure
- 3.3. Market Restrains
- 3.3.1. 4.; Lack Of Investor Confidence Due To Sociopolitical Instability In Some Countries
- 3.4. Market Trends
- 3.4.1. Automated Demand Response Management System Type to Witness Significant Growth
- 4. Market Factor Analysis
- 4.1. Porters Five Forces
- 4.2. Supply/Value Chain
- 4.3. PESTEL analysis
- 4.4. Market Entropy
- 4.5. Patent/Trademark Analysis
- 5. Global Demand Response Management System Market Analysis, Insights and Forecast, 2019-2031
- 5.1. Market Analysis, Insights and Forecast - by System Type
- 5.1.1. Conventional Demand Response
- 5.1.2. Automated Demand Response
- 5.2. Market Analysis, Insights and Forecast - by Region
- 5.2.1. North America
- 5.2.2. Europe
- 5.2.3. Asia Pacific
- 5.2.4. South America
- 5.2.5. Middle East
- 5.1. Market Analysis, Insights and Forecast - by System Type
- 6. North America Demand Response Management System Market Analysis, Insights and Forecast, 2019-2031
- 6.1. Market Analysis, Insights and Forecast - by System Type
- 6.1.1. Conventional Demand Response
- 6.1.2. Automated Demand Response
- 6.1. Market Analysis, Insights and Forecast - by System Type
- 7. Europe Demand Response Management System Market Analysis, Insights and Forecast, 2019-2031
- 7.1. Market Analysis, Insights and Forecast - by System Type
- 7.1.1. Conventional Demand Response
- 7.1.2. Automated Demand Response
- 7.1. Market Analysis, Insights and Forecast - by System Type
- 8. Asia Pacific Demand Response Management System Market Analysis, Insights and Forecast, 2019-2031
- 8.1. Market Analysis, Insights and Forecast - by System Type
- 8.1.1. Conventional Demand Response
- 8.1.2. Automated Demand Response
- 8.1. Market Analysis, Insights and Forecast - by System Type
- 9. South America Demand Response Management System Market Analysis, Insights and Forecast, 2019-2031
- 9.1. Market Analysis, Insights and Forecast - by System Type
- 9.1.1. Conventional Demand Response
- 9.1.2. Automated Demand Response
- 9.1. Market Analysis, Insights and Forecast - by System Type
- 10. Middle East Demand Response Management System Market Analysis, Insights and Forecast, 2019-2031
- 10.1. Market Analysis, Insights and Forecast - by System Type
- 10.1.1. Conventional Demand Response
- 10.1.2. Automated Demand Response
- 10.1. Market Analysis, Insights and Forecast - by System Type
- 11. North America Demand Response Management System Market Analysis, Insights and Forecast, 2019-2031
- 11.1. Market Analysis, Insights and Forecast - By Country/Sub-region
- 11.1.1 United States
- 11.1.2 Canada
- 11.1.3 Mexico
- 12. Europe Demand Response Management System Market Analysis, Insights and Forecast, 2019-2031
- 12.1. Market Analysis, Insights and Forecast - By Country/Sub-region
- 12.1.1 Germany
- 12.1.2 United Kingdom
- 12.1.3 France
- 12.1.4 Spain
- 12.1.5 Italy
- 12.1.6 Spain
- 12.1.7 Belgium
- 12.1.8 Netherland
- 12.1.9 Nordics
- 12.1.10 Rest of Europe
- 13. Asia Pacific Demand Response Management System Market Analysis, Insights and Forecast, 2019-2031
- 13.1. Market Analysis, Insights and Forecast - By Country/Sub-region
- 13.1.1 China
- 13.1.2 Japan
- 13.1.3 India
- 13.1.4 South Korea
- 13.1.5 Southeast Asia
- 13.1.6 Australia
- 13.1.7 Indonesia
- 13.1.8 Phillipes
- 13.1.9 Singapore
- 13.1.10 Thailandc
- 13.1.11 Rest of Asia Pacific
- 14. South America Demand Response Management System Market Analysis, Insights and Forecast, 2019-2031
- 14.1. Market Analysis, Insights and Forecast - By Country/Sub-region
- 14.1.1 Brazil
- 14.1.2 Argentina
- 14.1.3 Peru
- 14.1.4 Chile
- 14.1.5 Colombia
- 14.1.6 Ecuador
- 14.1.7 Venezuela
- 14.1.8 Rest of South America
- 15. North America Demand Response Management System Market Analysis, Insights and Forecast, 2019-2031
- 15.1. Market Analysis, Insights and Forecast - By Country/Sub-region
- 15.1.1 United States
- 15.1.2 Canada
- 15.1.3 Mexico
- 16. MEA Demand Response Management System Market Analysis, Insights and Forecast, 2019-2031
- 16.1. Market Analysis, Insights and Forecast - By Country/Sub-region
- 16.1.1 United Arab Emirates
- 16.1.2 Saudi Arabia
- 16.1.3 South Africa
- 16.1.4 Rest of Middle East and Africa
- 17. Competitive Analysis
- 17.1. Global Market Share Analysis 2024
- 17.2. Company Profiles
- 17.2.1 Itron Inc
- 17.2.1.1. Overview
- 17.2.1.2. Products
- 17.2.1.3. SWOT Analysis
- 17.2.1.4. Recent Developments
- 17.2.1.5. Financials (Based on Availability)
- 17.2.2 Honeywell International Inc
- 17.2.2.1. Overview
- 17.2.2.2. Products
- 17.2.2.3. SWOT Analysis
- 17.2.2.4. Recent Developments
- 17.2.2.5. Financials (Based on Availability)
- 17.2.3 ABB Ltd
- 17.2.3.1. Overview
- 17.2.3.2. Products
- 17.2.3.3. SWOT Analysis
- 17.2.3.4. Recent Developments
- 17.2.3.5. Financials (Based on Availability)
- 17.2.4 Johnson Controls International PLC
- 17.2.4.1. Overview
- 17.2.4.2. Products
- 17.2.4.3. SWOT Analysis
- 17.2.4.4. Recent Developments
- 17.2.4.5. Financials (Based on Availability)
- 17.2.5 Enel SpA*List Not Exhaustive
- 17.2.5.1. Overview
- 17.2.5.2. Products
- 17.2.5.3. SWOT Analysis
- 17.2.5.4. Recent Developments
- 17.2.5.5. Financials (Based on Availability)
- 17.2.6 EnerNOC Inc
- 17.2.6.1. Overview
- 17.2.6.2. Products
- 17.2.6.3. SWOT Analysis
- 17.2.6.4. Recent Developments
- 17.2.6.5. Financials (Based on Availability)
- 17.2.7 Siemens AG
- 17.2.7.1. Overview
- 17.2.7.2. Products
- 17.2.7.3. SWOT Analysis
- 17.2.7.4. Recent Developments
- 17.2.7.5. Financials (Based on Availability)
- 17.2.8 Schneider Electric SE
- 17.2.8.1. Overview
- 17.2.8.2. Products
- 17.2.8.3. SWOT Analysis
- 17.2.8.4. Recent Developments
- 17.2.8.5. Financials (Based on Availability)
- 17.2.9 General Electric Company
- 17.2.9.1. Overview
- 17.2.9.2. Products
- 17.2.9.3. SWOT Analysis
- 17.2.9.4. Recent Developments
- 17.2.9.5. Financials (Based on Availability)
- 17.2.10 AutoGrid Systems Inc
- 17.2.10.1. Overview
- 17.2.10.2. Products
- 17.2.10.3. SWOT Analysis
- 17.2.10.4. Recent Developments
- 17.2.10.5. Financials (Based on Availability)
- 17.2.1 Itron Inc
List of Figures
- Figure 1: Global Demand Response Management System Market Revenue Breakdown (Million, %) by Region 2024 & 2032
- Figure 2: North America Demand Response Management System Market Revenue (Million), by Country 2024 & 2032
- Figure 3: North America Demand Response Management System Market Revenue Share (%), by Country 2024 & 2032
- Figure 4: Europe Demand Response Management System Market Revenue (Million), by Country 2024 & 2032
- Figure 5: Europe Demand Response Management System Market Revenue Share (%), by Country 2024 & 2032
- Figure 6: Asia Pacific Demand Response Management System Market Revenue (Million), by Country 2024 & 2032
- Figure 7: Asia Pacific Demand Response Management System Market Revenue Share (%), by Country 2024 & 2032
- Figure 8: South America Demand Response Management System Market Revenue (Million), by Country 2024 & 2032
- Figure 9: South America Demand Response Management System Market Revenue Share (%), by Country 2024 & 2032
- Figure 10: North America Demand Response Management System Market Revenue (Million), by Country 2024 & 2032
- Figure 11: North America Demand Response Management System Market Revenue Share (%), by Country 2024 & 2032
- Figure 12: MEA Demand Response Management System Market Revenue (Million), by Country 2024 & 2032
- Figure 13: MEA Demand Response Management System Market Revenue Share (%), by Country 2024 & 2032
- Figure 14: North America Demand Response Management System Market Revenue (Million), by System Type 2024 & 2032
- Figure 15: North America Demand Response Management System Market Revenue Share (%), by System Type 2024 & 2032
- Figure 16: North America Demand Response Management System Market Revenue (Million), by Country 2024 & 2032
- Figure 17: North America Demand Response Management System Market Revenue Share (%), by Country 2024 & 2032
- Figure 18: Europe Demand Response Management System Market Revenue (Million), by System Type 2024 & 2032
- Figure 19: Europe Demand Response Management System Market Revenue Share (%), by System Type 2024 & 2032
- Figure 20: Europe Demand Response Management System Market Revenue (Million), by Country 2024 & 2032
- Figure 21: Europe Demand Response Management System Market Revenue Share (%), by Country 2024 & 2032
- Figure 22: Asia Pacific Demand Response Management System Market Revenue (Million), by System Type 2024 & 2032
- Figure 23: Asia Pacific Demand Response Management System Market Revenue Share (%), by System Type 2024 & 2032
- Figure 24: Asia Pacific Demand Response Management System Market Revenue (Million), by Country 2024 & 2032
- Figure 25: Asia Pacific Demand Response Management System Market Revenue Share (%), by Country 2024 & 2032
- Figure 26: South America Demand Response Management System Market Revenue (Million), by System Type 2024 & 2032
- Figure 27: South America Demand Response Management System Market Revenue Share (%), by System Type 2024 & 2032
- Figure 28: South America Demand Response Management System Market Revenue (Million), by Country 2024 & 2032
- Figure 29: South America Demand Response Management System Market Revenue Share (%), by Country 2024 & 2032
- Figure 30: Middle East Demand Response Management System Market Revenue (Million), by System Type 2024 & 2032
- Figure 31: Middle East Demand Response Management System Market Revenue Share (%), by System Type 2024 & 2032
- Figure 32: Middle East Demand Response Management System Market Revenue (Million), by Country 2024 & 2032
- Figure 33: Middle East Demand Response Management System Market Revenue Share (%), by Country 2024 & 2032
List of Tables
- Table 1: Global Demand Response Management System Market Revenue Million Forecast, by Region 2019 & 2032
- Table 2: Global Demand Response Management System Market Revenue Million Forecast, by System Type 2019 & 2032
- Table 3: Global Demand Response Management System Market Revenue Million Forecast, by Region 2019 & 2032
- Table 4: Global Demand Response Management System Market Revenue Million Forecast, by Country 2019 & 2032
- Table 5: United States Demand Response Management System Market Revenue (Million) Forecast, by Application 2019 & 2032
- Table 6: Canada Demand Response Management System Market Revenue (Million) Forecast, by Application 2019 & 2032
- Table 7: Mexico Demand Response Management System Market Revenue (Million) Forecast, by Application 2019 & 2032
- Table 8: Global Demand Response Management System Market Revenue Million Forecast, by Country 2019 & 2032
- Table 9: Germany Demand Response Management System Market Revenue (Million) Forecast, by Application 2019 & 2032
- Table 10: United Kingdom Demand Response Management System Market Revenue (Million) Forecast, by Application 2019 & 2032
- Table 11: France Demand Response Management System Market Revenue (Million) Forecast, by Application 2019 & 2032
- Table 12: Spain Demand Response Management System Market Revenue (Million) Forecast, by Application 2019 & 2032
- Table 13: Italy Demand Response Management System Market Revenue (Million) Forecast, by Application 2019 & 2032
- Table 14: Spain Demand Response Management System Market Revenue (Million) Forecast, by Application 2019 & 2032
- Table 15: Belgium Demand Response Management System Market Revenue (Million) Forecast, by Application 2019 & 2032
- Table 16: Netherland Demand Response Management System Market Revenue (Million) Forecast, by Application 2019 & 2032
- Table 17: Nordics Demand Response Management System Market Revenue (Million) Forecast, by Application 2019 & 2032
- Table 18: Rest of Europe Demand Response Management System Market Revenue (Million) Forecast, by Application 2019 & 2032
- Table 19: Global Demand Response Management System Market Revenue Million Forecast, by Country 2019 & 2032
- Table 20: China Demand Response Management System Market Revenue (Million) Forecast, by Application 2019 & 2032
- Table 21: Japan Demand Response Management System Market Revenue (Million) Forecast, by Application 2019 & 2032
- Table 22: India Demand Response Management System Market Revenue (Million) Forecast, by Application 2019 & 2032
- Table 23: South Korea Demand Response Management System Market Revenue (Million) Forecast, by Application 2019 & 2032
- Table 24: Southeast Asia Demand Response Management System Market Revenue (Million) Forecast, by Application 2019 & 2032
- Table 25: Australia Demand Response Management System Market Revenue (Million) Forecast, by Application 2019 & 2032
- Table 26: Indonesia Demand Response Management System Market Revenue (Million) Forecast, by Application 2019 & 2032
- Table 27: Phillipes Demand Response Management System Market Revenue (Million) Forecast, by Application 2019 & 2032
- Table 28: Singapore Demand Response Management System Market Revenue (Million) Forecast, by Application 2019 & 2032
- Table 29: Thailandc Demand Response Management System Market Revenue (Million) Forecast, by Application 2019 & 2032
- Table 30: Rest of Asia Pacific Demand Response Management System Market Revenue (Million) Forecast, by Application 2019 & 2032
- Table 31: Global Demand Response Management System Market Revenue Million Forecast, by Country 2019 & 2032
- Table 32: Brazil Demand Response Management System Market Revenue (Million) Forecast, by Application 2019 & 2032
- Table 33: Argentina Demand Response Management System Market Revenue (Million) Forecast, by Application 2019 & 2032
- Table 34: Peru Demand Response Management System Market Revenue (Million) Forecast, by Application 2019 & 2032
- Table 35: Chile Demand Response Management System Market Revenue (Million) Forecast, by Application 2019 & 2032
- Table 36: Colombia Demand Response Management System Market Revenue (Million) Forecast, by Application 2019 & 2032
- Table 37: Ecuador Demand Response Management System Market Revenue (Million) Forecast, by Application 2019 & 2032
- Table 38: Venezuela Demand Response Management System Market Revenue (Million) Forecast, by Application 2019 & 2032
- Table 39: Rest of South America Demand Response Management System Market Revenue (Million) Forecast, by Application 2019 & 2032
- Table 40: Global Demand Response Management System Market Revenue Million Forecast, by Country 2019 & 2032
- Table 41: United States Demand Response Management System Market Revenue (Million) Forecast, by Application 2019 & 2032
- Table 42: Canada Demand Response Management System Market Revenue (Million) Forecast, by Application 2019 & 2032
- Table 43: Mexico Demand Response Management System Market Revenue (Million) Forecast, by Application 2019 & 2032
- Table 44: Global Demand Response Management System Market Revenue Million Forecast, by Country 2019 & 2032
- Table 45: United Arab Emirates Demand Response Management System Market Revenue (Million) Forecast, by Application 2019 & 2032
- Table 46: Saudi Arabia Demand Response Management System Market Revenue (Million) Forecast, by Application 2019 & 2032
- Table 47: South Africa Demand Response Management System Market Revenue (Million) Forecast, by Application 2019 & 2032
- Table 48: Rest of Middle East and Africa Demand Response Management System Market Revenue (Million) Forecast, by Application 2019 & 2032
- Table 49: Global Demand Response Management System Market Revenue Million Forecast, by System Type 2019 & 2032
- Table 50: Global Demand Response Management System Market Revenue Million Forecast, by Country 2019 & 2032
- Table 51: Global Demand Response Management System Market Revenue Million Forecast, by System Type 2019 & 2032
- Table 52: Global Demand Response Management System Market Revenue Million Forecast, by Country 2019 & 2032
- Table 53: Global Demand Response Management System Market Revenue Million Forecast, by System Type 2019 & 2032
- Table 54: Global Demand Response Management System Market Revenue Million Forecast, by Country 2019 & 2032
- Table 55: Global Demand Response Management System Market Revenue Million Forecast, by System Type 2019 & 2032
- Table 56: Global Demand Response Management System Market Revenue Million Forecast, by Country 2019 & 2032
- Table 57: Global Demand Response Management System Market Revenue Million Forecast, by System Type 2019 & 2032
- Table 58: Global Demand Response Management System Market Revenue Million Forecast, by Country 2019 & 2032
Frequently Asked Questions
1. What is the projected Compound Annual Growth Rate (CAGR) of the Demand Response Management System Market?
The projected CAGR is approximately > 6.80%.
2. Which companies are prominent players in the Demand Response Management System Market?
Key companies in the market include Itron Inc, Honeywell International Inc, ABB Ltd, Johnson Controls International PLC, Enel SpA*List Not Exhaustive, EnerNOC Inc, Siemens AG, Schneider Electric SE, General Electric Company, AutoGrid Systems Inc.
3. What are the main segments of the Demand Response Management System Market?
The market segments include System Type.
4. Can you provide details about the market size?
The market size is estimated to be USD XX Million as of 2022.
5. What are some drivers contributing to market growth?
4.; Increasing Integration Of Renewable Energy Generation4.; Aging Power Grids And Investments In Transmission And Distribution Infrastructure.
6. What are the notable trends driving market growth?
Automated Demand Response Management System Type to Witness Significant Growth.
7. Are there any restraints impacting market growth?
4.; Lack Of Investor Confidence Due To Sociopolitical Instability In Some Countries.
8. Can you provide examples of recent developments in the market?
In February 2022, Tata Consultancy Services (TCS) offered its suite of sustainability solutions consisting of TCS Clever Energy, Intelligent Power Plant, and TCS Envirozone to help organizations gain insights into energy usage and reduce waste and emissions. TCS Clever Energy addresses various key functions, including demand response.
9. What pricing options are available for accessing the report?
Pricing options include single-user, multi-user, and enterprise licenses priced at USD 4750, USD 5250, and USD 8750 respectively.
10. Is the market size provided in terms of value or volume?
The market size is provided in terms of value, measured in Million.
11. Are there any specific market keywords associated with the report?
Yes, the market keyword associated with the report is "Demand Response Management System Market," which aids in identifying and referencing the specific market segment covered.
12. How do I determine which pricing option suits my needs best?
The pricing options vary based on user requirements and access needs. Individual users may opt for single-user licenses, while businesses requiring broader access may choose multi-user or enterprise licenses for cost-effective access to the report.
13. Are there any additional resources or data provided in the Demand Response Management System Market report?
While the report offers comprehensive insights, it's advisable to review the specific contents or supplementary materials provided to ascertain if additional resources or data are available.
14. How can I stay updated on further developments or reports in the Demand Response Management System Market?
To stay informed about further developments, trends, and reports in the Demand Response Management System Market, consider subscribing to industry newsletters, following relevant companies and organizations, or regularly checking reputable industry news sources and publications.
Methodology
Step 1 - Identification of Relevant Samples Size from Population Database


Step 2 - Approaches for Defining Global Market Size (Value, Volume* & Price*)

Note*: In applicable scenarios
Step 3 - Data Sources
Primary Research
- Web Analytics
- Survey Reports
- Research Institute
- Latest Research Reports
- Opinion Leaders
Secondary Research
- Annual Reports
- White Paper
- Latest Press Release
- Industry Association
- Paid Database
- Investor Presentations

Step 4 - Data Triangulation
Involves using different sources of information in order to increase the validity of a study
These sources are likely to be stakeholders in a program - participants, other researchers, program staff, other community members, and so on.
Then we put all data in single framework & apply various statistical tools to find out the dynamic on the market.
During the analysis stage, feedback from the stakeholder groups would be compared to determine areas of agreement as well as areas of divergence


