
Key Insights
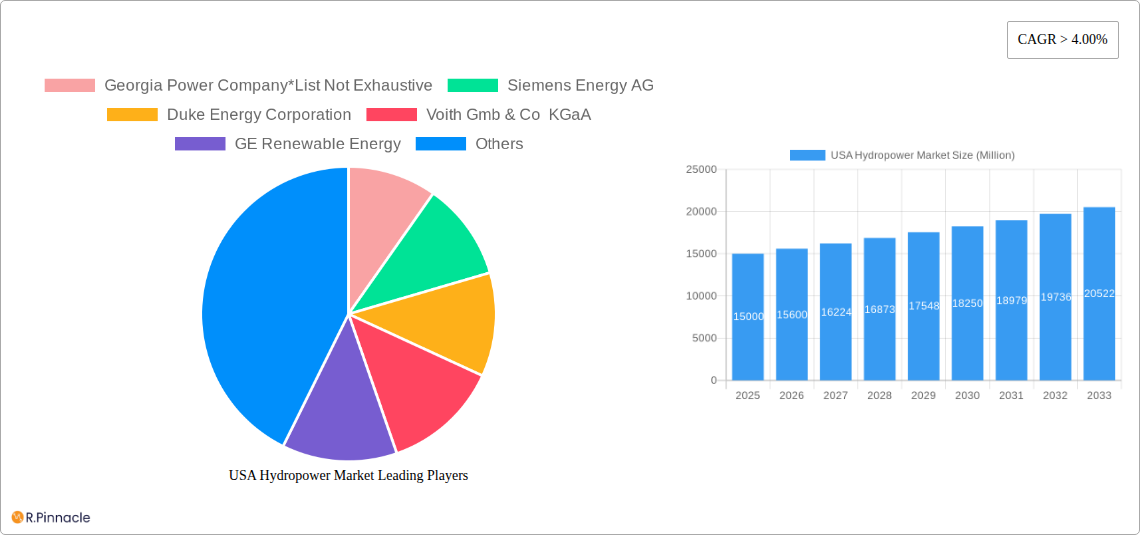
The U.S. hydropower market is experiencing robust growth, driven by increasing demand for renewable energy and government initiatives promoting clean energy sources. With a Compound Annual Growth Rate (CAGR) exceeding 4%, the market is projected to expand significantly over the forecast period (2025-2033). The market's segmentation by capacity (small, medium, and large hydropower plants) reveals a diverse landscape, with larger plants potentially contributing the most to overall market value due to their higher energy output. Key players like Georgia Power Company, Siemens Energy AG, Duke Energy Corporation, Voith, GE Renewable Energy, and Andritz AG are actively shaping the market through technological advancements, project development, and operational expertise. While the historical period (2019-2024) provides a foundation, the focus on the future (2025-2033) suggests a strong emphasis on future projects and investments. Factors like aging infrastructure requiring modernization and potential environmental concerns related to dam construction and operation may act as restraints, but the overarching trend points towards a positive outlook for hydropower's contribution to the U.S. energy mix.
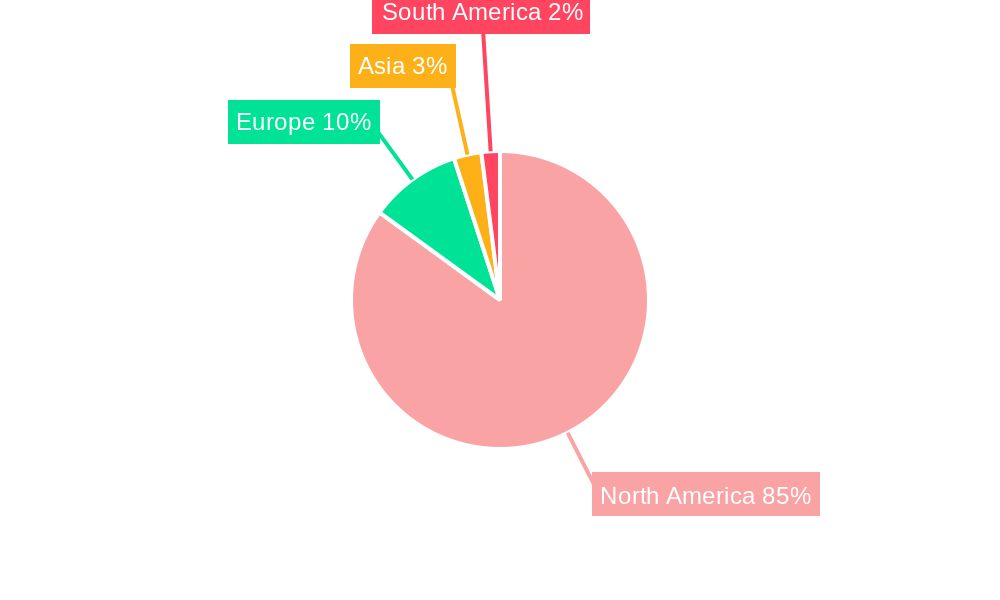
The North American region, particularly the United States, constitutes a significant portion of this market, fueled by supportive regulatory frameworks and ample hydropower resources. The market size in 2025 is estimated to be substantial, considering the provided CAGR and the established presence of major players. Future growth will likely be shaped by technological innovations aimed at increasing efficiency and reducing environmental impact, such as advanced turbine designs and improved water management strategies. Furthermore, the integration of hydropower with other renewable energy sources (like solar and wind) through hybrid systems may unlock further growth opportunities, contributing to a more resilient and sustainable energy grid. This synergistic approach will likely play a critical role in shaping the future of the U.S. hydropower market.
USA Hydropower Market: A Comprehensive Report (2019-2033)
This in-depth report provides a comprehensive analysis of the USA Hydropower Market, offering invaluable insights for industry professionals, investors, and strategic decision-makers. From market structure and innovation trends to dominant regions and leading players, this report unveils the key dynamics shaping the future of hydropower in the United States. The report covers the period 2019-2033, with a base year of 2025 and a forecast period of 2025-2033. Projected market values are in Millions.
USA Hydropower Market Structure & Innovation Trends
The USA hydropower market exhibits a moderately concentrated structure, with several major players holding significant market share. Georgia Power Company, Siemens Energy AG, Duke Energy Corporation, Voith Gmb & Co KGaA, GE Renewable Energy, and Andritz AG are key participants, although the market also includes numerous smaller regional operators. Market share dynamics are influenced by factors such as project size, technological capabilities, and regulatory approvals.
Innovation is driven by the need for increased efficiency, reduced environmental impact, and enhanced grid integration capabilities. Regulatory frameworks, including environmental regulations and licensing processes, significantly impact market growth and investment decisions. Substitute technologies, such as solar and wind power, pose a competitive challenge, influencing market segmentation and technology adoption rates. M&A activities have played a role in consolidating the market, with deal values varying significantly depending on the size and scope of the acquired assets. Recent M&A deals have focused on expanding geographic reach and technological portfolios. The overall market demonstrates ongoing consolidation, with larger players acquiring smaller firms to increase market share and access new technologies. For example, xx Million in M&A deals were recorded in 2024.
USA Hydropower Market Market Dynamics & Trends
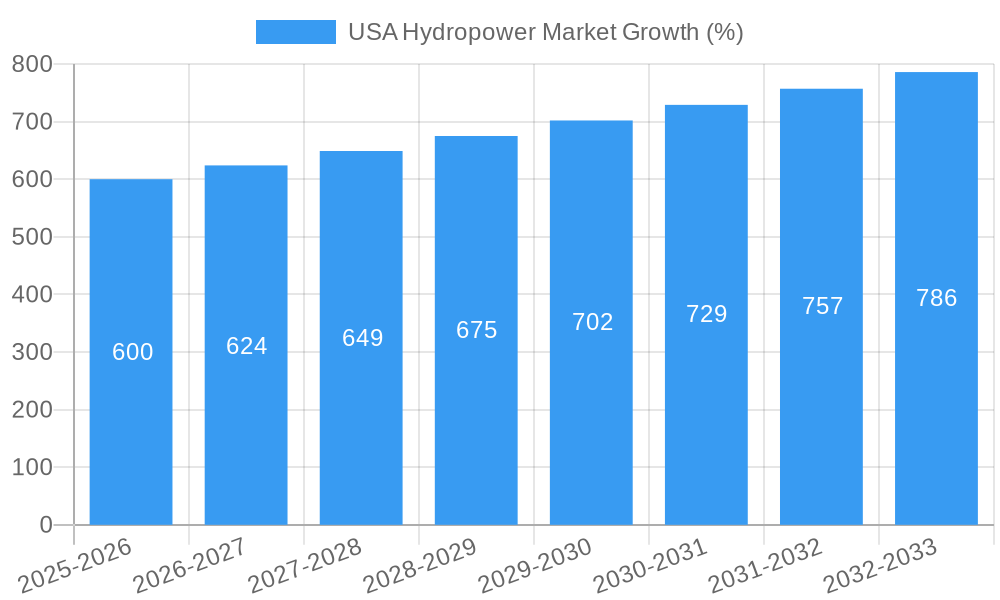
The USA hydropower market is characterized by a complex interplay of growth drivers, technological disruptions, consumer preferences, and competitive dynamics. Market growth is driven by increasing demand for renewable energy, government incentives for hydropower development, and the need for grid modernization. Technological advancements, such as improved turbine designs and digital control systems, are boosting efficiency and reducing operational costs. However, challenges exist, including permitting delays, environmental concerns, and the intermittent nature of hydropower generation. The market demonstrates a compound annual growth rate (CAGR) of xx% during the forecast period (2025-2033), with market penetration expected to increase to xx% by 2033. Competitive dynamics are intensifying, as established players and new entrants compete for market share.
Dominant Regions & Segments in USA Hydropower Market
While detailed regional breakdown requires further data analysis, preliminary findings suggest a concentration of hydropower capacity in the Northwest region due to its abundant water resources and existing infrastructure. The large (over 100 MW) segment currently dominates the market, driven by large-scale projects that provide significant power generation capacity. However, the small (below 50 MW) and medium (50-100 MW) segments also contribute substantially and are likely to see increased growth due to their suitability for diverse geographical locations and integration with existing grids.
Key Drivers for Large Hydropower Segment Dominance:
- Extensive existing infrastructure.
- Favorable economic policies and incentives for large-scale projects.
- Established technology and economies of scale.
Key Drivers for Medium and Small Hydropower Segment Growth:
- Growing focus on distributed generation and smaller-scale projects.
- Suitability for diverse geographical settings and integration with existing grids.
- Reduced upfront investment costs compared to large hydropower projects.
The dominance of specific regions and segments is further analyzed in the full report with detailed regional data.
USA Hydropower Market Product Innovations
Significant product innovations are enhancing the efficiency, reliability, and environmental sustainability of hydropower systems. Advanced turbine designs, improved control systems, and the integration of digital technologies are leading trends, enhancing operational efficiency and minimizing environmental impact. These innovations address the market's growing demand for cleaner energy sources and efficient power generation. The increasing focus on smart grid technologies further facilitates the seamless integration of hydropower into modern energy grids.
Report Scope & Segmentation Analysis
This report segments the USA hydropower market based on capacity:
Small (below 50 MW): This segment is projected to experience significant growth due to its suitability for diverse locations and cost-effectiveness. Market size is projected at xx Million in 2025, with xx% growth expected during the forecast period. Competition is relatively high.
Medium (50-100 MW): This segment represents a balance between large-scale generation and site adaptability. The market size is estimated at xx Million in 2025, with xx% projected growth. Competition is moderate.
Large (over 100 MW): This segment dominates the market due to its high power generation capacity. The market size is estimated at xx Million in 2025, with xx% growth projected, although the rate of growth is expected to slow compared to smaller segments. Competition is intense among major players.
Key Drivers of USA Hydropower Market Growth
Several key factors drive the growth of the USA hydropower market. These include increasing demand for renewable energy sources to meet climate change goals, government incentives and subsidies supporting hydropower development, the need to modernize and enhance the reliability of the national grid, and technological advancements improving the efficiency and environmental performance of hydropower systems. The ongoing development of smart grid technologies allows for better integration and management of renewable energy sources, driving further growth.
Challenges in the USA Hydropower Market Sector
The USA hydropower market faces significant challenges, including lengthy and complex permitting processes, environmental concerns regarding fish migration and ecosystem impacts, and competition from other renewable energy sources such as solar and wind power. These factors contribute to increased project development costs and timelines, potentially impacting market growth. Supply chain disruptions can also lead to cost overruns and project delays.
Emerging Opportunities in USA Hydropower Market
Emerging opportunities lie in the development of pumped hydro storage, which addresses the intermittency of renewable energy sources, and the integration of hydropower with other renewable technologies to create hybrid energy systems. Growing interest in small-scale hydropower projects, particularly in remote or underserved areas, presents further opportunities. Technological advancements, such as improved turbine designs and smart grid integration, are expanding the potential of hydropower.
Leading Players in the USA Hydropower Market Market
- Georgia Power Company
- Siemens Energy AG
- Duke Energy Corporation
- Voith Gmb & Co KGaA
- GE Renewable Energy
- Andritz AG
Key Developments in USA Hydropower Market Industry
- February 2021: SNC Lavalin Group received an engineering services contract for three hydroelectric projects from Rye Development LLC, demonstrating ongoing investment in expanding existing hydropower facilities.
Future Outlook for USA Hydropower Market Market
The future of the USA hydropower market is promising, driven by continued demand for renewable energy, technological advancements, and government support. Strategic opportunities exist for companies that can innovate, streamline project development processes, and effectively address environmental concerns. The market is expected to experience consistent growth driven by policy support and technological improvements over the forecast period.
USA Hydropower Market Segmentation
- 1. Large Hydropower (Greater than 100 MW)
- 2. Small Hydropower (Smaller than 10 MW)
- 3. Other Sizes (10-100 MW)
USA Hydropower Market Segmentation By Geography
-
1. North America
- 1.1. United States
- 1.2. Canada
- 1.3. Mexico
-
2. South America
- 2.1. Brazil
- 2.2. Argentina
- 2.3. Rest of South America
-
3. Europe
- 3.1. United Kingdom
- 3.2. Germany
- 3.3. France
- 3.4. Italy
- 3.5. Spain
- 3.6. Russia
- 3.7. Benelux
- 3.8. Nordics
- 3.9. Rest of Europe
-
4. Middle East & Africa
- 4.1. Turkey
- 4.2. Israel
- 4.3. GCC
- 4.4. North Africa
- 4.5. South Africa
- 4.6. Rest of Middle East & Africa
-
5. Asia Pacific
- 5.1. China
- 5.2. India
- 5.3. Japan
- 5.4. South Korea
- 5.5. ASEAN
- 5.6. Oceania
- 5.7. Rest of Asia Pacific
USA Hydropower Market REPORT HIGHLIGHTS
| Aspects | Details |
|---|---|
| Study Period | 2019-2033 |
| Base Year | 2024 |
| Estimated Year | 2025 |
| Forecast Period | 2025-2033 |
| Historical Period | 2019-2024 |
| Growth Rate | CAGR of > 4.00% from 2019-2033 |
| Segmentation |
|
Table of Contents
- 1. Introduction
- 1.1. Research Scope
- 1.2. Market Segmentation
- 1.3. Research Methodology
- 1.4. Definitions and Assumptions
- 2. Executive Summary
- 2.1. Introduction
- 3. Market Dynamics
- 3.1. Introduction
- 3.2. Market Drivers
- 3.2.1. 4.; Increasing LNG Trade4.; Rising Marine Transportation
- 3.3. Market Restrains
- 3.3.1. 4.; Fluctuations in Crude Oil Prices
- 3.4. Market Trends
- 3.4.1. Large Scale Hydropower to Dominate
- 4. Market Factor Analysis
- 4.1. Porters Five Forces
- 4.2. Supply/Value Chain
- 4.3. PESTEL analysis
- 4.4. Market Entropy
- 4.5. Patent/Trademark Analysis
- 5. Global USA Hydropower Market Analysis, Insights and Forecast, 2019-2031
- 5.1. Market Analysis, Insights and Forecast - by Large Hydropower (Greater than 100 MW)
- 5.2. Market Analysis, Insights and Forecast - by Small Hydropower (Smaller than 10 MW)
- 5.3. Market Analysis, Insights and Forecast - by Other Sizes (10-100 MW)
- 5.4. Market Analysis, Insights and Forecast - by Region
- 5.4.1. North America
- 5.4.2. South America
- 5.4.3. Europe
- 5.4.4. Middle East & Africa
- 5.4.5. Asia Pacific
- 5.1. Market Analysis, Insights and Forecast - by Large Hydropower (Greater than 100 MW)
- 6. North America USA Hydropower Market Analysis, Insights and Forecast, 2019-2031
- 6.1. Market Analysis, Insights and Forecast - by Large Hydropower (Greater than 100 MW)
- 6.2. Market Analysis, Insights and Forecast - by Small Hydropower (Smaller than 10 MW)
- 6.3. Market Analysis, Insights and Forecast - by Other Sizes (10-100 MW)
- 6.1. Market Analysis, Insights and Forecast - by Large Hydropower (Greater than 100 MW)
- 7. South America USA Hydropower Market Analysis, Insights and Forecast, 2019-2031
- 7.1. Market Analysis, Insights and Forecast - by Large Hydropower (Greater than 100 MW)
- 7.2. Market Analysis, Insights and Forecast - by Small Hydropower (Smaller than 10 MW)
- 7.3. Market Analysis, Insights and Forecast - by Other Sizes (10-100 MW)
- 7.1. Market Analysis, Insights and Forecast - by Large Hydropower (Greater than 100 MW)
- 8. Europe USA Hydropower Market Analysis, Insights and Forecast, 2019-2031
- 8.1. Market Analysis, Insights and Forecast - by Large Hydropower (Greater than 100 MW)
- 8.2. Market Analysis, Insights and Forecast - by Small Hydropower (Smaller than 10 MW)
- 8.3. Market Analysis, Insights and Forecast - by Other Sizes (10-100 MW)
- 8.1. Market Analysis, Insights and Forecast - by Large Hydropower (Greater than 100 MW)
- 9. Middle East & Africa USA Hydropower Market Analysis, Insights and Forecast, 2019-2031
- 9.1. Market Analysis, Insights and Forecast - by Large Hydropower (Greater than 100 MW)
- 9.2. Market Analysis, Insights and Forecast - by Small Hydropower (Smaller than 10 MW)
- 9.3. Market Analysis, Insights and Forecast - by Other Sizes (10-100 MW)
- 9.1. Market Analysis, Insights and Forecast - by Large Hydropower (Greater than 100 MW)
- 10. Asia Pacific USA Hydropower Market Analysis, Insights and Forecast, 2019-2031
- 10.1. Market Analysis, Insights and Forecast - by Large Hydropower (Greater than 100 MW)
- 10.2. Market Analysis, Insights and Forecast - by Small Hydropower (Smaller than 10 MW)
- 10.3. Market Analysis, Insights and Forecast - by Other Sizes (10-100 MW)
- 10.1. Market Analysis, Insights and Forecast - by Large Hydropower (Greater than 100 MW)
- 11. United States USA Hydropower Market Analysis, Insights and Forecast, 2019-2031
- 12. Canada USA Hydropower Market Analysis, Insights and Forecast, 2019-2031
- 13. Mexico USA Hydropower Market Analysis, Insights and Forecast, 2019-2031
- 14. Competitive Analysis
- 14.1. Global Market Share Analysis 2024
- 14.2. Company Profiles
- 14.2.1 Georgia Power Company*List Not Exhaustive
- 14.2.1.1. Overview
- 14.2.1.2. Products
- 14.2.1.3. SWOT Analysis
- 14.2.1.4. Recent Developments
- 14.2.1.5. Financials (Based on Availability)
- 14.2.2 Siemens Energy AG
- 14.2.2.1. Overview
- 14.2.2.2. Products
- 14.2.2.3. SWOT Analysis
- 14.2.2.4. Recent Developments
- 14.2.2.5. Financials (Based on Availability)
- 14.2.3 Duke Energy Corporation
- 14.2.3.1. Overview
- 14.2.3.2. Products
- 14.2.3.3. SWOT Analysis
- 14.2.3.4. Recent Developments
- 14.2.3.5. Financials (Based on Availability)
- 14.2.4 Voith Gmb & Co KGaA
- 14.2.4.1. Overview
- 14.2.4.2. Products
- 14.2.4.3. SWOT Analysis
- 14.2.4.4. Recent Developments
- 14.2.4.5. Financials (Based on Availability)
- 14.2.5 GE Renewable Energy
- 14.2.5.1. Overview
- 14.2.5.2. Products
- 14.2.5.3. SWOT Analysis
- 14.2.5.4. Recent Developments
- 14.2.5.5. Financials (Based on Availability)
- 14.2.6 Andritz AG
- 14.2.6.1. Overview
- 14.2.6.2. Products
- 14.2.6.3. SWOT Analysis
- 14.2.6.4. Recent Developments
- 14.2.6.5. Financials (Based on Availability)
- 14.2.1 Georgia Power Company*List Not Exhaustive
List of Figures
- Figure 1: Global USA Hydropower Market Revenue Breakdown (Million, %) by Region 2024 & 2032
- Figure 2: Global USA Hydropower Market Volume Breakdown (Gigawatt, %) by Region 2024 & 2032
- Figure 3: North America USA Hydropower Market Revenue (Million), by Country 2024 & 2032
- Figure 4: North America USA Hydropower Market Volume (Gigawatt), by Country 2024 & 2032
- Figure 5: North America USA Hydropower Market Revenue Share (%), by Country 2024 & 2032
- Figure 6: North America USA Hydropower Market Volume Share (%), by Country 2024 & 2032
- Figure 7: North America USA Hydropower Market Revenue (Million), by Large Hydropower (Greater than 100 MW) 2024 & 2032
- Figure 8: North America USA Hydropower Market Volume (Gigawatt), by Large Hydropower (Greater than 100 MW) 2024 & 2032
- Figure 9: North America USA Hydropower Market Revenue Share (%), by Large Hydropower (Greater than 100 MW) 2024 & 2032
- Figure 10: North America USA Hydropower Market Volume Share (%), by Large Hydropower (Greater than 100 MW) 2024 & 2032
- Figure 11: North America USA Hydropower Market Revenue (Million), by Small Hydropower (Smaller than 10 MW) 2024 & 2032
- Figure 12: North America USA Hydropower Market Volume (Gigawatt), by Small Hydropower (Smaller than 10 MW) 2024 & 2032
- Figure 13: North America USA Hydropower Market Revenue Share (%), by Small Hydropower (Smaller than 10 MW) 2024 & 2032
- Figure 14: North America USA Hydropower Market Volume Share (%), by Small Hydropower (Smaller than 10 MW) 2024 & 2032
- Figure 15: North America USA Hydropower Market Revenue (Million), by Other Sizes (10-100 MW) 2024 & 2032
- Figure 16: North America USA Hydropower Market Volume (Gigawatt), by Other Sizes (10-100 MW) 2024 & 2032
- Figure 17: North America USA Hydropower Market Revenue Share (%), by Other Sizes (10-100 MW) 2024 & 2032
- Figure 18: North America USA Hydropower Market Volume Share (%), by Other Sizes (10-100 MW) 2024 & 2032
- Figure 19: North America USA Hydropower Market Revenue (Million), by Country 2024 & 2032
- Figure 20: North America USA Hydropower Market Volume (Gigawatt), by Country 2024 & 2032
- Figure 21: North America USA Hydropower Market Revenue Share (%), by Country 2024 & 2032
- Figure 22: North America USA Hydropower Market Volume Share (%), by Country 2024 & 2032
- Figure 23: South America USA Hydropower Market Revenue (Million), by Large Hydropower (Greater than 100 MW) 2024 & 2032
- Figure 24: South America USA Hydropower Market Volume (Gigawatt), by Large Hydropower (Greater than 100 MW) 2024 & 2032
- Figure 25: South America USA Hydropower Market Revenue Share (%), by Large Hydropower (Greater than 100 MW) 2024 & 2032
- Figure 26: South America USA Hydropower Market Volume Share (%), by Large Hydropower (Greater than 100 MW) 2024 & 2032
- Figure 27: South America USA Hydropower Market Revenue (Million), by Small Hydropower (Smaller than 10 MW) 2024 & 2032
- Figure 28: South America USA Hydropower Market Volume (Gigawatt), by Small Hydropower (Smaller than 10 MW) 2024 & 2032
- Figure 29: South America USA Hydropower Market Revenue Share (%), by Small Hydropower (Smaller than 10 MW) 2024 & 2032
- Figure 30: South America USA Hydropower Market Volume Share (%), by Small Hydropower (Smaller than 10 MW) 2024 & 2032
- Figure 31: South America USA Hydropower Market Revenue (Million), by Other Sizes (10-100 MW) 2024 & 2032
- Figure 32: South America USA Hydropower Market Volume (Gigawatt), by Other Sizes (10-100 MW) 2024 & 2032
- Figure 33: South America USA Hydropower Market Revenue Share (%), by Other Sizes (10-100 MW) 2024 & 2032
- Figure 34: South America USA Hydropower Market Volume Share (%), by Other Sizes (10-100 MW) 2024 & 2032
- Figure 35: South America USA Hydropower Market Revenue (Million), by Country 2024 & 2032
- Figure 36: South America USA Hydropower Market Volume (Gigawatt), by Country 2024 & 2032
- Figure 37: South America USA Hydropower Market Revenue Share (%), by Country 2024 & 2032
- Figure 38: South America USA Hydropower Market Volume Share (%), by Country 2024 & 2032
- Figure 39: Europe USA Hydropower Market Revenue (Million), by Large Hydropower (Greater than 100 MW) 2024 & 2032
- Figure 40: Europe USA Hydropower Market Volume (Gigawatt), by Large Hydropower (Greater than 100 MW) 2024 & 2032
- Figure 41: Europe USA Hydropower Market Revenue Share (%), by Large Hydropower (Greater than 100 MW) 2024 & 2032
- Figure 42: Europe USA Hydropower Market Volume Share (%), by Large Hydropower (Greater than 100 MW) 2024 & 2032
- Figure 43: Europe USA Hydropower Market Revenue (Million), by Small Hydropower (Smaller than 10 MW) 2024 & 2032
- Figure 44: Europe USA Hydropower Market Volume (Gigawatt), by Small Hydropower (Smaller than 10 MW) 2024 & 2032
- Figure 45: Europe USA Hydropower Market Revenue Share (%), by Small Hydropower (Smaller than 10 MW) 2024 & 2032
- Figure 46: Europe USA Hydropower Market Volume Share (%), by Small Hydropower (Smaller than 10 MW) 2024 & 2032
- Figure 47: Europe USA Hydropower Market Revenue (Million), by Other Sizes (10-100 MW) 2024 & 2032
- Figure 48: Europe USA Hydropower Market Volume (Gigawatt), by Other Sizes (10-100 MW) 2024 & 2032
- Figure 49: Europe USA Hydropower Market Revenue Share (%), by Other Sizes (10-100 MW) 2024 & 2032
- Figure 50: Europe USA Hydropower Market Volume Share (%), by Other Sizes (10-100 MW) 2024 & 2032
- Figure 51: Europe USA Hydropower Market Revenue (Million), by Country 2024 & 2032
- Figure 52: Europe USA Hydropower Market Volume (Gigawatt), by Country 2024 & 2032
- Figure 53: Europe USA Hydropower Market Revenue Share (%), by Country 2024 & 2032
- Figure 54: Europe USA Hydropower Market Volume Share (%), by Country 2024 & 2032
- Figure 55: Middle East & Africa USA Hydropower Market Revenue (Million), by Large Hydropower (Greater than 100 MW) 2024 & 2032
- Figure 56: Middle East & Africa USA Hydropower Market Volume (Gigawatt), by Large Hydropower (Greater than 100 MW) 2024 & 2032
- Figure 57: Middle East & Africa USA Hydropower Market Revenue Share (%), by Large Hydropower (Greater than 100 MW) 2024 & 2032
- Figure 58: Middle East & Africa USA Hydropower Market Volume Share (%), by Large Hydropower (Greater than 100 MW) 2024 & 2032
- Figure 59: Middle East & Africa USA Hydropower Market Revenue (Million), by Small Hydropower (Smaller than 10 MW) 2024 & 2032
- Figure 60: Middle East & Africa USA Hydropower Market Volume (Gigawatt), by Small Hydropower (Smaller than 10 MW) 2024 & 2032
- Figure 61: Middle East & Africa USA Hydropower Market Revenue Share (%), by Small Hydropower (Smaller than 10 MW) 2024 & 2032
- Figure 62: Middle East & Africa USA Hydropower Market Volume Share (%), by Small Hydropower (Smaller than 10 MW) 2024 & 2032
- Figure 63: Middle East & Africa USA Hydropower Market Revenue (Million), by Other Sizes (10-100 MW) 2024 & 2032
- Figure 64: Middle East & Africa USA Hydropower Market Volume (Gigawatt), by Other Sizes (10-100 MW) 2024 & 2032
- Figure 65: Middle East & Africa USA Hydropower Market Revenue Share (%), by Other Sizes (10-100 MW) 2024 & 2032
- Figure 66: Middle East & Africa USA Hydropower Market Volume Share (%), by Other Sizes (10-100 MW) 2024 & 2032
- Figure 67: Middle East & Africa USA Hydropower Market Revenue (Million), by Country 2024 & 2032
- Figure 68: Middle East & Africa USA Hydropower Market Volume (Gigawatt), by Country 2024 & 2032
- Figure 69: Middle East & Africa USA Hydropower Market Revenue Share (%), by Country 2024 & 2032
- Figure 70: Middle East & Africa USA Hydropower Market Volume Share (%), by Country 2024 & 2032
- Figure 71: Asia Pacific USA Hydropower Market Revenue (Million), by Large Hydropower (Greater than 100 MW) 2024 & 2032
- Figure 72: Asia Pacific USA Hydropower Market Volume (Gigawatt), by Large Hydropower (Greater than 100 MW) 2024 & 2032
- Figure 73: Asia Pacific USA Hydropower Market Revenue Share (%), by Large Hydropower (Greater than 100 MW) 2024 & 2032
- Figure 74: Asia Pacific USA Hydropower Market Volume Share (%), by Large Hydropower (Greater than 100 MW) 2024 & 2032
- Figure 75: Asia Pacific USA Hydropower Market Revenue (Million), by Small Hydropower (Smaller than 10 MW) 2024 & 2032
- Figure 76: Asia Pacific USA Hydropower Market Volume (Gigawatt), by Small Hydropower (Smaller than 10 MW) 2024 & 2032
- Figure 77: Asia Pacific USA Hydropower Market Revenue Share (%), by Small Hydropower (Smaller than 10 MW) 2024 & 2032
- Figure 78: Asia Pacific USA Hydropower Market Volume Share (%), by Small Hydropower (Smaller than 10 MW) 2024 & 2032
- Figure 79: Asia Pacific USA Hydropower Market Revenue (Million), by Other Sizes (10-100 MW) 2024 & 2032
- Figure 80: Asia Pacific USA Hydropower Market Volume (Gigawatt), by Other Sizes (10-100 MW) 2024 & 2032
- Figure 81: Asia Pacific USA Hydropower Market Revenue Share (%), by Other Sizes (10-100 MW) 2024 & 2032
- Figure 82: Asia Pacific USA Hydropower Market Volume Share (%), by Other Sizes (10-100 MW) 2024 & 2032
- Figure 83: Asia Pacific USA Hydropower Market Revenue (Million), by Country 2024 & 2032
- Figure 84: Asia Pacific USA Hydropower Market Volume (Gigawatt), by Country 2024 & 2032
- Figure 85: Asia Pacific USA Hydropower Market Revenue Share (%), by Country 2024 & 2032
- Figure 86: Asia Pacific USA Hydropower Market Volume Share (%), by Country 2024 & 2032
List of Tables
- Table 1: Global USA Hydropower Market Revenue Million Forecast, by Region 2019 & 2032
- Table 2: Global USA Hydropower Market Volume Gigawatt Forecast, by Region 2019 & 2032
- Table 3: Global USA Hydropower Market Revenue Million Forecast, by Large Hydropower (Greater than 100 MW) 2019 & 2032
- Table 4: Global USA Hydropower Market Volume Gigawatt Forecast, by Large Hydropower (Greater than 100 MW) 2019 & 2032
- Table 5: Global USA Hydropower Market Revenue Million Forecast, by Small Hydropower (Smaller than 10 MW) 2019 & 2032
- Table 6: Global USA Hydropower Market Volume Gigawatt Forecast, by Small Hydropower (Smaller than 10 MW) 2019 & 2032
- Table 7: Global USA Hydropower Market Revenue Million Forecast, by Other Sizes (10-100 MW) 2019 & 2032
- Table 8: Global USA Hydropower Market Volume Gigawatt Forecast, by Other Sizes (10-100 MW) 2019 & 2032
- Table 9: Global USA Hydropower Market Revenue Million Forecast, by Region 2019 & 2032
- Table 10: Global USA Hydropower Market Volume Gigawatt Forecast, by Region 2019 & 2032
- Table 11: Global USA Hydropower Market Revenue Million Forecast, by Country 2019 & 2032
- Table 12: Global USA Hydropower Market Volume Gigawatt Forecast, by Country 2019 & 2032
- Table 13: United States USA Hydropower Market Revenue (Million) Forecast, by Application 2019 & 2032
- Table 14: United States USA Hydropower Market Volume (Gigawatt) Forecast, by Application 2019 & 2032
- Table 15: Canada USA Hydropower Market Revenue (Million) Forecast, by Application 2019 & 2032
- Table 16: Canada USA Hydropower Market Volume (Gigawatt) Forecast, by Application 2019 & 2032
- Table 17: Mexico USA Hydropower Market Revenue (Million) Forecast, by Application 2019 & 2032
- Table 18: Mexico USA Hydropower Market Volume (Gigawatt) Forecast, by Application 2019 & 2032
- Table 19: Global USA Hydropower Market Revenue Million Forecast, by Large Hydropower (Greater than 100 MW) 2019 & 2032
- Table 20: Global USA Hydropower Market Volume Gigawatt Forecast, by Large Hydropower (Greater than 100 MW) 2019 & 2032
- Table 21: Global USA Hydropower Market Revenue Million Forecast, by Small Hydropower (Smaller than 10 MW) 2019 & 2032
- Table 22: Global USA Hydropower Market Volume Gigawatt Forecast, by Small Hydropower (Smaller than 10 MW) 2019 & 2032
- Table 23: Global USA Hydropower Market Revenue Million Forecast, by Other Sizes (10-100 MW) 2019 & 2032
- Table 24: Global USA Hydropower Market Volume Gigawatt Forecast, by Other Sizes (10-100 MW) 2019 & 2032
- Table 25: Global USA Hydropower Market Revenue Million Forecast, by Country 2019 & 2032
- Table 26: Global USA Hydropower Market Volume Gigawatt Forecast, by Country 2019 & 2032
- Table 27: United States USA Hydropower Market Revenue (Million) Forecast, by Application 2019 & 2032
- Table 28: United States USA Hydropower Market Volume (Gigawatt) Forecast, by Application 2019 & 2032
- Table 29: Canada USA Hydropower Market Revenue (Million) Forecast, by Application 2019 & 2032
- Table 30: Canada USA Hydropower Market Volume (Gigawatt) Forecast, by Application 2019 & 2032
- Table 31: Mexico USA Hydropower Market Revenue (Million) Forecast, by Application 2019 & 2032
- Table 32: Mexico USA Hydropower Market Volume (Gigawatt) Forecast, by Application 2019 & 2032
- Table 33: Global USA Hydropower Market Revenue Million Forecast, by Large Hydropower (Greater than 100 MW) 2019 & 2032
- Table 34: Global USA Hydropower Market Volume Gigawatt Forecast, by Large Hydropower (Greater than 100 MW) 2019 & 2032
- Table 35: Global USA Hydropower Market Revenue Million Forecast, by Small Hydropower (Smaller than 10 MW) 2019 & 2032
- Table 36: Global USA Hydropower Market Volume Gigawatt Forecast, by Small Hydropower (Smaller than 10 MW) 2019 & 2032
- Table 37: Global USA Hydropower Market Revenue Million Forecast, by Other Sizes (10-100 MW) 2019 & 2032
- Table 38: Global USA Hydropower Market Volume Gigawatt Forecast, by Other Sizes (10-100 MW) 2019 & 2032
- Table 39: Global USA Hydropower Market Revenue Million Forecast, by Country 2019 & 2032
- Table 40: Global USA Hydropower Market Volume Gigawatt Forecast, by Country 2019 & 2032
- Table 41: Brazil USA Hydropower Market Revenue (Million) Forecast, by Application 2019 & 2032
- Table 42: Brazil USA Hydropower Market Volume (Gigawatt) Forecast, by Application 2019 & 2032
- Table 43: Argentina USA Hydropower Market Revenue (Million) Forecast, by Application 2019 & 2032
- Table 44: Argentina USA Hydropower Market Volume (Gigawatt) Forecast, by Application 2019 & 2032
- Table 45: Rest of South America USA Hydropower Market Revenue (Million) Forecast, by Application 2019 & 2032
- Table 46: Rest of South America USA Hydropower Market Volume (Gigawatt) Forecast, by Application 2019 & 2032
- Table 47: Global USA Hydropower Market Revenue Million Forecast, by Large Hydropower (Greater than 100 MW) 2019 & 2032
- Table 48: Global USA Hydropower Market Volume Gigawatt Forecast, by Large Hydropower (Greater than 100 MW) 2019 & 2032
- Table 49: Global USA Hydropower Market Revenue Million Forecast, by Small Hydropower (Smaller than 10 MW) 2019 & 2032
- Table 50: Global USA Hydropower Market Volume Gigawatt Forecast, by Small Hydropower (Smaller than 10 MW) 2019 & 2032
- Table 51: Global USA Hydropower Market Revenue Million Forecast, by Other Sizes (10-100 MW) 2019 & 2032
- Table 52: Global USA Hydropower Market Volume Gigawatt Forecast, by Other Sizes (10-100 MW) 2019 & 2032
- Table 53: Global USA Hydropower Market Revenue Million Forecast, by Country 2019 & 2032
- Table 54: Global USA Hydropower Market Volume Gigawatt Forecast, by Country 2019 & 2032
- Table 55: United Kingdom USA Hydropower Market Revenue (Million) Forecast, by Application 2019 & 2032
- Table 56: United Kingdom USA Hydropower Market Volume (Gigawatt) Forecast, by Application 2019 & 2032
- Table 57: Germany USA Hydropower Market Revenue (Million) Forecast, by Application 2019 & 2032
- Table 58: Germany USA Hydropower Market Volume (Gigawatt) Forecast, by Application 2019 & 2032
- Table 59: France USA Hydropower Market Revenue (Million) Forecast, by Application 2019 & 2032
- Table 60: France USA Hydropower Market Volume (Gigawatt) Forecast, by Application 2019 & 2032
- Table 61: Italy USA Hydropower Market Revenue (Million) Forecast, by Application 2019 & 2032
- Table 62: Italy USA Hydropower Market Volume (Gigawatt) Forecast, by Application 2019 & 2032
- Table 63: Spain USA Hydropower Market Revenue (Million) Forecast, by Application 2019 & 2032
- Table 64: Spain USA Hydropower Market Volume (Gigawatt) Forecast, by Application 2019 & 2032
- Table 65: Russia USA Hydropower Market Revenue (Million) Forecast, by Application 2019 & 2032
- Table 66: Russia USA Hydropower Market Volume (Gigawatt) Forecast, by Application 2019 & 2032
- Table 67: Benelux USA Hydropower Market Revenue (Million) Forecast, by Application 2019 & 2032
- Table 68: Benelux USA Hydropower Market Volume (Gigawatt) Forecast, by Application 2019 & 2032
- Table 69: Nordics USA Hydropower Market Revenue (Million) Forecast, by Application 2019 & 2032
- Table 70: Nordics USA Hydropower Market Volume (Gigawatt) Forecast, by Application 2019 & 2032
- Table 71: Rest of Europe USA Hydropower Market Revenue (Million) Forecast, by Application 2019 & 2032
- Table 72: Rest of Europe USA Hydropower Market Volume (Gigawatt) Forecast, by Application 2019 & 2032
- Table 73: Global USA Hydropower Market Revenue Million Forecast, by Large Hydropower (Greater than 100 MW) 2019 & 2032
- Table 74: Global USA Hydropower Market Volume Gigawatt Forecast, by Large Hydropower (Greater than 100 MW) 2019 & 2032
- Table 75: Global USA Hydropower Market Revenue Million Forecast, by Small Hydropower (Smaller than 10 MW) 2019 & 2032
- Table 76: Global USA Hydropower Market Volume Gigawatt Forecast, by Small Hydropower (Smaller than 10 MW) 2019 & 2032
- Table 77: Global USA Hydropower Market Revenue Million Forecast, by Other Sizes (10-100 MW) 2019 & 2032
- Table 78: Global USA Hydropower Market Volume Gigawatt Forecast, by Other Sizes (10-100 MW) 2019 & 2032
- Table 79: Global USA Hydropower Market Revenue Million Forecast, by Country 2019 & 2032
- Table 80: Global USA Hydropower Market Volume Gigawatt Forecast, by Country 2019 & 2032
- Table 81: Turkey USA Hydropower Market Revenue (Million) Forecast, by Application 2019 & 2032
- Table 82: Turkey USA Hydropower Market Volume (Gigawatt) Forecast, by Application 2019 & 2032
- Table 83: Israel USA Hydropower Market Revenue (Million) Forecast, by Application 2019 & 2032
- Table 84: Israel USA Hydropower Market Volume (Gigawatt) Forecast, by Application 2019 & 2032
- Table 85: GCC USA Hydropower Market Revenue (Million) Forecast, by Application 2019 & 2032
- Table 86: GCC USA Hydropower Market Volume (Gigawatt) Forecast, by Application 2019 & 2032
- Table 87: North Africa USA Hydropower Market Revenue (Million) Forecast, by Application 2019 & 2032
- Table 88: North Africa USA Hydropower Market Volume (Gigawatt) Forecast, by Application 2019 & 2032
- Table 89: South Africa USA Hydropower Market Revenue (Million) Forecast, by Application 2019 & 2032
- Table 90: South Africa USA Hydropower Market Volume (Gigawatt) Forecast, by Application 2019 & 2032
- Table 91: Rest of Middle East & Africa USA Hydropower Market Revenue (Million) Forecast, by Application 2019 & 2032
- Table 92: Rest of Middle East & Africa USA Hydropower Market Volume (Gigawatt) Forecast, by Application 2019 & 2032
- Table 93: Global USA Hydropower Market Revenue Million Forecast, by Large Hydropower (Greater than 100 MW) 2019 & 2032
- Table 94: Global USA Hydropower Market Volume Gigawatt Forecast, by Large Hydropower (Greater than 100 MW) 2019 & 2032
- Table 95: Global USA Hydropower Market Revenue Million Forecast, by Small Hydropower (Smaller than 10 MW) 2019 & 2032
- Table 96: Global USA Hydropower Market Volume Gigawatt Forecast, by Small Hydropower (Smaller than 10 MW) 2019 & 2032
- Table 97: Global USA Hydropower Market Revenue Million Forecast, by Other Sizes (10-100 MW) 2019 & 2032
- Table 98: Global USA Hydropower Market Volume Gigawatt Forecast, by Other Sizes (10-100 MW) 2019 & 2032
- Table 99: Global USA Hydropower Market Revenue Million Forecast, by Country 2019 & 2032
- Table 100: Global USA Hydropower Market Volume Gigawatt Forecast, by Country 2019 & 2032
- Table 101: China USA Hydropower Market Revenue (Million) Forecast, by Application 2019 & 2032
- Table 102: China USA Hydropower Market Volume (Gigawatt) Forecast, by Application 2019 & 2032
- Table 103: India USA Hydropower Market Revenue (Million) Forecast, by Application 2019 & 2032
- Table 104: India USA Hydropower Market Volume (Gigawatt) Forecast, by Application 2019 & 2032
- Table 105: Japan USA Hydropower Market Revenue (Million) Forecast, by Application 2019 & 2032
- Table 106: Japan USA Hydropower Market Volume (Gigawatt) Forecast, by Application 2019 & 2032
- Table 107: South Korea USA Hydropower Market Revenue (Million) Forecast, by Application 2019 & 2032
- Table 108: South Korea USA Hydropower Market Volume (Gigawatt) Forecast, by Application 2019 & 2032
- Table 109: ASEAN USA Hydropower Market Revenue (Million) Forecast, by Application 2019 & 2032
- Table 110: ASEAN USA Hydropower Market Volume (Gigawatt) Forecast, by Application 2019 & 2032
- Table 111: Oceania USA Hydropower Market Revenue (Million) Forecast, by Application 2019 & 2032
- Table 112: Oceania USA Hydropower Market Volume (Gigawatt) Forecast, by Application 2019 & 2032
- Table 113: Rest of Asia Pacific USA Hydropower Market Revenue (Million) Forecast, by Application 2019 & 2032
- Table 114: Rest of Asia Pacific USA Hydropower Market Volume (Gigawatt) Forecast, by Application 2019 & 2032
Frequently Asked Questions
1. What is the projected Compound Annual Growth Rate (CAGR) of the USA Hydropower Market?
The projected CAGR is approximately > 4.00%.
2. Which companies are prominent players in the USA Hydropower Market?
Key companies in the market include Georgia Power Company*List Not Exhaustive, Siemens Energy AG, Duke Energy Corporation, Voith Gmb & Co KGaA, GE Renewable Energy, Andritz AG.
3. What are the main segments of the USA Hydropower Market?
The market segments include Large Hydropower (Greater than 100 MW), Small Hydropower (Smaller than 10 MW), Other Sizes (10-100 MW).
4. Can you provide details about the market size?
The market size is estimated to be USD XX Million as of 2022.
5. What are some drivers contributing to market growth?
4.; Increasing LNG Trade4.; Rising Marine Transportation.
6. What are the notable trends driving market growth?
Large Scale Hydropower to Dominate.
7. Are there any restraints impacting market growth?
4.; Fluctuations in Crude Oil Prices.
8. Can you provide examples of recent developments in the market?
In February 2021, SNC Lavalin Group recieved an engineering services contract for three hydroelectric projects from Rye Development LLC to add powerhouses to the existing dam and lock facilities at each of the sites.
9. What pricing options are available for accessing the report?
Pricing options include single-user, multi-user, and enterprise licenses priced at USD 3800, USD 4500, and USD 5800 respectively.
10. Is the market size provided in terms of value or volume?
The market size is provided in terms of value, measured in Million and volume, measured in Gigawatt.
11. Are there any specific market keywords associated with the report?
Yes, the market keyword associated with the report is "USA Hydropower Market," which aids in identifying and referencing the specific market segment covered.
12. How do I determine which pricing option suits my needs best?
The pricing options vary based on user requirements and access needs. Individual users may opt for single-user licenses, while businesses requiring broader access may choose multi-user or enterprise licenses for cost-effective access to the report.
13. Are there any additional resources or data provided in the USA Hydropower Market report?
While the report offers comprehensive insights, it's advisable to review the specific contents or supplementary materials provided to ascertain if additional resources or data are available.
14. How can I stay updated on further developments or reports in the USA Hydropower Market?
To stay informed about further developments, trends, and reports in the USA Hydropower Market, consider subscribing to industry newsletters, following relevant companies and organizations, or regularly checking reputable industry news sources and publications.
Methodology
Step 1 - Identification of Relevant Samples Size from Population Database


Step 2 - Approaches for Defining Global Market Size (Value, Volume* & Price*)

Note*: In applicable scenarios
Step 3 - Data Sources
Primary Research
- Web Analytics
- Survey Reports
- Research Institute
- Latest Research Reports
- Opinion Leaders
Secondary Research
- Annual Reports
- White Paper
- Latest Press Release
- Industry Association
- Paid Database
- Investor Presentations

Step 4 - Data Triangulation
Involves using different sources of information in order to increase the validity of a study
These sources are likely to be stakeholders in a program - participants, other researchers, program staff, other community members, and so on.
Then we put all data in single framework & apply various statistical tools to find out the dynamic on the market.
During the analysis stage, feedback from the stakeholder groups would be compared to determine areas of agreement as well as areas of divergence


