
Key Insights
The global Electroencephalography (EEG) Systems/Devices market is experiencing robust growth, projected to reach a substantial market size driven by several key factors. The increasing prevalence of neurological disorders like epilepsy, sleep disorders, and traumatic brain injuries fuels demand for accurate and efficient EEG diagnostic tools. Technological advancements, including portable and wireless EEG systems, are enhancing accessibility and patient comfort, contributing significantly to market expansion. Furthermore, the rising adoption of EEG in research settings, particularly in neuroscience and brain-computer interfaces, is creating new avenues for growth. The market is segmented by device type (portable and standalone) and end-user (hospitals, diagnostic centers, and others), with hospitals currently holding the largest market share due to their established infrastructure and expertise in EEG interpretation. Competitive landscape analysis reveals a mix of established players and emerging innovators, fostering innovation and driving market competitiveness. While regulatory hurdles and high initial investment costs pose some restraints, the overall market outlook remains positive, indicating continued growth throughout the forecast period.
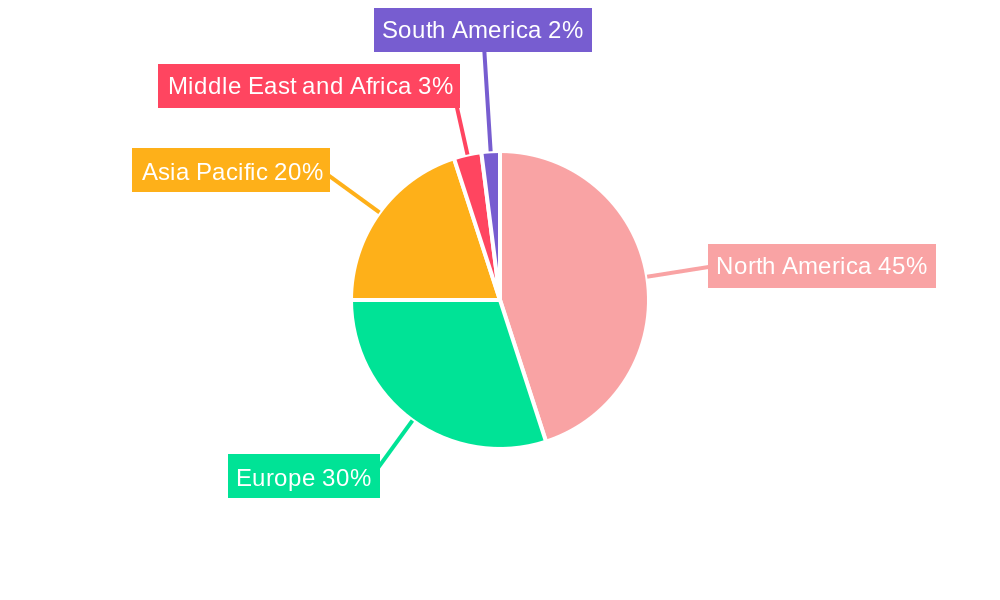
The North American region currently dominates the EEG Systems/Devices market, owing to high healthcare expenditure, advanced infrastructure, and a large patient population. However, the Asia Pacific region is poised for significant growth, propelled by increasing healthcare awareness, rising disposable incomes, and expanding healthcare infrastructure in developing economies like India and China. Europe also holds a substantial market share, driven by advancements in healthcare technology and a well-established healthcare system. The market is expected to witness further regional diversification as emerging economies witness increased adoption of sophisticated EEG technology. The continued focus on improving diagnostic accuracy, developing user-friendly interfaces, and expanding applications of EEG technology will further shape the future trajectory of this dynamic market. Strategies focused on technological innovation, strategic partnerships, and expansion into emerging markets will be crucial for companies seeking to capitalize on this significant growth opportunity.
Electroencephalography (EEG) Systems/Devices Market Report: 2019-2033
This comprehensive report provides an in-depth analysis of the global Electroencephalography (EEG) Systems/Devices market, covering the period from 2019 to 2033. It offers actionable insights for industry professionals, investors, and stakeholders seeking to understand the market's dynamics, growth drivers, and future potential. The report leverages extensive market research and data analysis to deliver a clear and concise overview of this rapidly evolving sector. The base year for this report is 2025, with estimates for 2025 and a forecast extending to 2033. The historical period covered is 2019-2024. The market is segmented by type (Portable Device, Standalone Device) and end-user (Hospitals, Diagnostic Centers, Others).
Electroencephalography Systems/Devices Market Market Structure & Innovation Trends
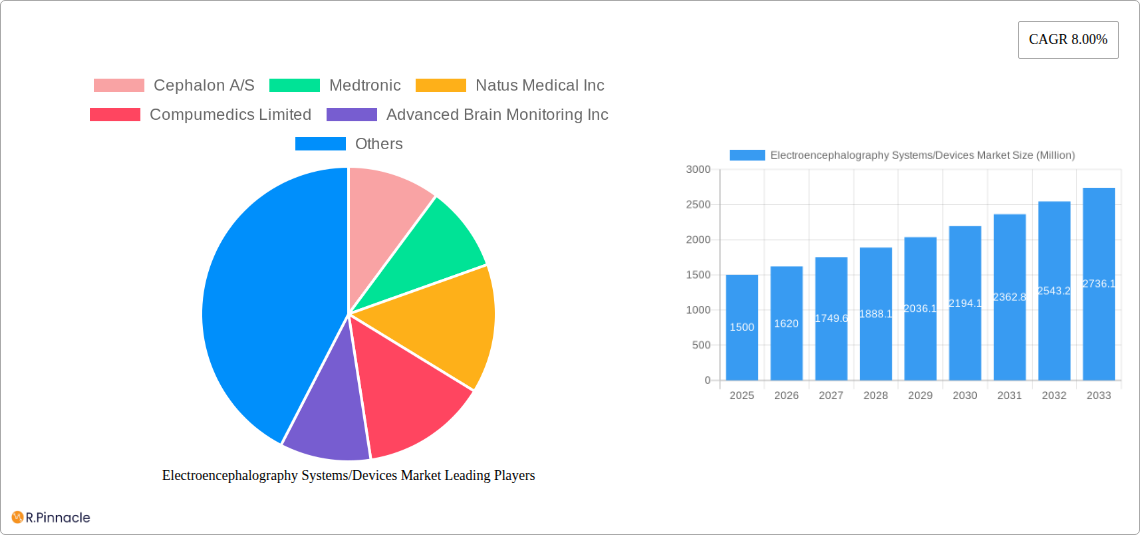
The global EEG systems/devices market exhibits a moderately consolidated structure, with several key players holding significant market share. Market concentration is influenced by factors including technological advancements, regulatory approvals, and the ongoing mergers and acquisitions (M&A) activities within the sector. The market share held by the top five players is estimated at xx%, indicating a competitive landscape with room for both established players and emerging innovators. M&A deals within this sector often involve strategic partnerships aimed at expanding product portfolios, enhancing technological capabilities, and entering new geographic markets. The total value of M&A deals in the last five years has been estimated at approximately $xx Million.
- Innovation Drivers: Miniaturization, improved signal processing, integration with AI/ML, wireless capabilities, and enhanced portability are key drivers of innovation.
- Regulatory Frameworks: Stringent regulatory approvals (e.g., FDA clearance) significantly impact market entry and growth.
- Product Substitutes: While EEG remains a core technology, advancements in other neuroimaging modalities present some competitive pressure.
- End-User Demographics: The aging population and rising prevalence of neurological disorders are driving market growth, particularly within hospitals and diagnostic centers.
- M&A Activity: Strategic acquisitions and partnerships are reshaping the market landscape, driving consolidation and technological innovation. Examples include (specific examples need further research to include real values and companies involved).
Electroencephalography Systems/Devices Market Market Dynamics & Trends
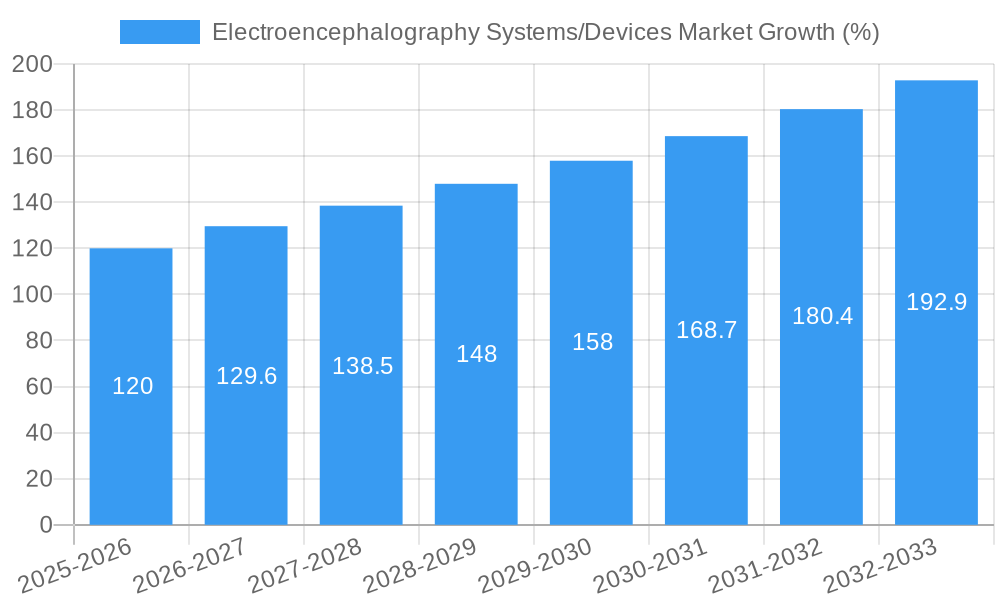
The EEG systems/devices market is experiencing robust growth, driven by a confluence of factors. Technological advancements, particularly in signal processing and AI-powered diagnostics, are enhancing the accuracy and efficiency of EEG technology, making it more accessible and valuable to healthcare professionals. This is resulting in increased market penetration, with a CAGR of xx% projected from 2025 to 2033. Consumer preferences are shifting towards portable and user-friendly devices, fueling demand for compact, wireless EEG systems. The rising prevalence of neurological and sleep disorders, coupled with an aging global population, is creating substantial demand for EEG diagnostic tools in hospitals and diagnostic centers. The competitive landscape is characterized by both established players and emerging companies developing innovative solutions and vying for market share. However, high initial investment costs and stringent regulatory requirements pose challenges to market expansion. The market is projected to reach $xx Million by 2033.
Dominant Regions & Segments in Electroencephalography Systems/Devices Market
North America currently holds the largest market share in the EEG systems/devices market. This dominance is primarily attributed to the high adoption rate of advanced medical technologies, robust healthcare infrastructure, and the prevalence of neurological disorders in the region. Europe also holds a significant market share. Asia-Pacific is expected to witness substantial growth during the forecast period, driven by rising healthcare expenditure and improving healthcare infrastructure.
- By Type: The standalone device segment dominates the market due to its advanced features and comprehensive diagnostic capabilities. However, the portable device segment is exhibiting faster growth, driven by increasing demand for convenient and easy-to-use EEG systems.
- By End User: Hospitals represent the largest segment, owing to their high diagnostic capabilities and extensive use of EEG technology. Diagnostic centers also contribute significantly.
Key Drivers for Regional Dominance:
- North America: High healthcare expenditure, advanced healthcare infrastructure, and strong regulatory frameworks.
- Europe: Established healthcare systems, technological advancements, and government initiatives to improve neurological care.
- Asia-Pacific: Rising healthcare expenditure, increasing prevalence of neurological disorders, and growing adoption of advanced medical technologies.
Electroencephalography Systems/Devices Market Product Innovations
Recent product developments focus on enhancing portability, improving data analysis capabilities through AI and machine learning, and integrating EEG systems with other neuroimaging modalities. This facilitates more comprehensive diagnostic assessments and personalized treatment plans. Wireless EEG systems with enhanced signal quality and user-friendly interfaces are gaining traction. The incorporation of cloud-based data storage and analysis further streamlines workflows and facilitates remote monitoring. These innovations are driving market growth by improving diagnostic accuracy, simplifying procedures, and enabling more accessible and efficient healthcare solutions.
Report Scope & Segmentation Analysis
By Type:
- Portable Device: This segment is characterized by its convenience and portability. The market size is estimated at $xx Million in 2025 and is projected to grow at a CAGR of xx% during the forecast period. Competitive dynamics are shaped by innovation in miniaturization and wireless connectivity.
- Standalone Device: This segment offers advanced features and high-quality diagnostic capabilities. The market size is estimated at $xx Million in 2025, and the segment's growth is driven by increasing demand for advanced diagnostic tools. Competition is intense among established players with advanced technology and robust distribution networks.
By End User:
- Hospitals: The largest segment, driven by the extensive use of EEG in various neurological and sleep disorder diagnoses and treatments. Market size is estimated at $xx Million in 2025 and is projected to grow at a CAGR of xx% driven by increasing adoption of advanced systems and technological improvements.
- Diagnostic Centers: This segment is experiencing significant growth as the demand for specialized diagnostic services increases. The market size is estimated at $xx Million in 2025, projected to grow at a CAGR of xx%. Competition is based on providing fast, reliable, and affordable services.
- Others: This includes research institutions and private clinics.
Key Drivers of Electroencephalography Systems/Devices Market Growth
The EEG systems/devices market is experiencing substantial growth due to technological advancements leading to improved accuracy and ease of use. The rising prevalence of neurological disorders like epilepsy and sleep apnea is significantly boosting market demand. Furthermore, supportive government initiatives and increasing healthcare expenditure are facilitating wider adoption of advanced diagnostic tools. The integration of AI and machine learning is improving diagnostic accuracy and efficiency, further driving market expansion.
Challenges in the Electroencephalography Systems/Devices Market Sector
The EEG systems/devices market faces challenges such as high initial investment costs and stringent regulatory hurdles for new product approvals. The complexity of EEG data analysis and the need for skilled professionals also pose limitations. Supply chain disruptions and the growing competition from other neuroimaging modalities are further adding to the challenges. The market size in 2025 is estimated at $xx Million and is projected to grow at a CAGR of xx% despite these challenges.
Emerging Opportunities in Electroencephalography Systems/Devices Market
Significant opportunities exist in the development of portable, wireless, and user-friendly EEG systems designed for home-based monitoring. The integration of AI and machine learning for automated data analysis presents vast potential to improve diagnostic accuracy and reduce healthcare costs. Expanding into emerging markets with high prevalence of neurological disorders and growing healthcare expenditure also creates considerable opportunities. New applications of EEG technology in fields like brain-computer interfaces and virtual reality offer exciting future avenues.
Leading Players in the Electroencephalography Systems/Devices Market Market
- Cephalon A/S
- Medtronic (Medtronic)
- Natus Medical Inc (Natus Medical Inc)
- Compumedics Limited (Compumedics Limited)
- Advanced Brain Monitoring Inc
- Cadwell Industries Inc
- Fresenius SE & Co KGaA (Fresenius SE & Co KGaA)
- General Electric Company (GE Healthcare) (GE Healthcare)
- NeuroWave Systems Inc
- Koninklijke Philips N V (Philips Healthcare) (Philips Healthcare)
- Nihon Kohden Corporation (Nihon Kohden Corporation)
Key Developments in Electroencephalography Systems/Devices Market Industry
- March 2022: Interaxon Inc. launched a VR Software Development Kit (SDK) and a new EEG headband compatible with major VR headsets.
- September 2022: Ceribell, Inc. received FDA Breakthrough Device Designation for its AI-powered delirium detection system using EEG signals.
Future Outlook for Electroencephalography Systems/Devices Market Market
The EEG systems/devices market is poised for continued growth, fueled by technological innovations, rising prevalence of neurological disorders, and increasing healthcare expenditure. The integration of AI and machine learning will further enhance diagnostic capabilities and drive market expansion. The development of user-friendly and portable devices will broaden market accessibility. Strategic partnerships and acquisitions will further shape the competitive landscape and accelerate innovation. The market shows strong promise for significant growth and the emergence of new applications in diverse healthcare settings.
Electroencephalography Systems/Devices Market Segmentation
-
1. Type
- 1.1. Portable Device
- 1.2. Standalone Device
-
2. End User
- 2.1. Hospitals
- 2.2. Diagnostic Centers
- 2.3. Others
Electroencephalography Systems/Devices Market Segmentation By Geography
-
1. North America
- 1.1. United States
- 1.2. Canada
- 1.3. Mexico
-
2. Europe
- 2.1. Germany
- 2.2. United Kingdom
- 2.3. France
- 2.4. Italy
- 2.5. Spain
- 2.6. Rest of Europe
-
3. Asia Pacific
- 3.1. China
- 3.2. Japan
- 3.3. India
- 3.4. Australia
- 3.5. South Korea
- 3.6. Rest of Asia Pacific
-
4. Middle East and Africa
- 4.1. GCC
- 4.2. South Africa
- 4.3. Rest of Middle East and Africa
-
5. South America
- 5.1. Brazil
- 5.2. Argentina
- 5.3. Rest of South America
Electroencephalography Systems/Devices Market REPORT HIGHLIGHTS
| Aspects | Details |
|---|---|
| Study Period | 2019-2033 |
| Base Year | 2024 |
| Estimated Year | 2025 |
| Forecast Period | 2025-2033 |
| Historical Period | 2019-2024 |
| Growth Rate | CAGR of 8.00% from 2019-2033 |
| Segmentation |
|
Table of Contents
- 1. Introduction
- 1.1. Research Scope
- 1.2. Market Segmentation
- 1.3. Research Methodology
- 1.4. Definitions and Assumptions
- 2. Executive Summary
- 2.1. Introduction
- 3. Market Dynamics
- 3.1. Introduction
- 3.2. Market Drivers
- 3.2.1. Rising R&D Expenditure; Increasing Prevalence of Neurological Disorders
- 3.3. Market Restrains
- 3.3.1. Limitation of Electroencephalography System
- 3.4. Market Trends
- 3.4.1. Standalone Electroencephalography System is Expected to Witness a Healthy Growth in Future
- 4. Market Factor Analysis
- 4.1. Porters Five Forces
- 4.2. Supply/Value Chain
- 4.3. PESTEL analysis
- 4.4. Market Entropy
- 4.5. Patent/Trademark Analysis
- 5. Global Electroencephalography Systems/Devices Market Analysis, Insights and Forecast, 2019-2031
- 5.1. Market Analysis, Insights and Forecast - by Type
- 5.1.1. Portable Device
- 5.1.2. Standalone Device
- 5.2. Market Analysis, Insights and Forecast - by End User
- 5.2.1. Hospitals
- 5.2.2. Diagnostic Centers
- 5.2.3. Others
- 5.3. Market Analysis, Insights and Forecast - by Region
- 5.3.1. North America
- 5.3.2. Europe
- 5.3.3. Asia Pacific
- 5.3.4. Middle East and Africa
- 5.3.5. South America
- 5.1. Market Analysis, Insights and Forecast - by Type
- 6. North America Electroencephalography Systems/Devices Market Analysis, Insights and Forecast, 2019-2031
- 6.1. Market Analysis, Insights and Forecast - by Type
- 6.1.1. Portable Device
- 6.1.2. Standalone Device
- 6.2. Market Analysis, Insights and Forecast - by End User
- 6.2.1. Hospitals
- 6.2.2. Diagnostic Centers
- 6.2.3. Others
- 6.1. Market Analysis, Insights and Forecast - by Type
- 7. Europe Electroencephalography Systems/Devices Market Analysis, Insights and Forecast, 2019-2031
- 7.1. Market Analysis, Insights and Forecast - by Type
- 7.1.1. Portable Device
- 7.1.2. Standalone Device
- 7.2. Market Analysis, Insights and Forecast - by End User
- 7.2.1. Hospitals
- 7.2.2. Diagnostic Centers
- 7.2.3. Others
- 7.1. Market Analysis, Insights and Forecast - by Type
- 8. Asia Pacific Electroencephalography Systems/Devices Market Analysis, Insights and Forecast, 2019-2031
- 8.1. Market Analysis, Insights and Forecast - by Type
- 8.1.1. Portable Device
- 8.1.2. Standalone Device
- 8.2. Market Analysis, Insights and Forecast - by End User
- 8.2.1. Hospitals
- 8.2.2. Diagnostic Centers
- 8.2.3. Others
- 8.1. Market Analysis, Insights and Forecast - by Type
- 9. Middle East and Africa Electroencephalography Systems/Devices Market Analysis, Insights and Forecast, 2019-2031
- 9.1. Market Analysis, Insights and Forecast - by Type
- 9.1.1. Portable Device
- 9.1.2. Standalone Device
- 9.2. Market Analysis, Insights and Forecast - by End User
- 9.2.1. Hospitals
- 9.2.2. Diagnostic Centers
- 9.2.3. Others
- 9.1. Market Analysis, Insights and Forecast - by Type
- 10. South America Electroencephalography Systems/Devices Market Analysis, Insights and Forecast, 2019-2031
- 10.1. Market Analysis, Insights and Forecast - by Type
- 10.1.1. Portable Device
- 10.1.2. Standalone Device
- 10.2. Market Analysis, Insights and Forecast - by End User
- 10.2.1. Hospitals
- 10.2.2. Diagnostic Centers
- 10.2.3. Others
- 10.1. Market Analysis, Insights and Forecast - by Type
- 11. North America Electroencephalography Systems/Devices Market Analysis, Insights and Forecast, 2019-2031
- 11.1. Market Analysis, Insights and Forecast - By Country/Sub-region
- 11.1.1 United States
- 11.1.2 Canada
- 11.1.3 Mexico
- 12. Europe Electroencephalography Systems/Devices Market Analysis, Insights and Forecast, 2019-2031
- 12.1. Market Analysis, Insights and Forecast - By Country/Sub-region
- 12.1.1 Germany
- 12.1.2 United Kingdom
- 12.1.3 France
- 12.1.4 Italy
- 12.1.5 Spain
- 12.1.6 Rest of Europe
- 13. Asia Pacific Electroencephalography Systems/Devices Market Analysis, Insights and Forecast, 2019-2031
- 13.1. Market Analysis, Insights and Forecast - By Country/Sub-region
- 13.1.1 China
- 13.1.2 Japan
- 13.1.3 India
- 13.1.4 Australia
- 13.1.5 South Korea
- 13.1.6 Rest of Asia Pacific
- 14. Middle East and Africa Electroencephalography Systems/Devices Market Analysis, Insights and Forecast, 2019-2031
- 14.1. Market Analysis, Insights and Forecast - By Country/Sub-region
- 14.1.1 GCC
- 14.1.2 South Africa
- 14.1.3 Rest of Middle East and Africa
- 15. South America Electroencephalography Systems/Devices Market Analysis, Insights and Forecast, 2019-2031
- 15.1. Market Analysis, Insights and Forecast - By Country/Sub-region
- 15.1.1 Brazil
- 15.1.2 Argentina
- 15.1.3 Rest of South America
- 16. Competitive Analysis
- 16.1. Global Market Share Analysis 2024
- 16.2. Company Profiles
- 16.2.1 Cephalon A/S
- 16.2.1.1. Overview
- 16.2.1.2. Products
- 16.2.1.3. SWOT Analysis
- 16.2.1.4. Recent Developments
- 16.2.1.5. Financials (Based on Availability)
- 16.2.2 Medtronic
- 16.2.2.1. Overview
- 16.2.2.2. Products
- 16.2.2.3. SWOT Analysis
- 16.2.2.4. Recent Developments
- 16.2.2.5. Financials (Based on Availability)
- 16.2.3 Natus Medical Inc
- 16.2.3.1. Overview
- 16.2.3.2. Products
- 16.2.3.3. SWOT Analysis
- 16.2.3.4. Recent Developments
- 16.2.3.5. Financials (Based on Availability)
- 16.2.4 Compumedics Limited
- 16.2.4.1. Overview
- 16.2.4.2. Products
- 16.2.4.3. SWOT Analysis
- 16.2.4.4. Recent Developments
- 16.2.4.5. Financials (Based on Availability)
- 16.2.5 Advanced Brain Monitoring Inc
- 16.2.5.1. Overview
- 16.2.5.2. Products
- 16.2.5.3. SWOT Analysis
- 16.2.5.4. Recent Developments
- 16.2.5.5. Financials (Based on Availability)
- 16.2.6 Cadwell Industries Inc
- 16.2.6.1. Overview
- 16.2.6.2. Products
- 16.2.6.3. SWOT Analysis
- 16.2.6.4. Recent Developments
- 16.2.6.5. Financials (Based on Availability)
- 16.2.7 Fresenius SE & Co KGaA
- 16.2.7.1. Overview
- 16.2.7.2. Products
- 16.2.7.3. SWOT Analysis
- 16.2.7.4. Recent Developments
- 16.2.7.5. Financials (Based on Availability)
- 16.2.8 General Electric Company (GE Healthcare)
- 16.2.8.1. Overview
- 16.2.8.2. Products
- 16.2.8.3. SWOT Analysis
- 16.2.8.4. Recent Developments
- 16.2.8.5. Financials (Based on Availability)
- 16.2.9 NeuroWave Systems Inc
- 16.2.9.1. Overview
- 16.2.9.2. Products
- 16.2.9.3. SWOT Analysis
- 16.2.9.4. Recent Developments
- 16.2.9.5. Financials (Based on Availability)
- 16.2.10 Koninklijke Philips N V (Philips Healthcare)
- 16.2.10.1. Overview
- 16.2.10.2. Products
- 16.2.10.3. SWOT Analysis
- 16.2.10.4. Recent Developments
- 16.2.10.5. Financials (Based on Availability)
- 16.2.11 Nihon Kohden Corporation
- 16.2.11.1. Overview
- 16.2.11.2. Products
- 16.2.11.3. SWOT Analysis
- 16.2.11.4. Recent Developments
- 16.2.11.5. Financials (Based on Availability)
- 16.2.1 Cephalon A/S
List of Figures
- Figure 1: Global Electroencephalography Systems/Devices Market Revenue Breakdown (Million, %) by Region 2024 & 2032
- Figure 2: Global Electroencephalography Systems/Devices Market Volume Breakdown (K Unit, %) by Region 2024 & 2032
- Figure 3: North America Electroencephalography Systems/Devices Market Revenue (Million), by Country 2024 & 2032
- Figure 4: North America Electroencephalography Systems/Devices Market Volume (K Unit), by Country 2024 & 2032
- Figure 5: North America Electroencephalography Systems/Devices Market Revenue Share (%), by Country 2024 & 2032
- Figure 6: North America Electroencephalography Systems/Devices Market Volume Share (%), by Country 2024 & 2032
- Figure 7: Europe Electroencephalography Systems/Devices Market Revenue (Million), by Country 2024 & 2032
- Figure 8: Europe Electroencephalography Systems/Devices Market Volume (K Unit), by Country 2024 & 2032
- Figure 9: Europe Electroencephalography Systems/Devices Market Revenue Share (%), by Country 2024 & 2032
- Figure 10: Europe Electroencephalography Systems/Devices Market Volume Share (%), by Country 2024 & 2032
- Figure 11: Asia Pacific Electroencephalography Systems/Devices Market Revenue (Million), by Country 2024 & 2032
- Figure 12: Asia Pacific Electroencephalography Systems/Devices Market Volume (K Unit), by Country 2024 & 2032
- Figure 13: Asia Pacific Electroencephalography Systems/Devices Market Revenue Share (%), by Country 2024 & 2032
- Figure 14: Asia Pacific Electroencephalography Systems/Devices Market Volume Share (%), by Country 2024 & 2032
- Figure 15: Middle East and Africa Electroencephalography Systems/Devices Market Revenue (Million), by Country 2024 & 2032
- Figure 16: Middle East and Africa Electroencephalography Systems/Devices Market Volume (K Unit), by Country 2024 & 2032
- Figure 17: Middle East and Africa Electroencephalography Systems/Devices Market Revenue Share (%), by Country 2024 & 2032
- Figure 18: Middle East and Africa Electroencephalography Systems/Devices Market Volume Share (%), by Country 2024 & 2032
- Figure 19: South America Electroencephalography Systems/Devices Market Revenue (Million), by Country 2024 & 2032
- Figure 20: South America Electroencephalography Systems/Devices Market Volume (K Unit), by Country 2024 & 2032
- Figure 21: South America Electroencephalography Systems/Devices Market Revenue Share (%), by Country 2024 & 2032
- Figure 22: South America Electroencephalography Systems/Devices Market Volume Share (%), by Country 2024 & 2032
- Figure 23: North America Electroencephalography Systems/Devices Market Revenue (Million), by Type 2024 & 2032
- Figure 24: North America Electroencephalography Systems/Devices Market Volume (K Unit), by Type 2024 & 2032
- Figure 25: North America Electroencephalography Systems/Devices Market Revenue Share (%), by Type 2024 & 2032
- Figure 26: North America Electroencephalography Systems/Devices Market Volume Share (%), by Type 2024 & 2032
- Figure 27: North America Electroencephalography Systems/Devices Market Revenue (Million), by End User 2024 & 2032
- Figure 28: North America Electroencephalography Systems/Devices Market Volume (K Unit), by End User 2024 & 2032
- Figure 29: North America Electroencephalography Systems/Devices Market Revenue Share (%), by End User 2024 & 2032
- Figure 30: North America Electroencephalography Systems/Devices Market Volume Share (%), by End User 2024 & 2032
- Figure 31: North America Electroencephalography Systems/Devices Market Revenue (Million), by Country 2024 & 2032
- Figure 32: North America Electroencephalography Systems/Devices Market Volume (K Unit), by Country 2024 & 2032
- Figure 33: North America Electroencephalography Systems/Devices Market Revenue Share (%), by Country 2024 & 2032
- Figure 34: North America Electroencephalography Systems/Devices Market Volume Share (%), by Country 2024 & 2032
- Figure 35: Europe Electroencephalography Systems/Devices Market Revenue (Million), by Type 2024 & 2032
- Figure 36: Europe Electroencephalography Systems/Devices Market Volume (K Unit), by Type 2024 & 2032
- Figure 37: Europe Electroencephalography Systems/Devices Market Revenue Share (%), by Type 2024 & 2032
- Figure 38: Europe Electroencephalography Systems/Devices Market Volume Share (%), by Type 2024 & 2032
- Figure 39: Europe Electroencephalography Systems/Devices Market Revenue (Million), by End User 2024 & 2032
- Figure 40: Europe Electroencephalography Systems/Devices Market Volume (K Unit), by End User 2024 & 2032
- Figure 41: Europe Electroencephalography Systems/Devices Market Revenue Share (%), by End User 2024 & 2032
- Figure 42: Europe Electroencephalography Systems/Devices Market Volume Share (%), by End User 2024 & 2032
- Figure 43: Europe Electroencephalography Systems/Devices Market Revenue (Million), by Country 2024 & 2032
- Figure 44: Europe Electroencephalography Systems/Devices Market Volume (K Unit), by Country 2024 & 2032
- Figure 45: Europe Electroencephalography Systems/Devices Market Revenue Share (%), by Country 2024 & 2032
- Figure 46: Europe Electroencephalography Systems/Devices Market Volume Share (%), by Country 2024 & 2032
- Figure 47: Asia Pacific Electroencephalography Systems/Devices Market Revenue (Million), by Type 2024 & 2032
- Figure 48: Asia Pacific Electroencephalography Systems/Devices Market Volume (K Unit), by Type 2024 & 2032
- Figure 49: Asia Pacific Electroencephalography Systems/Devices Market Revenue Share (%), by Type 2024 & 2032
- Figure 50: Asia Pacific Electroencephalography Systems/Devices Market Volume Share (%), by Type 2024 & 2032
- Figure 51: Asia Pacific Electroencephalography Systems/Devices Market Revenue (Million), by End User 2024 & 2032
- Figure 52: Asia Pacific Electroencephalography Systems/Devices Market Volume (K Unit), by End User 2024 & 2032
- Figure 53: Asia Pacific Electroencephalography Systems/Devices Market Revenue Share (%), by End User 2024 & 2032
- Figure 54: Asia Pacific Electroencephalography Systems/Devices Market Volume Share (%), by End User 2024 & 2032
- Figure 55: Asia Pacific Electroencephalography Systems/Devices Market Revenue (Million), by Country 2024 & 2032
- Figure 56: Asia Pacific Electroencephalography Systems/Devices Market Volume (K Unit), by Country 2024 & 2032
- Figure 57: Asia Pacific Electroencephalography Systems/Devices Market Revenue Share (%), by Country 2024 & 2032
- Figure 58: Asia Pacific Electroencephalography Systems/Devices Market Volume Share (%), by Country 2024 & 2032
- Figure 59: Middle East and Africa Electroencephalography Systems/Devices Market Revenue (Million), by Type 2024 & 2032
- Figure 60: Middle East and Africa Electroencephalography Systems/Devices Market Volume (K Unit), by Type 2024 & 2032
- Figure 61: Middle East and Africa Electroencephalography Systems/Devices Market Revenue Share (%), by Type 2024 & 2032
- Figure 62: Middle East and Africa Electroencephalography Systems/Devices Market Volume Share (%), by Type 2024 & 2032
- Figure 63: Middle East and Africa Electroencephalography Systems/Devices Market Revenue (Million), by End User 2024 & 2032
- Figure 64: Middle East and Africa Electroencephalography Systems/Devices Market Volume (K Unit), by End User 2024 & 2032
- Figure 65: Middle East and Africa Electroencephalography Systems/Devices Market Revenue Share (%), by End User 2024 & 2032
- Figure 66: Middle East and Africa Electroencephalography Systems/Devices Market Volume Share (%), by End User 2024 & 2032
- Figure 67: Middle East and Africa Electroencephalography Systems/Devices Market Revenue (Million), by Country 2024 & 2032
- Figure 68: Middle East and Africa Electroencephalography Systems/Devices Market Volume (K Unit), by Country 2024 & 2032
- Figure 69: Middle East and Africa Electroencephalography Systems/Devices Market Revenue Share (%), by Country 2024 & 2032
- Figure 70: Middle East and Africa Electroencephalography Systems/Devices Market Volume Share (%), by Country 2024 & 2032
- Figure 71: South America Electroencephalography Systems/Devices Market Revenue (Million), by Type 2024 & 2032
- Figure 72: South America Electroencephalography Systems/Devices Market Volume (K Unit), by Type 2024 & 2032
- Figure 73: South America Electroencephalography Systems/Devices Market Revenue Share (%), by Type 2024 & 2032
- Figure 74: South America Electroencephalography Systems/Devices Market Volume Share (%), by Type 2024 & 2032
- Figure 75: South America Electroencephalography Systems/Devices Market Revenue (Million), by End User 2024 & 2032
- Figure 76: South America Electroencephalography Systems/Devices Market Volume (K Unit), by End User 2024 & 2032
- Figure 77: South America Electroencephalography Systems/Devices Market Revenue Share (%), by End User 2024 & 2032
- Figure 78: South America Electroencephalography Systems/Devices Market Volume Share (%), by End User 2024 & 2032
- Figure 79: South America Electroencephalography Systems/Devices Market Revenue (Million), by Country 2024 & 2032
- Figure 80: South America Electroencephalography Systems/Devices Market Volume (K Unit), by Country 2024 & 2032
- Figure 81: South America Electroencephalography Systems/Devices Market Revenue Share (%), by Country 2024 & 2032
- Figure 82: South America Electroencephalography Systems/Devices Market Volume Share (%), by Country 2024 & 2032
List of Tables
- Table 1: Global Electroencephalography Systems/Devices Market Revenue Million Forecast, by Region 2019 & 2032
- Table 2: Global Electroencephalography Systems/Devices Market Volume K Unit Forecast, by Region 2019 & 2032
- Table 3: Global Electroencephalography Systems/Devices Market Revenue Million Forecast, by Type 2019 & 2032
- Table 4: Global Electroencephalography Systems/Devices Market Volume K Unit Forecast, by Type 2019 & 2032
- Table 5: Global Electroencephalography Systems/Devices Market Revenue Million Forecast, by End User 2019 & 2032
- Table 6: Global Electroencephalography Systems/Devices Market Volume K Unit Forecast, by End User 2019 & 2032
- Table 7: Global Electroencephalography Systems/Devices Market Revenue Million Forecast, by Region 2019 & 2032
- Table 8: Global Electroencephalography Systems/Devices Market Volume K Unit Forecast, by Region 2019 & 2032
- Table 9: Global Electroencephalography Systems/Devices Market Revenue Million Forecast, by Country 2019 & 2032
- Table 10: Global Electroencephalography Systems/Devices Market Volume K Unit Forecast, by Country 2019 & 2032
- Table 11: United States Electroencephalography Systems/Devices Market Revenue (Million) Forecast, by Application 2019 & 2032
- Table 12: United States Electroencephalography Systems/Devices Market Volume (K Unit) Forecast, by Application 2019 & 2032
- Table 13: Canada Electroencephalography Systems/Devices Market Revenue (Million) Forecast, by Application 2019 & 2032
- Table 14: Canada Electroencephalography Systems/Devices Market Volume (K Unit) Forecast, by Application 2019 & 2032
- Table 15: Mexico Electroencephalography Systems/Devices Market Revenue (Million) Forecast, by Application 2019 & 2032
- Table 16: Mexico Electroencephalography Systems/Devices Market Volume (K Unit) Forecast, by Application 2019 & 2032
- Table 17: Global Electroencephalography Systems/Devices Market Revenue Million Forecast, by Country 2019 & 2032
- Table 18: Global Electroencephalography Systems/Devices Market Volume K Unit Forecast, by Country 2019 & 2032
- Table 19: Germany Electroencephalography Systems/Devices Market Revenue (Million) Forecast, by Application 2019 & 2032
- Table 20: Germany Electroencephalography Systems/Devices Market Volume (K Unit) Forecast, by Application 2019 & 2032
- Table 21: United Kingdom Electroencephalography Systems/Devices Market Revenue (Million) Forecast, by Application 2019 & 2032
- Table 22: United Kingdom Electroencephalography Systems/Devices Market Volume (K Unit) Forecast, by Application 2019 & 2032
- Table 23: France Electroencephalography Systems/Devices Market Revenue (Million) Forecast, by Application 2019 & 2032
- Table 24: France Electroencephalography Systems/Devices Market Volume (K Unit) Forecast, by Application 2019 & 2032
- Table 25: Italy Electroencephalography Systems/Devices Market Revenue (Million) Forecast, by Application 2019 & 2032
- Table 26: Italy Electroencephalography Systems/Devices Market Volume (K Unit) Forecast, by Application 2019 & 2032
- Table 27: Spain Electroencephalography Systems/Devices Market Revenue (Million) Forecast, by Application 2019 & 2032
- Table 28: Spain Electroencephalography Systems/Devices Market Volume (K Unit) Forecast, by Application 2019 & 2032
- Table 29: Rest of Europe Electroencephalography Systems/Devices Market Revenue (Million) Forecast, by Application 2019 & 2032
- Table 30: Rest of Europe Electroencephalography Systems/Devices Market Volume (K Unit) Forecast, by Application 2019 & 2032
- Table 31: Global Electroencephalography Systems/Devices Market Revenue Million Forecast, by Country 2019 & 2032
- Table 32: Global Electroencephalography Systems/Devices Market Volume K Unit Forecast, by Country 2019 & 2032
- Table 33: China Electroencephalography Systems/Devices Market Revenue (Million) Forecast, by Application 2019 & 2032
- Table 34: China Electroencephalography Systems/Devices Market Volume (K Unit) Forecast, by Application 2019 & 2032
- Table 35: Japan Electroencephalography Systems/Devices Market Revenue (Million) Forecast, by Application 2019 & 2032
- Table 36: Japan Electroencephalography Systems/Devices Market Volume (K Unit) Forecast, by Application 2019 & 2032
- Table 37: India Electroencephalography Systems/Devices Market Revenue (Million) Forecast, by Application 2019 & 2032
- Table 38: India Electroencephalography Systems/Devices Market Volume (K Unit) Forecast, by Application 2019 & 2032
- Table 39: Australia Electroencephalography Systems/Devices Market Revenue (Million) Forecast, by Application 2019 & 2032
- Table 40: Australia Electroencephalography Systems/Devices Market Volume (K Unit) Forecast, by Application 2019 & 2032
- Table 41: South Korea Electroencephalography Systems/Devices Market Revenue (Million) Forecast, by Application 2019 & 2032
- Table 42: South Korea Electroencephalography Systems/Devices Market Volume (K Unit) Forecast, by Application 2019 & 2032
- Table 43: Rest of Asia Pacific Electroencephalography Systems/Devices Market Revenue (Million) Forecast, by Application 2019 & 2032
- Table 44: Rest of Asia Pacific Electroencephalography Systems/Devices Market Volume (K Unit) Forecast, by Application 2019 & 2032
- Table 45: Global Electroencephalography Systems/Devices Market Revenue Million Forecast, by Country 2019 & 2032
- Table 46: Global Electroencephalography Systems/Devices Market Volume K Unit Forecast, by Country 2019 & 2032
- Table 47: GCC Electroencephalography Systems/Devices Market Revenue (Million) Forecast, by Application 2019 & 2032
- Table 48: GCC Electroencephalography Systems/Devices Market Volume (K Unit) Forecast, by Application 2019 & 2032
- Table 49: South Africa Electroencephalography Systems/Devices Market Revenue (Million) Forecast, by Application 2019 & 2032
- Table 50: South Africa Electroencephalography Systems/Devices Market Volume (K Unit) Forecast, by Application 2019 & 2032
- Table 51: Rest of Middle East and Africa Electroencephalography Systems/Devices Market Revenue (Million) Forecast, by Application 2019 & 2032
- Table 52: Rest of Middle East and Africa Electroencephalography Systems/Devices Market Volume (K Unit) Forecast, by Application 2019 & 2032
- Table 53: Global Electroencephalography Systems/Devices Market Revenue Million Forecast, by Country 2019 & 2032
- Table 54: Global Electroencephalography Systems/Devices Market Volume K Unit Forecast, by Country 2019 & 2032
- Table 55: Brazil Electroencephalography Systems/Devices Market Revenue (Million) Forecast, by Application 2019 & 2032
- Table 56: Brazil Electroencephalography Systems/Devices Market Volume (K Unit) Forecast, by Application 2019 & 2032
- Table 57: Argentina Electroencephalography Systems/Devices Market Revenue (Million) Forecast, by Application 2019 & 2032
- Table 58: Argentina Electroencephalography Systems/Devices Market Volume (K Unit) Forecast, by Application 2019 & 2032
- Table 59: Rest of South America Electroencephalography Systems/Devices Market Revenue (Million) Forecast, by Application 2019 & 2032
- Table 60: Rest of South America Electroencephalography Systems/Devices Market Volume (K Unit) Forecast, by Application 2019 & 2032
- Table 61: Global Electroencephalography Systems/Devices Market Revenue Million Forecast, by Type 2019 & 2032
- Table 62: Global Electroencephalography Systems/Devices Market Volume K Unit Forecast, by Type 2019 & 2032
- Table 63: Global Electroencephalography Systems/Devices Market Revenue Million Forecast, by End User 2019 & 2032
- Table 64: Global Electroencephalography Systems/Devices Market Volume K Unit Forecast, by End User 2019 & 2032
- Table 65: Global Electroencephalography Systems/Devices Market Revenue Million Forecast, by Country 2019 & 2032
- Table 66: Global Electroencephalography Systems/Devices Market Volume K Unit Forecast, by Country 2019 & 2032
- Table 67: United States Electroencephalography Systems/Devices Market Revenue (Million) Forecast, by Application 2019 & 2032
- Table 68: United States Electroencephalography Systems/Devices Market Volume (K Unit) Forecast, by Application 2019 & 2032
- Table 69: Canada Electroencephalography Systems/Devices Market Revenue (Million) Forecast, by Application 2019 & 2032
- Table 70: Canada Electroencephalography Systems/Devices Market Volume (K Unit) Forecast, by Application 2019 & 2032
- Table 71: Mexico Electroencephalography Systems/Devices Market Revenue (Million) Forecast, by Application 2019 & 2032
- Table 72: Mexico Electroencephalography Systems/Devices Market Volume (K Unit) Forecast, by Application 2019 & 2032
- Table 73: Global Electroencephalography Systems/Devices Market Revenue Million Forecast, by Type 2019 & 2032
- Table 74: Global Electroencephalography Systems/Devices Market Volume K Unit Forecast, by Type 2019 & 2032
- Table 75: Global Electroencephalography Systems/Devices Market Revenue Million Forecast, by End User 2019 & 2032
- Table 76: Global Electroencephalography Systems/Devices Market Volume K Unit Forecast, by End User 2019 & 2032
- Table 77: Global Electroencephalography Systems/Devices Market Revenue Million Forecast, by Country 2019 & 2032
- Table 78: Global Electroencephalography Systems/Devices Market Volume K Unit Forecast, by Country 2019 & 2032
- Table 79: Germany Electroencephalography Systems/Devices Market Revenue (Million) Forecast, by Application 2019 & 2032
- Table 80: Germany Electroencephalography Systems/Devices Market Volume (K Unit) Forecast, by Application 2019 & 2032
- Table 81: United Kingdom Electroencephalography Systems/Devices Market Revenue (Million) Forecast, by Application 2019 & 2032
- Table 82: United Kingdom Electroencephalography Systems/Devices Market Volume (K Unit) Forecast, by Application 2019 & 2032
- Table 83: France Electroencephalography Systems/Devices Market Revenue (Million) Forecast, by Application 2019 & 2032
- Table 84: France Electroencephalography Systems/Devices Market Volume (K Unit) Forecast, by Application 2019 & 2032
- Table 85: Italy Electroencephalography Systems/Devices Market Revenue (Million) Forecast, by Application 2019 & 2032
- Table 86: Italy Electroencephalography Systems/Devices Market Volume (K Unit) Forecast, by Application 2019 & 2032
- Table 87: Spain Electroencephalography Systems/Devices Market Revenue (Million) Forecast, by Application 2019 & 2032
- Table 88: Spain Electroencephalography Systems/Devices Market Volume (K Unit) Forecast, by Application 2019 & 2032
- Table 89: Rest of Europe Electroencephalography Systems/Devices Market Revenue (Million) Forecast, by Application 2019 & 2032
- Table 90: Rest of Europe Electroencephalography Systems/Devices Market Volume (K Unit) Forecast, by Application 2019 & 2032
- Table 91: Global Electroencephalography Systems/Devices Market Revenue Million Forecast, by Type 2019 & 2032
- Table 92: Global Electroencephalography Systems/Devices Market Volume K Unit Forecast, by Type 2019 & 2032
- Table 93: Global Electroencephalography Systems/Devices Market Revenue Million Forecast, by End User 2019 & 2032
- Table 94: Global Electroencephalography Systems/Devices Market Volume K Unit Forecast, by End User 2019 & 2032
- Table 95: Global Electroencephalography Systems/Devices Market Revenue Million Forecast, by Country 2019 & 2032
- Table 96: Global Electroencephalography Systems/Devices Market Volume K Unit Forecast, by Country 2019 & 2032
- Table 97: China Electroencephalography Systems/Devices Market Revenue (Million) Forecast, by Application 2019 & 2032
- Table 98: China Electroencephalography Systems/Devices Market Volume (K Unit) Forecast, by Application 2019 & 2032
- Table 99: Japan Electroencephalography Systems/Devices Market Revenue (Million) Forecast, by Application 2019 & 2032
- Table 100: Japan Electroencephalography Systems/Devices Market Volume (K Unit) Forecast, by Application 2019 & 2032
- Table 101: India Electroencephalography Systems/Devices Market Revenue (Million) Forecast, by Application 2019 & 2032
- Table 102: India Electroencephalography Systems/Devices Market Volume (K Unit) Forecast, by Application 2019 & 2032
- Table 103: Australia Electroencephalography Systems/Devices Market Revenue (Million) Forecast, by Application 2019 & 2032
- Table 104: Australia Electroencephalography Systems/Devices Market Volume (K Unit) Forecast, by Application 2019 & 2032
- Table 105: South Korea Electroencephalography Systems/Devices Market Revenue (Million) Forecast, by Application 2019 & 2032
- Table 106: South Korea Electroencephalography Systems/Devices Market Volume (K Unit) Forecast, by Application 2019 & 2032
- Table 107: Rest of Asia Pacific Electroencephalography Systems/Devices Market Revenue (Million) Forecast, by Application 2019 & 2032
- Table 108: Rest of Asia Pacific Electroencephalography Systems/Devices Market Volume (K Unit) Forecast, by Application 2019 & 2032
- Table 109: Global Electroencephalography Systems/Devices Market Revenue Million Forecast, by Type 2019 & 2032
- Table 110: Global Electroencephalography Systems/Devices Market Volume K Unit Forecast, by Type 2019 & 2032
- Table 111: Global Electroencephalography Systems/Devices Market Revenue Million Forecast, by End User 2019 & 2032
- Table 112: Global Electroencephalography Systems/Devices Market Volume K Unit Forecast, by End User 2019 & 2032
- Table 113: Global Electroencephalography Systems/Devices Market Revenue Million Forecast, by Country 2019 & 2032
- Table 114: Global Electroencephalography Systems/Devices Market Volume K Unit Forecast, by Country 2019 & 2032
- Table 115: GCC Electroencephalography Systems/Devices Market Revenue (Million) Forecast, by Application 2019 & 2032
- Table 116: GCC Electroencephalography Systems/Devices Market Volume (K Unit) Forecast, by Application 2019 & 2032
- Table 117: South Africa Electroencephalography Systems/Devices Market Revenue (Million) Forecast, by Application 2019 & 2032
- Table 118: South Africa Electroencephalography Systems/Devices Market Volume (K Unit) Forecast, by Application 2019 & 2032
- Table 119: Rest of Middle East and Africa Electroencephalography Systems/Devices Market Revenue (Million) Forecast, by Application 2019 & 2032
- Table 120: Rest of Middle East and Africa Electroencephalography Systems/Devices Market Volume (K Unit) Forecast, by Application 2019 & 2032
- Table 121: Global Electroencephalography Systems/Devices Market Revenue Million Forecast, by Type 2019 & 2032
- Table 122: Global Electroencephalography Systems/Devices Market Volume K Unit Forecast, by Type 2019 & 2032
- Table 123: Global Electroencephalography Systems/Devices Market Revenue Million Forecast, by End User 2019 & 2032
- Table 124: Global Electroencephalography Systems/Devices Market Volume K Unit Forecast, by End User 2019 & 2032
- Table 125: Global Electroencephalography Systems/Devices Market Revenue Million Forecast, by Country 2019 & 2032
- Table 126: Global Electroencephalography Systems/Devices Market Volume K Unit Forecast, by Country 2019 & 2032
- Table 127: Brazil Electroencephalography Systems/Devices Market Revenue (Million) Forecast, by Application 2019 & 2032
- Table 128: Brazil Electroencephalography Systems/Devices Market Volume (K Unit) Forecast, by Application 2019 & 2032
- Table 129: Argentina Electroencephalography Systems/Devices Market Revenue (Million) Forecast, by Application 2019 & 2032
- Table 130: Argentina Electroencephalography Systems/Devices Market Volume (K Unit) Forecast, by Application 2019 & 2032
- Table 131: Rest of South America Electroencephalography Systems/Devices Market Revenue (Million) Forecast, by Application 2019 & 2032
- Table 132: Rest of South America Electroencephalography Systems/Devices Market Volume (K Unit) Forecast, by Application 2019 & 2032
Frequently Asked Questions
1. What is the projected Compound Annual Growth Rate (CAGR) of the Electroencephalography Systems/Devices Market?
The projected CAGR is approximately 8.00%.
2. Which companies are prominent players in the Electroencephalography Systems/Devices Market?
Key companies in the market include Cephalon A/S, Medtronic, Natus Medical Inc, Compumedics Limited, Advanced Brain Monitoring Inc, Cadwell Industries Inc, Fresenius SE & Co KGaA, General Electric Company (GE Healthcare), NeuroWave Systems Inc, Koninklijke Philips N V (Philips Healthcare), Nihon Kohden Corporation.
3. What are the main segments of the Electroencephalography Systems/Devices Market?
The market segments include Type, End User.
4. Can you provide details about the market size?
The market size is estimated to be USD XX Million as of 2022.
5. What are some drivers contributing to market growth?
Rising R&D Expenditure; Increasing Prevalence of Neurological Disorders.
6. What are the notable trends driving market growth?
Standalone Electroencephalography System is Expected to Witness a Healthy Growth in Future.
7. Are there any restraints impacting market growth?
Limitation of Electroencephalography System.
8. Can you provide examples of recent developments in the market?
In March 2022, Interaxon Inc. launched VR Software Development Kit (SDK) alongside a new EEG headband compatible with all major VR head-mounted displays (HMDs), building off Interaxon's second-generation EEG meditation and sleep headband.
9. What pricing options are available for accessing the report?
Pricing options include single-user, multi-user, and enterprise licenses priced at USD 4750, USD 5250, and USD 8750 respectively.
10. Is the market size provided in terms of value or volume?
The market size is provided in terms of value, measured in Million and volume, measured in K Unit.
11. Are there any specific market keywords associated with the report?
Yes, the market keyword associated with the report is "Electroencephalography Systems/Devices Market," which aids in identifying and referencing the specific market segment covered.
12. How do I determine which pricing option suits my needs best?
The pricing options vary based on user requirements and access needs. Individual users may opt for single-user licenses, while businesses requiring broader access may choose multi-user or enterprise licenses for cost-effective access to the report.
13. Are there any additional resources or data provided in the Electroencephalography Systems/Devices Market report?
While the report offers comprehensive insights, it's advisable to review the specific contents or supplementary materials provided to ascertain if additional resources or data are available.
14. How can I stay updated on further developments or reports in the Electroencephalography Systems/Devices Market?
To stay informed about further developments, trends, and reports in the Electroencephalography Systems/Devices Market, consider subscribing to industry newsletters, following relevant companies and organizations, or regularly checking reputable industry news sources and publications.
Methodology
Step 1 - Identification of Relevant Samples Size from Population Database


Step 2 - Approaches for Defining Global Market Size (Value, Volume* & Price*)

Note*: In applicable scenarios
Step 3 - Data Sources
Primary Research
- Web Analytics
- Survey Reports
- Research Institute
- Latest Research Reports
- Opinion Leaders
Secondary Research
- Annual Reports
- White Paper
- Latest Press Release
- Industry Association
- Paid Database
- Investor Presentations

Step 4 - Data Triangulation
Involves using different sources of information in order to increase the validity of a study
These sources are likely to be stakeholders in a program - participants, other researchers, program staff, other community members, and so on.
Then we put all data in single framework & apply various statistical tools to find out the dynamic on the market.
During the analysis stage, feedback from the stakeholder groups would be compared to determine areas of agreement as well as areas of divergence


