
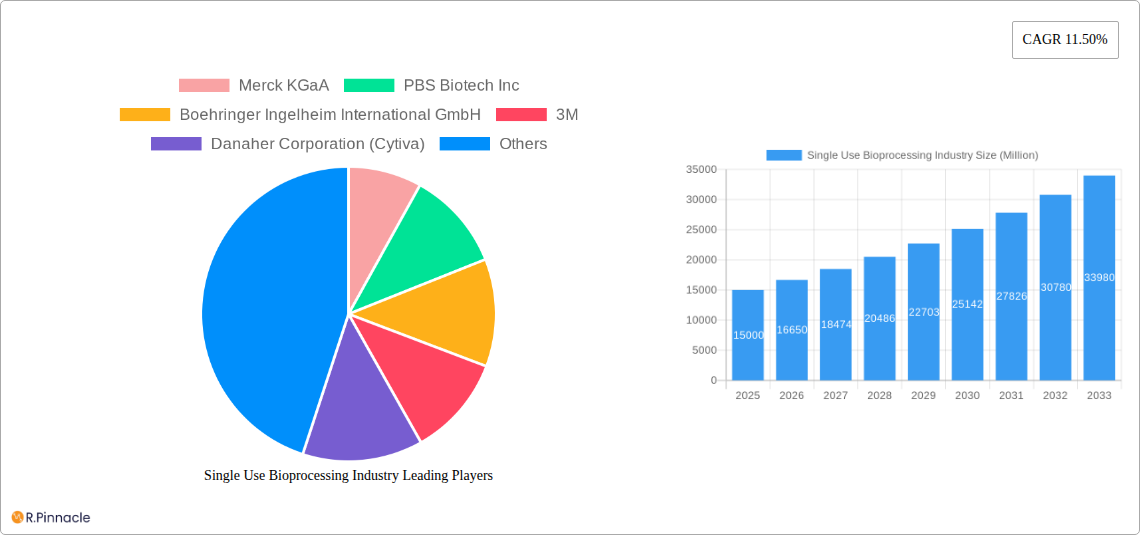
Key Insights
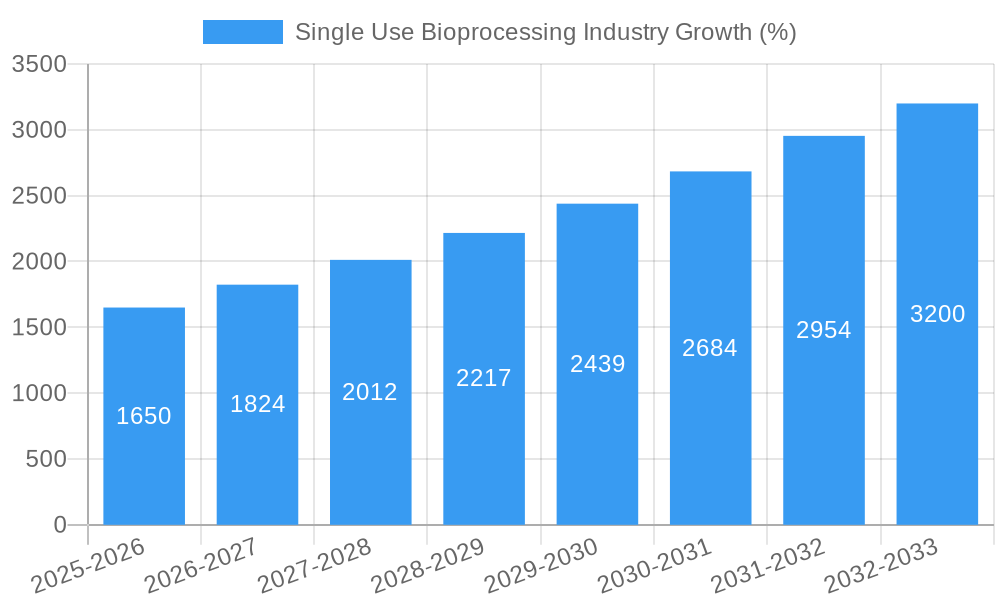
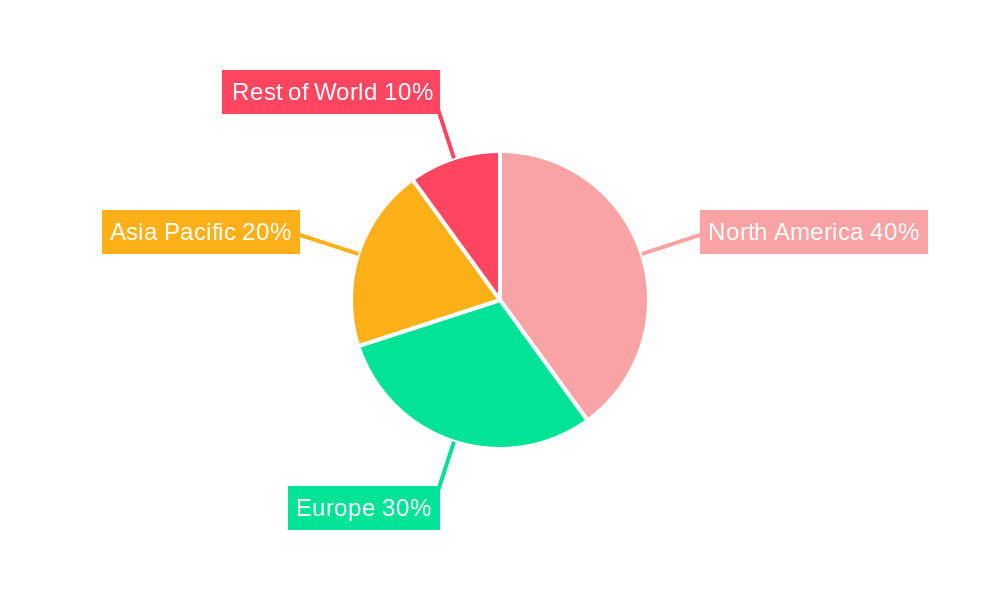
The single-use bioprocessing market is experiencing robust growth, driven by increasing demand for cost-effective and efficient biopharmaceutical manufacturing. The market's Compound Annual Growth Rate (CAGR) of 11.50% from 2019 to 2024 suggests a significant expansion, projected to continue through 2033. Key drivers include the rising prevalence of chronic diseases necessitating biologics, the advantages of single-use systems in reducing contamination risks and cleaning validation needs, and the growing adoption of continuous manufacturing processes. The market segmentation reveals strong performance across product categories, with disposable bioreactors and filtration assemblies leading the charge, followed by media bags and containers. Application-wise, cell culture and purification processes are major contributors. Biopharmaceutical manufacturers are the dominant end-users, followed by academic and clinical research institutes. Geographically, North America currently holds a significant market share, attributed to a robust biopharmaceutical industry and advanced research infrastructure. However, the Asia-Pacific region is expected to witness substantial growth in the coming years, fueled by expanding manufacturing capabilities and increasing investments in the life sciences sector. Competition is intense among major players such as Merck KGaA, Sartorius AG, and Thermo Fisher Scientific, who are constantly innovating to offer advanced and integrated solutions. This competitive landscape fuels further market expansion through continuous improvement and technological advancements.
The industry's future growth is further bolstered by the increasing adoption of advanced technologies like automated systems and process analytical technology (PAT). This enhances efficiency, reduces production timelines, and further supports the shift towards cost-effective and flexible manufacturing. While some restraints, such as regulatory hurdles and potential material compatibility challenges, exist, they are unlikely to significantly hamper the overall positive growth trajectory of the single-use bioprocessing market. The ongoing trend towards personalized medicine also contributes to market expansion, as it necessitates the production of smaller batches of customized biologics, a process easily accommodated by single-use systems. This signifies that the single-use bioprocessing market is poised for sustained expansion, driven by technological advancements, favorable regulatory environments, and the ever-growing demand for biologics.
This comprehensive report provides an in-depth analysis of the Single Use Bioprocessing industry, offering valuable insights for industry professionals, investors, and researchers. With a study period spanning 2019-2033, a base year of 2025, and a forecast period of 2025-2033, this report leverages extensive data analysis to predict future market trends and opportunities. The report covers a market valued at xx Million in 2025, projected to reach xx Million by 2033, exhibiting a robust CAGR.
Single Use Bioprocessing Industry Market Structure & Innovation Trends
This section analyzes the market's competitive landscape, innovation drivers, and regulatory environment. The industry exhibits a moderately concentrated structure, with key players like Merck KGaA, Danaher Corporation (Cytiva), Sartorius AG, and Thermo Fisher Scientific holding significant market share. However, several smaller companies are also contributing significantly, driving innovation and competition. The xx Million market in 2025 is expected to see further consolidation through mergers and acquisitions (M&A) activities. The total value of M&A deals in the last five years is estimated to be around xx Million.
- Market Concentration: Moderately concentrated, with top 5 players holding approximately xx% market share in 2025.
- Innovation Drivers: Demand for faster drug development, increased process efficiency, and reduced contamination risks.
- Regulatory Framework: Stringent regulations from agencies like the FDA and EMA are shaping industry practices and driving innovation in quality control and safety.
- Product Substitutes: Traditional stainless steel bioprocessing systems; however, single-use systems offer significant advantages in terms of cost-effectiveness and flexibility, limiting the threat from substitutes.
- End-User Demographics: Biopharmaceutical manufacturers constitute the largest segment, followed by academic and clinical research institutes.
- M&A Activity: Significant M&A activity in recent years, driven by a desire to expand product portfolios and access new technologies; average deal value is approximately xx Million.
Single Use Bioprocessing Industry Market Dynamics & Trends
The single-use bioprocessing market is experiencing significant growth driven by several factors. The increasing demand for biologics, advancements in single-use technologies, and the rising adoption of continuous manufacturing processes are key drivers. Technological advancements, such as the development of novel bioreactor designs and improved filtration systems, are contributing to increased market penetration and higher adoption rates. Consumer preferences are shifting towards single-use systems due to their reduced cleaning and sterilization costs, improved flexibility, and reduced risk of cross-contamination. Competitive dynamics are characterized by intense innovation, strategic partnerships, and occasional M&A activities. The market is projected to witness a CAGR of xx% during the forecast period (2025-2033), driven primarily by the growing demand for biologics and the increased adoption of single-use technologies in developing regions.
Dominant Regions & Segments in Single Use Bioprocessing Industry
North America currently holds the largest market share, driven by strong R&D investments, a robust biopharmaceutical industry, and supportive regulatory frameworks. However, Asia-Pacific is expected to witness the fastest growth rate due to rapid economic development, growing healthcare spending, and increasing investments in biopharmaceutical manufacturing facilities.
- Leading Region: North America
- Key Drivers for North America: Strong biopharmaceutical industry, high R&D spending, and supportive regulatory environment.
- Key Drivers for Asia-Pacific: Rapid economic growth, increasing healthcare expenditure, and government initiatives to support the biopharmaceutical sector.
- Dominant Product Segment: Disposable/Single-use Bioreactors, followed by Filtration Assemblies and Media Bags and Containers.
- Dominant Application Segment: Cell Culture, followed by Purification and Filtration.
- Dominant End-User Segment: Biopharmaceutical Manufacturers.
Single Use Bioprocessing Industry Product Innovations
Recent product innovations include advancements in disposable bioreactor designs, the development of more efficient filtration assemblies, and the introduction of novel media bags and containers with improved functionalities. These innovations improve process efficiency, reduce manufacturing costs, and enhance product quality. The market is witnessing a shift towards integrated single-use systems that streamline the entire bioprocessing workflow. These integrated systems are gaining traction due to their reduced complexity, improved scalability, and enhanced automation capabilities.
Report Scope & Segmentation Analysis
This report segments the single-use bioprocessing market based on product type (Filtration Assemblies, Media Bags and Containers, Disposable/Single-use Bioreactors, Disposable Mixers, Other Products), application (Filtration, Cell Culture, Purification, Other Applications), and end-user (Biopharmaceutical Manufacturers, Academic and Clinical Research Institutes, Other End Users). Each segment is analyzed in detail, providing insights into market size, growth projections, and competitive dynamics. For instance, the Disposable/Single-use Bioreactors segment is expected to witness significant growth due to its wide applications in various bioprocesses.
Key Drivers of Single Use Bioprocessing Industry Growth
The growth of the single-use bioprocessing industry is propelled by several factors: the increasing demand for biologics, the rising adoption of continuous manufacturing processes, advancements in single-use technologies, and stringent regulatory requirements for reducing cross-contamination. The growing need for cost-effective and efficient bioprocessing solutions further fuels market expansion. Government initiatives in various regions, promoting biopharmaceutical manufacturing, also play a significant role.
Challenges in the Single Use Bioprocessing Industry Sector
The industry faces challenges such as the high initial investment costs for single-use systems, concerns about the environmental impact of disposable materials, and the potential for material leaching into bioproducts. Ensuring the consistent quality and reliability of single-use components, along with managing the supply chain effectively, are also critical concerns. Regulatory compliance and validation requirements add another layer of complexity. The estimated cost of regulatory compliance per year for a medium-sized company is approximately xx Million.
Emerging Opportunities in Single Use Bioprocessing Industry
Emerging opportunities include the development of advanced single-use sensors and monitoring technologies, the expansion into new therapeutic areas like cell and gene therapy, and the increasing demand for single-use solutions in emerging markets. The rising adoption of personalized medicine and the need for flexible manufacturing processes are further creating opportunities for innovative single-use bioprocessing solutions. The projected market size for personalized medicine-related single-use bioprocessing is estimated to be xx Million by 2033.
Leading Players in the Single Use Bioprocessing Industry Market
- Merck KGaA
- PBS Biotech Inc
- Boehringer Ingelheim International GmbH
- 3M
- Danaher Corporation (Cytiva)
- Distek Inc
- Eppendorf AG
- Sartorius AG
- CESCO Bioengineering Co Ltd
- ABEC Inc
- Celltainer Biotech BV
- OmniBRx Biotechnologies
- Thermo Fisher Scientific
Key Developments in Single Use Bioprocessing Industry Industry
- October 2022: PharmNXT Biotech launched its first integrated manufacturing unit in Pune, India, providing single-use bioprocessing solutions. This significantly increases the capacity for biologics manufacturing in India.
- October 2022: Single Use Support GmbH expanded its product portfolio with new single-use bioprocess containers (IRIS), enhancing storage and shipping capabilities for drug substances.
Future Outlook for Single Use Bioprocessing Industry Market
The single-use bioprocessing market is poised for continued growth, driven by several factors including technological advancements, increasing demand for biologics, and the adoption of advanced manufacturing techniques. Strategic partnerships, M&A activities, and expansion into new geographic markets will further shape the industry's future. The market is anticipated to experience sustained growth, fueled by the continuous development of innovative single-use technologies and the expanding biopharmaceutical landscape.
Single Use Bioprocessing Industry Segmentation
-
1. Product
- 1.1. Filtration Assemblies
- 1.2. Media Bags and Containers
- 1.3. Disposable/Single-use Bioreactors
- 1.4. Disposable Mixers
- 1.5. Other Products
-
2. Application
- 2.1. Filtration
- 2.2. Cell Culture
- 2.3. Purification
- 2.4. Other Applications
-
3. End User
- 3.1. Biopharmaceutical Manufacturers
- 3.2. Academic and Clinical Research Institutes
- 3.3. Other End Users
Single Use Bioprocessing Industry Segmentation By Geography
-
1. North America
- 1.1. United States
- 1.2. Canada
- 1.3. Mexico
-
2. Europe
- 2.1. Germany
- 2.2. United Kingdom
- 2.3. France
- 2.4. Italy
- 2.5. Spain
- 2.6. Rest of Europe
-
3. Asia Pacific
- 3.1. China
- 3.2. Japan
- 3.3. India
- 3.4. Australia
- 3.5. South Korea
- 3.6. Rest of Asia Pacific
-
4. Middle East and Africa
- 4.1. GCC
- 4.2. South Africa
- 4.3. Rest of Middle East and Africa
-
5. South America
- 5.1. Brazil
- 5.2. Argentina
- 5.3. Rest of South America
Single Use Bioprocessing Industry REPORT HIGHLIGHTS
| Aspects | Details |
|---|---|
| Study Period | 2019-2033 |
| Base Year | 2024 |
| Estimated Year | 2025 |
| Forecast Period | 2025-2033 |
| Historical Period | 2019-2024 |
| Growth Rate | CAGR of 11.50% from 2019-2033 |
| Segmentation |
|
Table of Contents
- 1. Introduction
- 1.1. Research Scope
- 1.2. Market Segmentation
- 1.3. Research Methodology
- 1.4. Definitions and Assumptions
- 2. Executive Summary
- 2.1. Introduction
- 3. Market Dynamics
- 3.1. Introduction
- 3.2. Market Drivers
- 3.2.1. Faster Implementation and Lower Risk of Product Cross-contamination; Increasing Demand for Biopharmaceuticals; Lower Costs and Lesser Environmental Impact of Single-use Bioprocessing Technologies
- 3.3. Market Restrains
- 3.3.1. Issues Related to Leachables and Extractables
- 3.4. Market Trends
- 3.4.1. Biopharmaceutical Manufacturer Segment is Expected to Witness Significant Growth Over the Forecast Period
- 4. Market Factor Analysis
- 4.1. Porters Five Forces
- 4.2. Supply/Value Chain
- 4.3. PESTEL analysis
- 4.4. Market Entropy
- 4.5. Patent/Trademark Analysis
- 5. Global Single Use Bioprocessing Industry Analysis, Insights and Forecast, 2019-2031
- 5.1. Market Analysis, Insights and Forecast - by Product
- 5.1.1. Filtration Assemblies
- 5.1.2. Media Bags and Containers
- 5.1.3. Disposable/Single-use Bioreactors
- 5.1.4. Disposable Mixers
- 5.1.5. Other Products
- 5.2. Market Analysis, Insights and Forecast - by Application
- 5.2.1. Filtration
- 5.2.2. Cell Culture
- 5.2.3. Purification
- 5.2.4. Other Applications
- 5.3. Market Analysis, Insights and Forecast - by End User
- 5.3.1. Biopharmaceutical Manufacturers
- 5.3.2. Academic and Clinical Research Institutes
- 5.3.3. Other End Users
- 5.4. Market Analysis, Insights and Forecast - by Region
- 5.4.1. North America
- 5.4.2. Europe
- 5.4.3. Asia Pacific
- 5.4.4. Middle East and Africa
- 5.4.5. South America
- 5.1. Market Analysis, Insights and Forecast - by Product
- 6. North America Single Use Bioprocessing Industry Analysis, Insights and Forecast, 2019-2031
- 6.1. Market Analysis, Insights and Forecast - by Product
- 6.1.1. Filtration Assemblies
- 6.1.2. Media Bags and Containers
- 6.1.3. Disposable/Single-use Bioreactors
- 6.1.4. Disposable Mixers
- 6.1.5. Other Products
- 6.2. Market Analysis, Insights and Forecast - by Application
- 6.2.1. Filtration
- 6.2.2. Cell Culture
- 6.2.3. Purification
- 6.2.4. Other Applications
- 6.3. Market Analysis, Insights and Forecast - by End User
- 6.3.1. Biopharmaceutical Manufacturers
- 6.3.2. Academic and Clinical Research Institutes
- 6.3.3. Other End Users
- 6.1. Market Analysis, Insights and Forecast - by Product
- 7. Europe Single Use Bioprocessing Industry Analysis, Insights and Forecast, 2019-2031
- 7.1. Market Analysis, Insights and Forecast - by Product
- 7.1.1. Filtration Assemblies
- 7.1.2. Media Bags and Containers
- 7.1.3. Disposable/Single-use Bioreactors
- 7.1.4. Disposable Mixers
- 7.1.5. Other Products
- 7.2. Market Analysis, Insights and Forecast - by Application
- 7.2.1. Filtration
- 7.2.2. Cell Culture
- 7.2.3. Purification
- 7.2.4. Other Applications
- 7.3. Market Analysis, Insights and Forecast - by End User
- 7.3.1. Biopharmaceutical Manufacturers
- 7.3.2. Academic and Clinical Research Institutes
- 7.3.3. Other End Users
- 7.1. Market Analysis, Insights and Forecast - by Product
- 8. Asia Pacific Single Use Bioprocessing Industry Analysis, Insights and Forecast, 2019-2031
- 8.1. Market Analysis, Insights and Forecast - by Product
- 8.1.1. Filtration Assemblies
- 8.1.2. Media Bags and Containers
- 8.1.3. Disposable/Single-use Bioreactors
- 8.1.4. Disposable Mixers
- 8.1.5. Other Products
- 8.2. Market Analysis, Insights and Forecast - by Application
- 8.2.1. Filtration
- 8.2.2. Cell Culture
- 8.2.3. Purification
- 8.2.4. Other Applications
- 8.3. Market Analysis, Insights and Forecast - by End User
- 8.3.1. Biopharmaceutical Manufacturers
- 8.3.2. Academic and Clinical Research Institutes
- 8.3.3. Other End Users
- 8.1. Market Analysis, Insights and Forecast - by Product
- 9. Middle East and Africa Single Use Bioprocessing Industry Analysis, Insights and Forecast, 2019-2031
- 9.1. Market Analysis, Insights and Forecast - by Product
- 9.1.1. Filtration Assemblies
- 9.1.2. Media Bags and Containers
- 9.1.3. Disposable/Single-use Bioreactors
- 9.1.4. Disposable Mixers
- 9.1.5. Other Products
- 9.2. Market Analysis, Insights and Forecast - by Application
- 9.2.1. Filtration
- 9.2.2. Cell Culture
- 9.2.3. Purification
- 9.2.4. Other Applications
- 9.3. Market Analysis, Insights and Forecast - by End User
- 9.3.1. Biopharmaceutical Manufacturers
- 9.3.2. Academic and Clinical Research Institutes
- 9.3.3. Other End Users
- 9.1. Market Analysis, Insights and Forecast - by Product
- 10. South America Single Use Bioprocessing Industry Analysis, Insights and Forecast, 2019-2031
- 10.1. Market Analysis, Insights and Forecast - by Product
- 10.1.1. Filtration Assemblies
- 10.1.2. Media Bags and Containers
- 10.1.3. Disposable/Single-use Bioreactors
- 10.1.4. Disposable Mixers
- 10.1.5. Other Products
- 10.2. Market Analysis, Insights and Forecast - by Application
- 10.2.1. Filtration
- 10.2.2. Cell Culture
- 10.2.3. Purification
- 10.2.4. Other Applications
- 10.3. Market Analysis, Insights and Forecast - by End User
- 10.3.1. Biopharmaceutical Manufacturers
- 10.3.2. Academic and Clinical Research Institutes
- 10.3.3. Other End Users
- 10.1. Market Analysis, Insights and Forecast - by Product
- 11. North America Single Use Bioprocessing Industry Analysis, Insights and Forecast, 2019-2031
- 11.1. Market Analysis, Insights and Forecast - By Country/Sub-region
- 11.1.1 United States
- 11.1.2 Canada
- 11.1.3 Mexico
- 12. Europe Single Use Bioprocessing Industry Analysis, Insights and Forecast, 2019-2031
- 12.1. Market Analysis, Insights and Forecast - By Country/Sub-region
- 12.1.1 Germany
- 12.1.2 United Kingdom
- 12.1.3 France
- 12.1.4 Italy
- 12.1.5 Spain
- 12.1.6 Rest of Europe
- 13. Asia Pacific Single Use Bioprocessing Industry Analysis, Insights and Forecast, 2019-2031
- 13.1. Market Analysis, Insights and Forecast - By Country/Sub-region
- 13.1.1 China
- 13.1.2 Japan
- 13.1.3 India
- 13.1.4 Australia
- 13.1.5 South Korea
- 13.1.6 Rest of Asia Pacific
- 14. Middle East and Africa Single Use Bioprocessing Industry Analysis, Insights and Forecast, 2019-2031
- 14.1. Market Analysis, Insights and Forecast - By Country/Sub-region
- 14.1.1 GCC
- 14.1.2 South Africa
- 14.1.3 Rest of Middle East and Africa
- 15. South America Single Use Bioprocessing Industry Analysis, Insights and Forecast, 2019-2031
- 15.1. Market Analysis, Insights and Forecast - By Country/Sub-region
- 15.1.1 Brazil
- 15.1.2 Argentina
- 15.1.3 Rest of South America
- 16. Competitive Analysis
- 16.1. Global Market Share Analysis 2024
- 16.2. Company Profiles
- 16.2.1 Merck KGaA
- 16.2.1.1. Overview
- 16.2.1.2. Products
- 16.2.1.3. SWOT Analysis
- 16.2.1.4. Recent Developments
- 16.2.1.5. Financials (Based on Availability)
- 16.2.2 PBS Biotech Inc
- 16.2.2.1. Overview
- 16.2.2.2. Products
- 16.2.2.3. SWOT Analysis
- 16.2.2.4. Recent Developments
- 16.2.2.5. Financials (Based on Availability)
- 16.2.3 Boehringer Ingelheim International GmbH
- 16.2.3.1. Overview
- 16.2.3.2. Products
- 16.2.3.3. SWOT Analysis
- 16.2.3.4. Recent Developments
- 16.2.3.5. Financials (Based on Availability)
- 16.2.4 3M
- 16.2.4.1. Overview
- 16.2.4.2. Products
- 16.2.4.3. SWOT Analysis
- 16.2.4.4. Recent Developments
- 16.2.4.5. Financials (Based on Availability)
- 16.2.5 Danaher Corporation (Cytiva)
- 16.2.5.1. Overview
- 16.2.5.2. Products
- 16.2.5.3. SWOT Analysis
- 16.2.5.4. Recent Developments
- 16.2.5.5. Financials (Based on Availability)
- 16.2.6 Distek Inc
- 16.2.6.1. Overview
- 16.2.6.2. Products
- 16.2.6.3. SWOT Analysis
- 16.2.6.4. Recent Developments
- 16.2.6.5. Financials (Based on Availability)
- 16.2.7 Eppendorf AG
- 16.2.7.1. Overview
- 16.2.7.2. Products
- 16.2.7.3. SWOT Analysis
- 16.2.7.4. Recent Developments
- 16.2.7.5. Financials (Based on Availability)
- 16.2.8 Sartorius AG
- 16.2.8.1. Overview
- 16.2.8.2. Products
- 16.2.8.3. SWOT Analysis
- 16.2.8.4. Recent Developments
- 16.2.8.5. Financials (Based on Availability)
- 16.2.9 CESCO Bioengineering Co Ltd
- 16.2.9.1. Overview
- 16.2.9.2. Products
- 16.2.9.3. SWOT Analysis
- 16.2.9.4. Recent Developments
- 16.2.9.5. Financials (Based on Availability)
- 16.2.10 ABEC Inc
- 16.2.10.1. Overview
- 16.2.10.2. Products
- 16.2.10.3. SWOT Analysis
- 16.2.10.4. Recent Developments
- 16.2.10.5. Financials (Based on Availability)
- 16.2.11 Celltainer Biotech BV
- 16.2.11.1. Overview
- 16.2.11.2. Products
- 16.2.11.3. SWOT Analysis
- 16.2.11.4. Recent Developments
- 16.2.11.5. Financials (Based on Availability)
- 16.2.12 OmniBRx Biotechnologies
- 16.2.12.1. Overview
- 16.2.12.2. Products
- 16.2.12.3. SWOT Analysis
- 16.2.12.4. Recent Developments
- 16.2.12.5. Financials (Based on Availability)
- 16.2.13 Thermo Fisher Scientific
- 16.2.13.1. Overview
- 16.2.13.2. Products
- 16.2.13.3. SWOT Analysis
- 16.2.13.4. Recent Developments
- 16.2.13.5. Financials (Based on Availability)
- 16.2.1 Merck KGaA
List of Figures
- Figure 1: Global Single Use Bioprocessing Industry Revenue Breakdown (Million, %) by Region 2024 & 2032
- Figure 2: North America Single Use Bioprocessing Industry Revenue (Million), by Country 2024 & 2032
- Figure 3: North America Single Use Bioprocessing Industry Revenue Share (%), by Country 2024 & 2032
- Figure 4: Europe Single Use Bioprocessing Industry Revenue (Million), by Country 2024 & 2032
- Figure 5: Europe Single Use Bioprocessing Industry Revenue Share (%), by Country 2024 & 2032
- Figure 6: Asia Pacific Single Use Bioprocessing Industry Revenue (Million), by Country 2024 & 2032
- Figure 7: Asia Pacific Single Use Bioprocessing Industry Revenue Share (%), by Country 2024 & 2032
- Figure 8: Middle East and Africa Single Use Bioprocessing Industry Revenue (Million), by Country 2024 & 2032
- Figure 9: Middle East and Africa Single Use Bioprocessing Industry Revenue Share (%), by Country 2024 & 2032
- Figure 10: South America Single Use Bioprocessing Industry Revenue (Million), by Country 2024 & 2032
- Figure 11: South America Single Use Bioprocessing Industry Revenue Share (%), by Country 2024 & 2032
- Figure 12: North America Single Use Bioprocessing Industry Revenue (Million), by Product 2024 & 2032
- Figure 13: North America Single Use Bioprocessing Industry Revenue Share (%), by Product 2024 & 2032
- Figure 14: North America Single Use Bioprocessing Industry Revenue (Million), by Application 2024 & 2032
- Figure 15: North America Single Use Bioprocessing Industry Revenue Share (%), by Application 2024 & 2032
- Figure 16: North America Single Use Bioprocessing Industry Revenue (Million), by End User 2024 & 2032
- Figure 17: North America Single Use Bioprocessing Industry Revenue Share (%), by End User 2024 & 2032
- Figure 18: North America Single Use Bioprocessing Industry Revenue (Million), by Country 2024 & 2032
- Figure 19: North America Single Use Bioprocessing Industry Revenue Share (%), by Country 2024 & 2032
- Figure 20: Europe Single Use Bioprocessing Industry Revenue (Million), by Product 2024 & 2032
- Figure 21: Europe Single Use Bioprocessing Industry Revenue Share (%), by Product 2024 & 2032
- Figure 22: Europe Single Use Bioprocessing Industry Revenue (Million), by Application 2024 & 2032
- Figure 23: Europe Single Use Bioprocessing Industry Revenue Share (%), by Application 2024 & 2032
- Figure 24: Europe Single Use Bioprocessing Industry Revenue (Million), by End User 2024 & 2032
- Figure 25: Europe Single Use Bioprocessing Industry Revenue Share (%), by End User 2024 & 2032
- Figure 26: Europe Single Use Bioprocessing Industry Revenue (Million), by Country 2024 & 2032
- Figure 27: Europe Single Use Bioprocessing Industry Revenue Share (%), by Country 2024 & 2032
- Figure 28: Asia Pacific Single Use Bioprocessing Industry Revenue (Million), by Product 2024 & 2032
- Figure 29: Asia Pacific Single Use Bioprocessing Industry Revenue Share (%), by Product 2024 & 2032
- Figure 30: Asia Pacific Single Use Bioprocessing Industry Revenue (Million), by Application 2024 & 2032
- Figure 31: Asia Pacific Single Use Bioprocessing Industry Revenue Share (%), by Application 2024 & 2032
- Figure 32: Asia Pacific Single Use Bioprocessing Industry Revenue (Million), by End User 2024 & 2032
- Figure 33: Asia Pacific Single Use Bioprocessing Industry Revenue Share (%), by End User 2024 & 2032
- Figure 34: Asia Pacific Single Use Bioprocessing Industry Revenue (Million), by Country 2024 & 2032
- Figure 35: Asia Pacific Single Use Bioprocessing Industry Revenue Share (%), by Country 2024 & 2032
- Figure 36: Middle East and Africa Single Use Bioprocessing Industry Revenue (Million), by Product 2024 & 2032
- Figure 37: Middle East and Africa Single Use Bioprocessing Industry Revenue Share (%), by Product 2024 & 2032
- Figure 38: Middle East and Africa Single Use Bioprocessing Industry Revenue (Million), by Application 2024 & 2032
- Figure 39: Middle East and Africa Single Use Bioprocessing Industry Revenue Share (%), by Application 2024 & 2032
- Figure 40: Middle East and Africa Single Use Bioprocessing Industry Revenue (Million), by End User 2024 & 2032
- Figure 41: Middle East and Africa Single Use Bioprocessing Industry Revenue Share (%), by End User 2024 & 2032
- Figure 42: Middle East and Africa Single Use Bioprocessing Industry Revenue (Million), by Country 2024 & 2032
- Figure 43: Middle East and Africa Single Use Bioprocessing Industry Revenue Share (%), by Country 2024 & 2032
- Figure 44: South America Single Use Bioprocessing Industry Revenue (Million), by Product 2024 & 2032
- Figure 45: South America Single Use Bioprocessing Industry Revenue Share (%), by Product 2024 & 2032
- Figure 46: South America Single Use Bioprocessing Industry Revenue (Million), by Application 2024 & 2032
- Figure 47: South America Single Use Bioprocessing Industry Revenue Share (%), by Application 2024 & 2032
- Figure 48: South America Single Use Bioprocessing Industry Revenue (Million), by End User 2024 & 2032
- Figure 49: South America Single Use Bioprocessing Industry Revenue Share (%), by End User 2024 & 2032
- Figure 50: South America Single Use Bioprocessing Industry Revenue (Million), by Country 2024 & 2032
- Figure 51: South America Single Use Bioprocessing Industry Revenue Share (%), by Country 2024 & 2032
List of Tables
- Table 1: Global Single Use Bioprocessing Industry Revenue Million Forecast, by Region 2019 & 2032
- Table 2: Global Single Use Bioprocessing Industry Revenue Million Forecast, by Product 2019 & 2032
- Table 3: Global Single Use Bioprocessing Industry Revenue Million Forecast, by Application 2019 & 2032
- Table 4: Global Single Use Bioprocessing Industry Revenue Million Forecast, by End User 2019 & 2032
- Table 5: Global Single Use Bioprocessing Industry Revenue Million Forecast, by Region 2019 & 2032
- Table 6: Global Single Use Bioprocessing Industry Revenue Million Forecast, by Country 2019 & 2032
- Table 7: United States Single Use Bioprocessing Industry Revenue (Million) Forecast, by Application 2019 & 2032
- Table 8: Canada Single Use Bioprocessing Industry Revenue (Million) Forecast, by Application 2019 & 2032
- Table 9: Mexico Single Use Bioprocessing Industry Revenue (Million) Forecast, by Application 2019 & 2032
- Table 10: Global Single Use Bioprocessing Industry Revenue Million Forecast, by Country 2019 & 2032
- Table 11: Germany Single Use Bioprocessing Industry Revenue (Million) Forecast, by Application 2019 & 2032
- Table 12: United Kingdom Single Use Bioprocessing Industry Revenue (Million) Forecast, by Application 2019 & 2032
- Table 13: France Single Use Bioprocessing Industry Revenue (Million) Forecast, by Application 2019 & 2032
- Table 14: Italy Single Use Bioprocessing Industry Revenue (Million) Forecast, by Application 2019 & 2032
- Table 15: Spain Single Use Bioprocessing Industry Revenue (Million) Forecast, by Application 2019 & 2032
- Table 16: Rest of Europe Single Use Bioprocessing Industry Revenue (Million) Forecast, by Application 2019 & 2032
- Table 17: Global Single Use Bioprocessing Industry Revenue Million Forecast, by Country 2019 & 2032
- Table 18: China Single Use Bioprocessing Industry Revenue (Million) Forecast, by Application 2019 & 2032
- Table 19: Japan Single Use Bioprocessing Industry Revenue (Million) Forecast, by Application 2019 & 2032
- Table 20: India Single Use Bioprocessing Industry Revenue (Million) Forecast, by Application 2019 & 2032
- Table 21: Australia Single Use Bioprocessing Industry Revenue (Million) Forecast, by Application 2019 & 2032
- Table 22: South Korea Single Use Bioprocessing Industry Revenue (Million) Forecast, by Application 2019 & 2032
- Table 23: Rest of Asia Pacific Single Use Bioprocessing Industry Revenue (Million) Forecast, by Application 2019 & 2032
- Table 24: Global Single Use Bioprocessing Industry Revenue Million Forecast, by Country 2019 & 2032
- Table 25: GCC Single Use Bioprocessing Industry Revenue (Million) Forecast, by Application 2019 & 2032
- Table 26: South Africa Single Use Bioprocessing Industry Revenue (Million) Forecast, by Application 2019 & 2032
- Table 27: Rest of Middle East and Africa Single Use Bioprocessing Industry Revenue (Million) Forecast, by Application 2019 & 2032
- Table 28: Global Single Use Bioprocessing Industry Revenue Million Forecast, by Country 2019 & 2032
- Table 29: Brazil Single Use Bioprocessing Industry Revenue (Million) Forecast, by Application 2019 & 2032
- Table 30: Argentina Single Use Bioprocessing Industry Revenue (Million) Forecast, by Application 2019 & 2032
- Table 31: Rest of South America Single Use Bioprocessing Industry Revenue (Million) Forecast, by Application 2019 & 2032
- Table 32: Global Single Use Bioprocessing Industry Revenue Million Forecast, by Product 2019 & 2032
- Table 33: Global Single Use Bioprocessing Industry Revenue Million Forecast, by Application 2019 & 2032
- Table 34: Global Single Use Bioprocessing Industry Revenue Million Forecast, by End User 2019 & 2032
- Table 35: Global Single Use Bioprocessing Industry Revenue Million Forecast, by Country 2019 & 2032
- Table 36: United States Single Use Bioprocessing Industry Revenue (Million) Forecast, by Application 2019 & 2032
- Table 37: Canada Single Use Bioprocessing Industry Revenue (Million) Forecast, by Application 2019 & 2032
- Table 38: Mexico Single Use Bioprocessing Industry Revenue (Million) Forecast, by Application 2019 & 2032
- Table 39: Global Single Use Bioprocessing Industry Revenue Million Forecast, by Product 2019 & 2032
- Table 40: Global Single Use Bioprocessing Industry Revenue Million Forecast, by Application 2019 & 2032
- Table 41: Global Single Use Bioprocessing Industry Revenue Million Forecast, by End User 2019 & 2032
- Table 42: Global Single Use Bioprocessing Industry Revenue Million Forecast, by Country 2019 & 2032
- Table 43: Germany Single Use Bioprocessing Industry Revenue (Million) Forecast, by Application 2019 & 2032
- Table 44: United Kingdom Single Use Bioprocessing Industry Revenue (Million) Forecast, by Application 2019 & 2032
- Table 45: France Single Use Bioprocessing Industry Revenue (Million) Forecast, by Application 2019 & 2032
- Table 46: Italy Single Use Bioprocessing Industry Revenue (Million) Forecast, by Application 2019 & 2032
- Table 47: Spain Single Use Bioprocessing Industry Revenue (Million) Forecast, by Application 2019 & 2032
- Table 48: Rest of Europe Single Use Bioprocessing Industry Revenue (Million) Forecast, by Application 2019 & 2032
- Table 49: Global Single Use Bioprocessing Industry Revenue Million Forecast, by Product 2019 & 2032
- Table 50: Global Single Use Bioprocessing Industry Revenue Million Forecast, by Application 2019 & 2032
- Table 51: Global Single Use Bioprocessing Industry Revenue Million Forecast, by End User 2019 & 2032
- Table 52: Global Single Use Bioprocessing Industry Revenue Million Forecast, by Country 2019 & 2032
- Table 53: China Single Use Bioprocessing Industry Revenue (Million) Forecast, by Application 2019 & 2032
- Table 54: Japan Single Use Bioprocessing Industry Revenue (Million) Forecast, by Application 2019 & 2032
- Table 55: India Single Use Bioprocessing Industry Revenue (Million) Forecast, by Application 2019 & 2032
- Table 56: Australia Single Use Bioprocessing Industry Revenue (Million) Forecast, by Application 2019 & 2032
- Table 57: South Korea Single Use Bioprocessing Industry Revenue (Million) Forecast, by Application 2019 & 2032
- Table 58: Rest of Asia Pacific Single Use Bioprocessing Industry Revenue (Million) Forecast, by Application 2019 & 2032
- Table 59: Global Single Use Bioprocessing Industry Revenue Million Forecast, by Product 2019 & 2032
- Table 60: Global Single Use Bioprocessing Industry Revenue Million Forecast, by Application 2019 & 2032
- Table 61: Global Single Use Bioprocessing Industry Revenue Million Forecast, by End User 2019 & 2032
- Table 62: Global Single Use Bioprocessing Industry Revenue Million Forecast, by Country 2019 & 2032
- Table 63: GCC Single Use Bioprocessing Industry Revenue (Million) Forecast, by Application 2019 & 2032
- Table 64: South Africa Single Use Bioprocessing Industry Revenue (Million) Forecast, by Application 2019 & 2032
- Table 65: Rest of Middle East and Africa Single Use Bioprocessing Industry Revenue (Million) Forecast, by Application 2019 & 2032
- Table 66: Global Single Use Bioprocessing Industry Revenue Million Forecast, by Product 2019 & 2032
- Table 67: Global Single Use Bioprocessing Industry Revenue Million Forecast, by Application 2019 & 2032
- Table 68: Global Single Use Bioprocessing Industry Revenue Million Forecast, by End User 2019 & 2032
- Table 69: Global Single Use Bioprocessing Industry Revenue Million Forecast, by Country 2019 & 2032
- Table 70: Brazil Single Use Bioprocessing Industry Revenue (Million) Forecast, by Application 2019 & 2032
- Table 71: Argentina Single Use Bioprocessing Industry Revenue (Million) Forecast, by Application 2019 & 2032
- Table 72: Rest of South America Single Use Bioprocessing Industry Revenue (Million) Forecast, by Application 2019 & 2032
Frequently Asked Questions
1. What is the projected Compound Annual Growth Rate (CAGR) of the Single Use Bioprocessing Industry?
The projected CAGR is approximately 11.50%.
2. Which companies are prominent players in the Single Use Bioprocessing Industry?
Key companies in the market include Merck KGaA, PBS Biotech Inc, Boehringer Ingelheim International GmbH, 3M, Danaher Corporation (Cytiva), Distek Inc, Eppendorf AG, Sartorius AG, CESCO Bioengineering Co Ltd, ABEC Inc, Celltainer Biotech BV, OmniBRx Biotechnologies, Thermo Fisher Scientific.
3. What are the main segments of the Single Use Bioprocessing Industry?
The market segments include Product, Application, End User.
4. Can you provide details about the market size?
The market size is estimated to be USD XX Million as of 2022.
5. What are some drivers contributing to market growth?
Faster Implementation and Lower Risk of Product Cross-contamination; Increasing Demand for Biopharmaceuticals; Lower Costs and Lesser Environmental Impact of Single-use Bioprocessing Technologies.
6. What are the notable trends driving market growth?
Biopharmaceutical Manufacturer Segment is Expected to Witness Significant Growth Over the Forecast Period.
7. Are there any restraints impacting market growth?
Issues Related to Leachables and Extractables.
8. Can you provide examples of recent developments in the market?
October 2022: PharmNXT Biotech launched its first integrated manufacturing unit in Pune to provide single-use bioprocessing solutions. With this launch, the facility addresses the challenges to biologics manufacturing in India.
9. What pricing options are available for accessing the report?
Pricing options include single-user, multi-user, and enterprise licenses priced at USD 4750, USD 5250, and USD 8750 respectively.
10. Is the market size provided in terms of value or volume?
The market size is provided in terms of value, measured in Million.
11. Are there any specific market keywords associated with the report?
Yes, the market keyword associated with the report is "Single Use Bioprocessing Industry," which aids in identifying and referencing the specific market segment covered.
12. How do I determine which pricing option suits my needs best?
The pricing options vary based on user requirements and access needs. Individual users may opt for single-user licenses, while businesses requiring broader access may choose multi-user or enterprise licenses for cost-effective access to the report.
13. Are there any additional resources or data provided in the Single Use Bioprocessing Industry report?
While the report offers comprehensive insights, it's advisable to review the specific contents or supplementary materials provided to ascertain if additional resources or data are available.
14. How can I stay updated on further developments or reports in the Single Use Bioprocessing Industry?
To stay informed about further developments, trends, and reports in the Single Use Bioprocessing Industry, consider subscribing to industry newsletters, following relevant companies and organizations, or regularly checking reputable industry news sources and publications.
Methodology
Step 1 - Identification of Relevant Samples Size from Population Database


Step 2 - Approaches for Defining Global Market Size (Value, Volume* & Price*)

Note*: In applicable scenarios
Step 3 - Data Sources
Primary Research
- Web Analytics
- Survey Reports
- Research Institute
- Latest Research Reports
- Opinion Leaders
Secondary Research
- Annual Reports
- White Paper
- Latest Press Release
- Industry Association
- Paid Database
- Investor Presentations

Step 4 - Data Triangulation
Involves using different sources of information in order to increase the validity of a study
These sources are likely to be stakeholders in a program - participants, other researchers, program staff, other community members, and so on.
Then we put all data in single framework & apply various statistical tools to find out the dynamic on the market.
During the analysis stage, feedback from the stakeholder groups would be compared to determine areas of agreement as well as areas of divergence


