
Key Insights
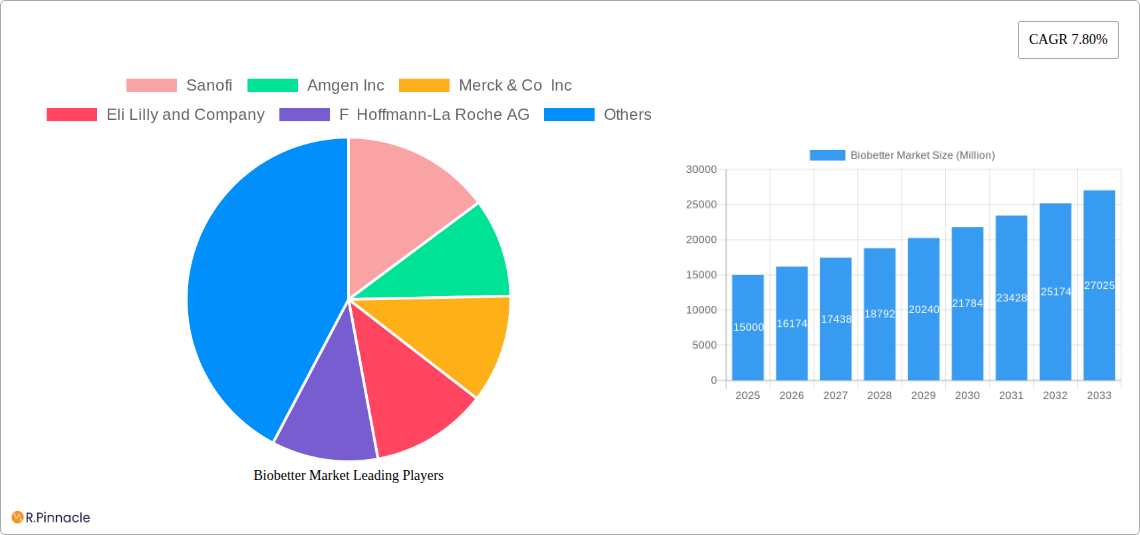
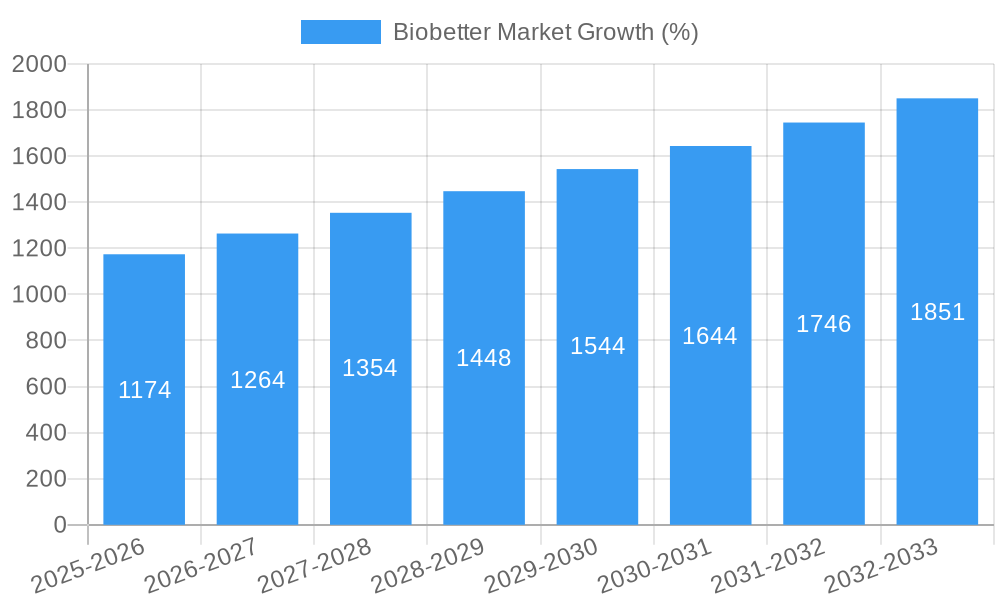
The biobetter market, exhibiting a robust CAGR of 7.80% from 2019 to 2024, is poised for significant growth between 2025 and 2033. Driven by increasing prevalence of chronic diseases like cancer, diabetes, and renal disorders, coupled with rising demand for safer, more effective, and affordable biologics, the market is experiencing a surge in innovation. Advancements in biotechnology, particularly in areas like biosimilar development and targeted therapies, are fueling this expansion. The subcutaneous route of administration currently holds the largest market share due to its convenience and ease of use, while hospital pharmacies remain the primary distribution channel. However, the online pharmacy segment is experiencing rapid growth fueled by increasing internet penetration and the convenience it offers patients. Key players, including Sanofi, Amgen, Merck, Eli Lilly, Roche, Novo Nordisk, Pfizer, Biogen, CSL Behring, and Genentech, are strategically investing in R&D to expand their product portfolios and solidify their market positions. Competition is intense, with companies focusing on developing biobetters with enhanced efficacy, safety profiles, and longer half-lives.
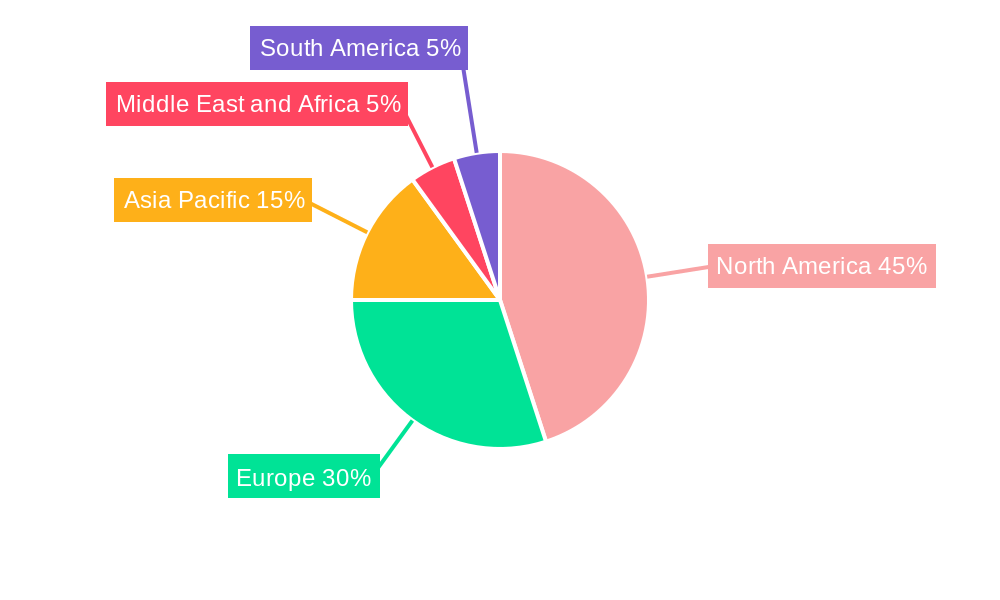
Segment-wise, erythropoietin biobetters and insulin biobetters currently dominate, driven by the large patient populations requiring these therapies. However, the monoclonal antibodies biobetters segment is projected to experience the fastest growth rate over the forecast period due to the increasing number of novel monoclonal antibody-based therapeutics entering the market. Geographically, North America and Europe currently hold the largest market shares, but the Asia-Pacific region is projected to witness substantial growth due to increasing healthcare expenditure and rising awareness of biobetter therapies. The increasing regulatory approvals for biosimilars and biobetters across major regions is further bolstering the market expansion. This combination of factors suggests a continuously expanding and evolving market landscape with substantial opportunities for both established players and emerging innovators.
Biobetter Market Report: A Comprehensive Analysis (2019-2033)
This in-depth report provides a comprehensive analysis of the Biobetter Market, offering valuable insights for industry professionals, investors, and strategic decision-makers. With a study period spanning 2019-2033, a base year of 2025, and a forecast period of 2025-2033, this report leverages extensive market research and data analysis to provide a clear understanding of current market dynamics and future growth potential. The global Biobetter Market is projected to reach xx Million by 2033, exhibiting a robust CAGR of xx% during the forecast period.
Biobetter Market Market Structure & Innovation Trends
The Biobetter market is characterized by a moderately concentrated landscape with key players like Sanofi, Amgen Inc, Merck & Co Inc, Eli Lilly and Company, F Hoffmann-La Roche AG, Novo Nordisk A/S, Pfizer Inc, Biogen Inc, CSL Behring, and Genentech USA Inc holding significant market share. Market concentration is influenced by factors such as research and development capabilities, regulatory approvals, and established distribution networks. Innovation is a crucial driver, with companies continuously investing in developing improved biobetters with enhanced efficacy, safety, and convenience. The regulatory landscape plays a significant role, impacting the speed and cost of bringing new products to market. The market also faces competition from biosimilars and other biological drug alternatives. Mergers and acquisitions (M&A) activities are prevalent, with deal values exceeding xx Million in recent years, driving consolidation and expanding market presence. For example, the M&A activity between [Insert Example M&A Deal if data is available and replace bracket with details] resulted in xx Million increase in market share.
- Market Concentration: Moderate, with top 10 players holding xx% market share.
- Innovation Drivers: Enhanced efficacy, improved safety profiles, and convenient administration routes.
- Regulatory Frameworks: Stringent regulations impacting timelines and costs.
- Product Substitutes: Biosimilars and other biological drug alternatives.
- End-User Demographics: Growing prevalence of chronic diseases like cancer and diabetes.
- M&A Activities: Significant M&A activity driving consolidation and expansion.
Biobetter Market Market Dynamics & Trends
The Biobetter market is experiencing substantial growth driven by several factors. The increasing prevalence of chronic diseases such as cancer, diabetes, and autoimmune disorders is a primary growth catalyst. Technological advancements in biopharmaceutical manufacturing and delivery systems are further fueling market expansion. Consumer preferences are shifting towards more convenient and effective treatment options, including subcutaneous and oral administration routes, influencing product development strategies. The competitive landscape is dynamic, with ongoing innovation and competition driving improvements in product quality and accessibility. Market penetration is increasing rapidly especially in developed economies with strong healthcare infrastructure.
Dominant Regions & Segments in Biobetter Market
The North American region currently dominates the Biobetter market, driven by high healthcare expenditure, advanced healthcare infrastructure, and a large patient population suffering from chronic diseases. However, the Asia-Pacific region is projected to witness the fastest growth rate due to rising healthcare spending, increasing prevalence of chronic diseases, and growing adoption of advanced therapies.
- Leading Region: North America
- Fastest-Growing Region: Asia-Pacific
- Dominant Route of Administration: Subcutaneous (driven by patient convenience and ease of self-administration)
- Key Distribution Channel: Hospital Pharmacies (due to the complexity and specialized handling requirements of biobetters)
- Leading Drug Class: Monoclonal Antibodies Biobetters (due to their diverse therapeutic applications)
- Largest Application Area: Cancer (because of the high unmet need and significant R&D investment)
Key Drivers for Dominant Regions:
- North America: Strong healthcare infrastructure, high R&D investment, and large patient population.
- Asia-Pacific: Rising healthcare spending, increasing prevalence of chronic diseases, and growing adoption of advanced therapies.
Biobetter Market Product Innovations
Recent product innovations in the Biobetter market focus on improving drug delivery, increasing efficacy, and enhancing patient convenience. This includes the development of subcutaneous formulations for previously intravenous-only drugs, as well as the use of novel drug conjugates and targeted delivery systems. These innovations are designed to address unmet medical needs and improve treatment outcomes, offering significant competitive advantages in a rapidly evolving market.
Report Scope & Segmentation Analysis
This report comprehensively analyzes the Biobetter market across various segments:
- Route of Administration: Subcutaneous, Oral, Inhaled, Intravenous, Others. Subcutaneous is projected to show the fastest growth due to patient preference.
- Distribution Channel: Hospital Pharmacies, Retail Pharmacies, Online Pharmacies. Hospital Pharmacies currently hold the largest market share.
- Drug Class: Erythropoietin Biobetters, Insulin Biobetters, G-CSF Bioreactors, Monoclonal Antibodies Biobetters, Anti-Haemophilic Factor, Other Biological Drug Biobetters. Monoclonal Antibodies dominate the market currently.
- Application: Cancer, Diabetes, Renal Disease, Neurodegenerative Disease, Genetic Disorders, Others. Cancer treatment represents the largest application segment.
Each segment is analyzed based on market size, growth projections, and competitive dynamics, providing a granular understanding of market opportunities.
Key Drivers of Biobetter Market Growth
The Biobetter market's growth is fueled by several key factors: rising prevalence of chronic diseases, increasing demand for improved therapies, advancements in biotechnology and manufacturing technologies, and favorable regulatory environments in key markets. The development of more convenient and effective administration methods further accelerates market expansion.
Challenges in the Biobetter Market Sector
Challenges include stringent regulatory hurdles, complexities in manufacturing and supply chain management, and intense competition from biosimilars and other innovative therapies. High research and development costs also present a barrier to market entry for smaller companies. These factors, if not managed effectively, could potentially impact market growth.
Emerging Opportunities in Biobetter Market
Emerging opportunities lie in personalized medicine, innovative drug delivery systems, and expanding applications in emerging markets. The development of biobetters for rare diseases and orphan drugs presents a substantial area of growth.
Leading Players in the Biobetter Market Market
- Sanofi
- Amgen Inc
- Merck & Co Inc
- Eli Lilly and Company
- F Hoffmann-La Roche AG
- Novo Nordisk A/S
- Pfizer Inc
- Biogen Inc
- CSL Behring
- Genentech USA Inc
Key Developments in Biobetter Market Industry
- January 2023: Celltrion Healthcare submitted a BLA for Remsima SC, a subcutaneous infliximab biobetter.
- December 2022: Japan's MHLW approved Gazyva (obinutuzumab) for an additional indication in chronic lymphocytic leukemia.
These developments highlight the ongoing innovation and expansion within the biobetter market.
Future Outlook for Biobetter Market Market
The Biobetter market is poised for continued growth, driven by factors such as technological advancements, rising healthcare spending, and the increasing prevalence of chronic diseases. Strategic partnerships, focused R&D investments, and the development of innovative products will shape the future landscape of this dynamic market.
Biobetter Market Segmentation
-
1. Drug Class
- 1.1. Erythropoietin Biobetters
- 1.2. Insulin Biobetters
- 1.3. G-CSF Bioreactors
- 1.4. Monoclonal Antibodies Biobetters
- 1.5. Anti-Haemophilic Factor
- 1.6. Other Biological Drug Biobetters
-
2. Application
- 2.1. Cancer
- 2.2. Diabetes
- 2.3. Renal Disease
- 2.4. Neurodegenerative Disease
- 2.5. Genetic Disorders
- 2.6. Others
-
3. Route of Administration
- 3.1. Subcutaneous
- 3.2. Oral
- 3.3. Inhaled
- 3.4. Intravenous
- 3.5. Others
-
4. Distribution Channel
- 4.1. Hospital Pharmacies
- 4.2. Retail Pharmacies
- 4.3. Online Pharmacies
Biobetter Market Segmentation By Geography
-
1. North America
- 1.1. United States
- 1.2. Canada
- 1.3. Mexico
-
2. Europe
- 2.1. Germany
- 2.2. United Kingdom
- 2.3. France
- 2.4. Italy
- 2.5. Spain
- 2.6. Rest of Europe
-
3. Asia Pacific
- 3.1. China
- 3.2. Japan
- 3.3. India
- 3.4. Australia
- 3.5. South Korea
- 3.6. Rest of Asia Pacific
-
4. Middle East and Africa
- 4.1. GCC
- 4.2. South Africa
- 4.3. Rest of Middle East and Africa
-
5. South America
- 5.1. Brazil
- 5.2. Argentina
- 5.3. Rest of South America
Biobetter Market REPORT HIGHLIGHTS
| Aspects | Details |
|---|---|
| Study Period | 2019-2033 |
| Base Year | 2024 |
| Estimated Year | 2025 |
| Forecast Period | 2025-2033 |
| Historical Period | 2019-2024 |
| Growth Rate | CAGR of 7.80% from 2019-2033 |
| Segmentation |
|
Table of Contents
- 1. Introduction
- 1.1. Research Scope
- 1.2. Market Segmentation
- 1.3. Research Methodology
- 1.4. Definitions and Assumptions
- 2. Executive Summary
- 2.1. Introduction
- 3. Market Dynamics
- 3.1. Introduction
- 3.2. Market Drivers
- 3.2.1. Superior Therapeutic Efficacy and Lower Adverse Effects; Comparatively Easier and Less Costly Manufacturing Processes; Non- Patent and Market Exclusivity; Longer product Half-life and Less Dosing Frequency; High Investment Opportunities
- 3.3. Market Restrains
- 3.3.1. High Investment in Research and Development; Increasing Biosimilar Competition
- 3.4. Market Trends
- 3.4.1. Cancer Segment is Expected to Hold a Significant Market Share Over the Forecast Period
- 4. Market Factor Analysis
- 4.1. Porters Five Forces
- 4.2. Supply/Value Chain
- 4.3. PESTEL analysis
- 4.4. Market Entropy
- 4.5. Patent/Trademark Analysis
- 5. Global Biobetter Market Analysis, Insights and Forecast, 2019-2031
- 5.1. Market Analysis, Insights and Forecast - by Drug Class
- 5.1.1. Erythropoietin Biobetters
- 5.1.2. Insulin Biobetters
- 5.1.3. G-CSF Bioreactors
- 5.1.4. Monoclonal Antibodies Biobetters
- 5.1.5. Anti-Haemophilic Factor
- 5.1.6. Other Biological Drug Biobetters
- 5.2. Market Analysis, Insights and Forecast - by Application
- 5.2.1. Cancer
- 5.2.2. Diabetes
- 5.2.3. Renal Disease
- 5.2.4. Neurodegenerative Disease
- 5.2.5. Genetic Disorders
- 5.2.6. Others
- 5.3. Market Analysis, Insights and Forecast - by Route of Administration
- 5.3.1. Subcutaneous
- 5.3.2. Oral
- 5.3.3. Inhaled
- 5.3.4. Intravenous
- 5.3.5. Others
- 5.4. Market Analysis, Insights and Forecast - by Distribution Channel
- 5.4.1. Hospital Pharmacies
- 5.4.2. Retail Pharmacies
- 5.4.3. Online Pharmacies
- 5.5. Market Analysis, Insights and Forecast - by Region
- 5.5.1. North America
- 5.5.2. Europe
- 5.5.3. Asia Pacific
- 5.5.4. Middle East and Africa
- 5.5.5. South America
- 5.1. Market Analysis, Insights and Forecast - by Drug Class
- 6. North America Biobetter Market Analysis, Insights and Forecast, 2019-2031
- 6.1. Market Analysis, Insights and Forecast - by Drug Class
- 6.1.1. Erythropoietin Biobetters
- 6.1.2. Insulin Biobetters
- 6.1.3. G-CSF Bioreactors
- 6.1.4. Monoclonal Antibodies Biobetters
- 6.1.5. Anti-Haemophilic Factor
- 6.1.6. Other Biological Drug Biobetters
- 6.2. Market Analysis, Insights and Forecast - by Application
- 6.2.1. Cancer
- 6.2.2. Diabetes
- 6.2.3. Renal Disease
- 6.2.4. Neurodegenerative Disease
- 6.2.5. Genetic Disorders
- 6.2.6. Others
- 6.3. Market Analysis, Insights and Forecast - by Route of Administration
- 6.3.1. Subcutaneous
- 6.3.2. Oral
- 6.3.3. Inhaled
- 6.3.4. Intravenous
- 6.3.5. Others
- 6.4. Market Analysis, Insights and Forecast - by Distribution Channel
- 6.4.1. Hospital Pharmacies
- 6.4.2. Retail Pharmacies
- 6.4.3. Online Pharmacies
- 6.1. Market Analysis, Insights and Forecast - by Drug Class
- 7. Europe Biobetter Market Analysis, Insights and Forecast, 2019-2031
- 7.1. Market Analysis, Insights and Forecast - by Drug Class
- 7.1.1. Erythropoietin Biobetters
- 7.1.2. Insulin Biobetters
- 7.1.3. G-CSF Bioreactors
- 7.1.4. Monoclonal Antibodies Biobetters
- 7.1.5. Anti-Haemophilic Factor
- 7.1.6. Other Biological Drug Biobetters
- 7.2. Market Analysis, Insights and Forecast - by Application
- 7.2.1. Cancer
- 7.2.2. Diabetes
- 7.2.3. Renal Disease
- 7.2.4. Neurodegenerative Disease
- 7.2.5. Genetic Disorders
- 7.2.6. Others
- 7.3. Market Analysis, Insights and Forecast - by Route of Administration
- 7.3.1. Subcutaneous
- 7.3.2. Oral
- 7.3.3. Inhaled
- 7.3.4. Intravenous
- 7.3.5. Others
- 7.4. Market Analysis, Insights and Forecast - by Distribution Channel
- 7.4.1. Hospital Pharmacies
- 7.4.2. Retail Pharmacies
- 7.4.3. Online Pharmacies
- 7.1. Market Analysis, Insights and Forecast - by Drug Class
- 8. Asia Pacific Biobetter Market Analysis, Insights and Forecast, 2019-2031
- 8.1. Market Analysis, Insights and Forecast - by Drug Class
- 8.1.1. Erythropoietin Biobetters
- 8.1.2. Insulin Biobetters
- 8.1.3. G-CSF Bioreactors
- 8.1.4. Monoclonal Antibodies Biobetters
- 8.1.5. Anti-Haemophilic Factor
- 8.1.6. Other Biological Drug Biobetters
- 8.2. Market Analysis, Insights and Forecast - by Application
- 8.2.1. Cancer
- 8.2.2. Diabetes
- 8.2.3. Renal Disease
- 8.2.4. Neurodegenerative Disease
- 8.2.5. Genetic Disorders
- 8.2.6. Others
- 8.3. Market Analysis, Insights and Forecast - by Route of Administration
- 8.3.1. Subcutaneous
- 8.3.2. Oral
- 8.3.3. Inhaled
- 8.3.4. Intravenous
- 8.3.5. Others
- 8.4. Market Analysis, Insights and Forecast - by Distribution Channel
- 8.4.1. Hospital Pharmacies
- 8.4.2. Retail Pharmacies
- 8.4.3. Online Pharmacies
- 8.1. Market Analysis, Insights and Forecast - by Drug Class
- 9. Middle East and Africa Biobetter Market Analysis, Insights and Forecast, 2019-2031
- 9.1. Market Analysis, Insights and Forecast - by Drug Class
- 9.1.1. Erythropoietin Biobetters
- 9.1.2. Insulin Biobetters
- 9.1.3. G-CSF Bioreactors
- 9.1.4. Monoclonal Antibodies Biobetters
- 9.1.5. Anti-Haemophilic Factor
- 9.1.6. Other Biological Drug Biobetters
- 9.2. Market Analysis, Insights and Forecast - by Application
- 9.2.1. Cancer
- 9.2.2. Diabetes
- 9.2.3. Renal Disease
- 9.2.4. Neurodegenerative Disease
- 9.2.5. Genetic Disorders
- 9.2.6. Others
- 9.3. Market Analysis, Insights and Forecast - by Route of Administration
- 9.3.1. Subcutaneous
- 9.3.2. Oral
- 9.3.3. Inhaled
- 9.3.4. Intravenous
- 9.3.5. Others
- 9.4. Market Analysis, Insights and Forecast - by Distribution Channel
- 9.4.1. Hospital Pharmacies
- 9.4.2. Retail Pharmacies
- 9.4.3. Online Pharmacies
- 9.1. Market Analysis, Insights and Forecast - by Drug Class
- 10. South America Biobetter Market Analysis, Insights and Forecast, 2019-2031
- 10.1. Market Analysis, Insights and Forecast - by Drug Class
- 10.1.1. Erythropoietin Biobetters
- 10.1.2. Insulin Biobetters
- 10.1.3. G-CSF Bioreactors
- 10.1.4. Monoclonal Antibodies Biobetters
- 10.1.5. Anti-Haemophilic Factor
- 10.1.6. Other Biological Drug Biobetters
- 10.2. Market Analysis, Insights and Forecast - by Application
- 10.2.1. Cancer
- 10.2.2. Diabetes
- 10.2.3. Renal Disease
- 10.2.4. Neurodegenerative Disease
- 10.2.5. Genetic Disorders
- 10.2.6. Others
- 10.3. Market Analysis, Insights and Forecast - by Route of Administration
- 10.3.1. Subcutaneous
- 10.3.2. Oral
- 10.3.3. Inhaled
- 10.3.4. Intravenous
- 10.3.5. Others
- 10.4. Market Analysis, Insights and Forecast - by Distribution Channel
- 10.4.1. Hospital Pharmacies
- 10.4.2. Retail Pharmacies
- 10.4.3. Online Pharmacies
- 10.1. Market Analysis, Insights and Forecast - by Drug Class
- 11. North America Biobetter Market Analysis, Insights and Forecast, 2019-2031
- 11.1. Market Analysis, Insights and Forecast - By Country/Sub-region
- 11.1.1 United States
- 11.1.2 Canada
- 11.1.3 Mexico
- 12. Europe Biobetter Market Analysis, Insights and Forecast, 2019-2031
- 12.1. Market Analysis, Insights and Forecast - By Country/Sub-region
- 12.1.1 Germany
- 12.1.2 United Kingdom
- 12.1.3 France
- 12.1.4 Italy
- 12.1.5 Spain
- 12.1.6 Rest of Europe
- 13. Asia Pacific Biobetter Market Analysis, Insights and Forecast, 2019-2031
- 13.1. Market Analysis, Insights and Forecast - By Country/Sub-region
- 13.1.1 China
- 13.1.2 Japan
- 13.1.3 India
- 13.1.4 Australia
- 13.1.5 South Korea
- 13.1.6 Rest of Asia Pacific
- 14. Middle East and Africa Biobetter Market Analysis, Insights and Forecast, 2019-2031
- 14.1. Market Analysis, Insights and Forecast - By Country/Sub-region
- 14.1.1 GCC
- 14.1.2 South Africa
- 14.1.3 Rest of Middle East and Africa
- 15. South America Biobetter Market Analysis, Insights and Forecast, 2019-2031
- 15.1. Market Analysis, Insights and Forecast - By Country/Sub-region
- 15.1.1 Brazil
- 15.1.2 Argentina
- 15.1.3 Rest of South America
- 16. Competitive Analysis
- 16.1. Global Market Share Analysis 2024
- 16.2. Company Profiles
- 16.2.1 Sanofi
- 16.2.1.1. Overview
- 16.2.1.2. Products
- 16.2.1.3. SWOT Analysis
- 16.2.1.4. Recent Developments
- 16.2.1.5. Financials (Based on Availability)
- 16.2.2 Amgen Inc
- 16.2.2.1. Overview
- 16.2.2.2. Products
- 16.2.2.3. SWOT Analysis
- 16.2.2.4. Recent Developments
- 16.2.2.5. Financials (Based on Availability)
- 16.2.3 Merck & Co Inc
- 16.2.3.1. Overview
- 16.2.3.2. Products
- 16.2.3.3. SWOT Analysis
- 16.2.3.4. Recent Developments
- 16.2.3.5. Financials (Based on Availability)
- 16.2.4 Eli Lilly and Company
- 16.2.4.1. Overview
- 16.2.4.2. Products
- 16.2.4.3. SWOT Analysis
- 16.2.4.4. Recent Developments
- 16.2.4.5. Financials (Based on Availability)
- 16.2.5 F Hoffmann-La Roche AG
- 16.2.5.1. Overview
- 16.2.5.2. Products
- 16.2.5.3. SWOT Analysis
- 16.2.5.4. Recent Developments
- 16.2.5.5. Financials (Based on Availability)
- 16.2.6 Novo Nordisk A/S
- 16.2.6.1. Overview
- 16.2.6.2. Products
- 16.2.6.3. SWOT Analysis
- 16.2.6.4. Recent Developments
- 16.2.6.5. Financials (Based on Availability)
- 16.2.7 Pfizer Inc
- 16.2.7.1. Overview
- 16.2.7.2. Products
- 16.2.7.3. SWOT Analysis
- 16.2.7.4. Recent Developments
- 16.2.7.5. Financials (Based on Availability)
- 16.2.8 Biogen Inc
- 16.2.8.1. Overview
- 16.2.8.2. Products
- 16.2.8.3. SWOT Analysis
- 16.2.8.4. Recent Developments
- 16.2.8.5. Financials (Based on Availability)
- 16.2.9 CSL Behring
- 16.2.9.1. Overview
- 16.2.9.2. Products
- 16.2.9.3. SWOT Analysis
- 16.2.9.4. Recent Developments
- 16.2.9.5. Financials (Based on Availability)
- 16.2.10 Genentech USA Inc
- 16.2.10.1. Overview
- 16.2.10.2. Products
- 16.2.10.3. SWOT Analysis
- 16.2.10.4. Recent Developments
- 16.2.10.5. Financials (Based on Availability)
- 16.2.1 Sanofi
List of Figures
- Figure 1: Global Biobetter Market Revenue Breakdown (Million, %) by Region 2024 & 2032
- Figure 2: Global Biobetter Market Volume Breakdown (K Unit, %) by Region 2024 & 2032
- Figure 3: North America Biobetter Market Revenue (Million), by Country 2024 & 2032
- Figure 4: North America Biobetter Market Volume (K Unit), by Country 2024 & 2032
- Figure 5: North America Biobetter Market Revenue Share (%), by Country 2024 & 2032
- Figure 6: North America Biobetter Market Volume Share (%), by Country 2024 & 2032
- Figure 7: Europe Biobetter Market Revenue (Million), by Country 2024 & 2032
- Figure 8: Europe Biobetter Market Volume (K Unit), by Country 2024 & 2032
- Figure 9: Europe Biobetter Market Revenue Share (%), by Country 2024 & 2032
- Figure 10: Europe Biobetter Market Volume Share (%), by Country 2024 & 2032
- Figure 11: Asia Pacific Biobetter Market Revenue (Million), by Country 2024 & 2032
- Figure 12: Asia Pacific Biobetter Market Volume (K Unit), by Country 2024 & 2032
- Figure 13: Asia Pacific Biobetter Market Revenue Share (%), by Country 2024 & 2032
- Figure 14: Asia Pacific Biobetter Market Volume Share (%), by Country 2024 & 2032
- Figure 15: Middle East and Africa Biobetter Market Revenue (Million), by Country 2024 & 2032
- Figure 16: Middle East and Africa Biobetter Market Volume (K Unit), by Country 2024 & 2032
- Figure 17: Middle East and Africa Biobetter Market Revenue Share (%), by Country 2024 & 2032
- Figure 18: Middle East and Africa Biobetter Market Volume Share (%), by Country 2024 & 2032
- Figure 19: South America Biobetter Market Revenue (Million), by Country 2024 & 2032
- Figure 20: South America Biobetter Market Volume (K Unit), by Country 2024 & 2032
- Figure 21: South America Biobetter Market Revenue Share (%), by Country 2024 & 2032
- Figure 22: South America Biobetter Market Volume Share (%), by Country 2024 & 2032
- Figure 23: North America Biobetter Market Revenue (Million), by Drug Class 2024 & 2032
- Figure 24: North America Biobetter Market Volume (K Unit), by Drug Class 2024 & 2032
- Figure 25: North America Biobetter Market Revenue Share (%), by Drug Class 2024 & 2032
- Figure 26: North America Biobetter Market Volume Share (%), by Drug Class 2024 & 2032
- Figure 27: North America Biobetter Market Revenue (Million), by Application 2024 & 2032
- Figure 28: North America Biobetter Market Volume (K Unit), by Application 2024 & 2032
- Figure 29: North America Biobetter Market Revenue Share (%), by Application 2024 & 2032
- Figure 30: North America Biobetter Market Volume Share (%), by Application 2024 & 2032
- Figure 31: North America Biobetter Market Revenue (Million), by Route of Administration 2024 & 2032
- Figure 32: North America Biobetter Market Volume (K Unit), by Route of Administration 2024 & 2032
- Figure 33: North America Biobetter Market Revenue Share (%), by Route of Administration 2024 & 2032
- Figure 34: North America Biobetter Market Volume Share (%), by Route of Administration 2024 & 2032
- Figure 35: North America Biobetter Market Revenue (Million), by Distribution Channel 2024 & 2032
- Figure 36: North America Biobetter Market Volume (K Unit), by Distribution Channel 2024 & 2032
- Figure 37: North America Biobetter Market Revenue Share (%), by Distribution Channel 2024 & 2032
- Figure 38: North America Biobetter Market Volume Share (%), by Distribution Channel 2024 & 2032
- Figure 39: North America Biobetter Market Revenue (Million), by Country 2024 & 2032
- Figure 40: North America Biobetter Market Volume (K Unit), by Country 2024 & 2032
- Figure 41: North America Biobetter Market Revenue Share (%), by Country 2024 & 2032
- Figure 42: North America Biobetter Market Volume Share (%), by Country 2024 & 2032
- Figure 43: Europe Biobetter Market Revenue (Million), by Drug Class 2024 & 2032
- Figure 44: Europe Biobetter Market Volume (K Unit), by Drug Class 2024 & 2032
- Figure 45: Europe Biobetter Market Revenue Share (%), by Drug Class 2024 & 2032
- Figure 46: Europe Biobetter Market Volume Share (%), by Drug Class 2024 & 2032
- Figure 47: Europe Biobetter Market Revenue (Million), by Application 2024 & 2032
- Figure 48: Europe Biobetter Market Volume (K Unit), by Application 2024 & 2032
- Figure 49: Europe Biobetter Market Revenue Share (%), by Application 2024 & 2032
- Figure 50: Europe Biobetter Market Volume Share (%), by Application 2024 & 2032
- Figure 51: Europe Biobetter Market Revenue (Million), by Route of Administration 2024 & 2032
- Figure 52: Europe Biobetter Market Volume (K Unit), by Route of Administration 2024 & 2032
- Figure 53: Europe Biobetter Market Revenue Share (%), by Route of Administration 2024 & 2032
- Figure 54: Europe Biobetter Market Volume Share (%), by Route of Administration 2024 & 2032
- Figure 55: Europe Biobetter Market Revenue (Million), by Distribution Channel 2024 & 2032
- Figure 56: Europe Biobetter Market Volume (K Unit), by Distribution Channel 2024 & 2032
- Figure 57: Europe Biobetter Market Revenue Share (%), by Distribution Channel 2024 & 2032
- Figure 58: Europe Biobetter Market Volume Share (%), by Distribution Channel 2024 & 2032
- Figure 59: Europe Biobetter Market Revenue (Million), by Country 2024 & 2032
- Figure 60: Europe Biobetter Market Volume (K Unit), by Country 2024 & 2032
- Figure 61: Europe Biobetter Market Revenue Share (%), by Country 2024 & 2032
- Figure 62: Europe Biobetter Market Volume Share (%), by Country 2024 & 2032
- Figure 63: Asia Pacific Biobetter Market Revenue (Million), by Drug Class 2024 & 2032
- Figure 64: Asia Pacific Biobetter Market Volume (K Unit), by Drug Class 2024 & 2032
- Figure 65: Asia Pacific Biobetter Market Revenue Share (%), by Drug Class 2024 & 2032
- Figure 66: Asia Pacific Biobetter Market Volume Share (%), by Drug Class 2024 & 2032
- Figure 67: Asia Pacific Biobetter Market Revenue (Million), by Application 2024 & 2032
- Figure 68: Asia Pacific Biobetter Market Volume (K Unit), by Application 2024 & 2032
- Figure 69: Asia Pacific Biobetter Market Revenue Share (%), by Application 2024 & 2032
- Figure 70: Asia Pacific Biobetter Market Volume Share (%), by Application 2024 & 2032
- Figure 71: Asia Pacific Biobetter Market Revenue (Million), by Route of Administration 2024 & 2032
- Figure 72: Asia Pacific Biobetter Market Volume (K Unit), by Route of Administration 2024 & 2032
- Figure 73: Asia Pacific Biobetter Market Revenue Share (%), by Route of Administration 2024 & 2032
- Figure 74: Asia Pacific Biobetter Market Volume Share (%), by Route of Administration 2024 & 2032
- Figure 75: Asia Pacific Biobetter Market Revenue (Million), by Distribution Channel 2024 & 2032
- Figure 76: Asia Pacific Biobetter Market Volume (K Unit), by Distribution Channel 2024 & 2032
- Figure 77: Asia Pacific Biobetter Market Revenue Share (%), by Distribution Channel 2024 & 2032
- Figure 78: Asia Pacific Biobetter Market Volume Share (%), by Distribution Channel 2024 & 2032
- Figure 79: Asia Pacific Biobetter Market Revenue (Million), by Country 2024 & 2032
- Figure 80: Asia Pacific Biobetter Market Volume (K Unit), by Country 2024 & 2032
- Figure 81: Asia Pacific Biobetter Market Revenue Share (%), by Country 2024 & 2032
- Figure 82: Asia Pacific Biobetter Market Volume Share (%), by Country 2024 & 2032
- Figure 83: Middle East and Africa Biobetter Market Revenue (Million), by Drug Class 2024 & 2032
- Figure 84: Middle East and Africa Biobetter Market Volume (K Unit), by Drug Class 2024 & 2032
- Figure 85: Middle East and Africa Biobetter Market Revenue Share (%), by Drug Class 2024 & 2032
- Figure 86: Middle East and Africa Biobetter Market Volume Share (%), by Drug Class 2024 & 2032
- Figure 87: Middle East and Africa Biobetter Market Revenue (Million), by Application 2024 & 2032
- Figure 88: Middle East and Africa Biobetter Market Volume (K Unit), by Application 2024 & 2032
- Figure 89: Middle East and Africa Biobetter Market Revenue Share (%), by Application 2024 & 2032
- Figure 90: Middle East and Africa Biobetter Market Volume Share (%), by Application 2024 & 2032
- Figure 91: Middle East and Africa Biobetter Market Revenue (Million), by Route of Administration 2024 & 2032
- Figure 92: Middle East and Africa Biobetter Market Volume (K Unit), by Route of Administration 2024 & 2032
- Figure 93: Middle East and Africa Biobetter Market Revenue Share (%), by Route of Administration 2024 & 2032
- Figure 94: Middle East and Africa Biobetter Market Volume Share (%), by Route of Administration 2024 & 2032
- Figure 95: Middle East and Africa Biobetter Market Revenue (Million), by Distribution Channel 2024 & 2032
- Figure 96: Middle East and Africa Biobetter Market Volume (K Unit), by Distribution Channel 2024 & 2032
- Figure 97: Middle East and Africa Biobetter Market Revenue Share (%), by Distribution Channel 2024 & 2032
- Figure 98: Middle East and Africa Biobetter Market Volume Share (%), by Distribution Channel 2024 & 2032
- Figure 99: Middle East and Africa Biobetter Market Revenue (Million), by Country 2024 & 2032
- Figure 100: Middle East and Africa Biobetter Market Volume (K Unit), by Country 2024 & 2032
- Figure 101: Middle East and Africa Biobetter Market Revenue Share (%), by Country 2024 & 2032
- Figure 102: Middle East and Africa Biobetter Market Volume Share (%), by Country 2024 & 2032
- Figure 103: South America Biobetter Market Revenue (Million), by Drug Class 2024 & 2032
- Figure 104: South America Biobetter Market Volume (K Unit), by Drug Class 2024 & 2032
- Figure 105: South America Biobetter Market Revenue Share (%), by Drug Class 2024 & 2032
- Figure 106: South America Biobetter Market Volume Share (%), by Drug Class 2024 & 2032
- Figure 107: South America Biobetter Market Revenue (Million), by Application 2024 & 2032
- Figure 108: South America Biobetter Market Volume (K Unit), by Application 2024 & 2032
- Figure 109: South America Biobetter Market Revenue Share (%), by Application 2024 & 2032
- Figure 110: South America Biobetter Market Volume Share (%), by Application 2024 & 2032
- Figure 111: South America Biobetter Market Revenue (Million), by Route of Administration 2024 & 2032
- Figure 112: South America Biobetter Market Volume (K Unit), by Route of Administration 2024 & 2032
- Figure 113: South America Biobetter Market Revenue Share (%), by Route of Administration 2024 & 2032
- Figure 114: South America Biobetter Market Volume Share (%), by Route of Administration 2024 & 2032
- Figure 115: South America Biobetter Market Revenue (Million), by Distribution Channel 2024 & 2032
- Figure 116: South America Biobetter Market Volume (K Unit), by Distribution Channel 2024 & 2032
- Figure 117: South America Biobetter Market Revenue Share (%), by Distribution Channel 2024 & 2032
- Figure 118: South America Biobetter Market Volume Share (%), by Distribution Channel 2024 & 2032
- Figure 119: South America Biobetter Market Revenue (Million), by Country 2024 & 2032
- Figure 120: South America Biobetter Market Volume (K Unit), by Country 2024 & 2032
- Figure 121: South America Biobetter Market Revenue Share (%), by Country 2024 & 2032
- Figure 122: South America Biobetter Market Volume Share (%), by Country 2024 & 2032
List of Tables
- Table 1: Global Biobetter Market Revenue Million Forecast, by Region 2019 & 2032
- Table 2: Global Biobetter Market Volume K Unit Forecast, by Region 2019 & 2032
- Table 3: Global Biobetter Market Revenue Million Forecast, by Drug Class 2019 & 2032
- Table 4: Global Biobetter Market Volume K Unit Forecast, by Drug Class 2019 & 2032
- Table 5: Global Biobetter Market Revenue Million Forecast, by Application 2019 & 2032
- Table 6: Global Biobetter Market Volume K Unit Forecast, by Application 2019 & 2032
- Table 7: Global Biobetter Market Revenue Million Forecast, by Route of Administration 2019 & 2032
- Table 8: Global Biobetter Market Volume K Unit Forecast, by Route of Administration 2019 & 2032
- Table 9: Global Biobetter Market Revenue Million Forecast, by Distribution Channel 2019 & 2032
- Table 10: Global Biobetter Market Volume K Unit Forecast, by Distribution Channel 2019 & 2032
- Table 11: Global Biobetter Market Revenue Million Forecast, by Region 2019 & 2032
- Table 12: Global Biobetter Market Volume K Unit Forecast, by Region 2019 & 2032
- Table 13: Global Biobetter Market Revenue Million Forecast, by Country 2019 & 2032
- Table 14: Global Biobetter Market Volume K Unit Forecast, by Country 2019 & 2032
- Table 15: United States Biobetter Market Revenue (Million) Forecast, by Application 2019 & 2032
- Table 16: United States Biobetter Market Volume (K Unit) Forecast, by Application 2019 & 2032
- Table 17: Canada Biobetter Market Revenue (Million) Forecast, by Application 2019 & 2032
- Table 18: Canada Biobetter Market Volume (K Unit) Forecast, by Application 2019 & 2032
- Table 19: Mexico Biobetter Market Revenue (Million) Forecast, by Application 2019 & 2032
- Table 20: Mexico Biobetter Market Volume (K Unit) Forecast, by Application 2019 & 2032
- Table 21: Global Biobetter Market Revenue Million Forecast, by Country 2019 & 2032
- Table 22: Global Biobetter Market Volume K Unit Forecast, by Country 2019 & 2032
- Table 23: Germany Biobetter Market Revenue (Million) Forecast, by Application 2019 & 2032
- Table 24: Germany Biobetter Market Volume (K Unit) Forecast, by Application 2019 & 2032
- Table 25: United Kingdom Biobetter Market Revenue (Million) Forecast, by Application 2019 & 2032
- Table 26: United Kingdom Biobetter Market Volume (K Unit) Forecast, by Application 2019 & 2032
- Table 27: France Biobetter Market Revenue (Million) Forecast, by Application 2019 & 2032
- Table 28: France Biobetter Market Volume (K Unit) Forecast, by Application 2019 & 2032
- Table 29: Italy Biobetter Market Revenue (Million) Forecast, by Application 2019 & 2032
- Table 30: Italy Biobetter Market Volume (K Unit) Forecast, by Application 2019 & 2032
- Table 31: Spain Biobetter Market Revenue (Million) Forecast, by Application 2019 & 2032
- Table 32: Spain Biobetter Market Volume (K Unit) Forecast, by Application 2019 & 2032
- Table 33: Rest of Europe Biobetter Market Revenue (Million) Forecast, by Application 2019 & 2032
- Table 34: Rest of Europe Biobetter Market Volume (K Unit) Forecast, by Application 2019 & 2032
- Table 35: Global Biobetter Market Revenue Million Forecast, by Country 2019 & 2032
- Table 36: Global Biobetter Market Volume K Unit Forecast, by Country 2019 & 2032
- Table 37: China Biobetter Market Revenue (Million) Forecast, by Application 2019 & 2032
- Table 38: China Biobetter Market Volume (K Unit) Forecast, by Application 2019 & 2032
- Table 39: Japan Biobetter Market Revenue (Million) Forecast, by Application 2019 & 2032
- Table 40: Japan Biobetter Market Volume (K Unit) Forecast, by Application 2019 & 2032
- Table 41: India Biobetter Market Revenue (Million) Forecast, by Application 2019 & 2032
- Table 42: India Biobetter Market Volume (K Unit) Forecast, by Application 2019 & 2032
- Table 43: Australia Biobetter Market Revenue (Million) Forecast, by Application 2019 & 2032
- Table 44: Australia Biobetter Market Volume (K Unit) Forecast, by Application 2019 & 2032
- Table 45: South Korea Biobetter Market Revenue (Million) Forecast, by Application 2019 & 2032
- Table 46: South Korea Biobetter Market Volume (K Unit) Forecast, by Application 2019 & 2032
- Table 47: Rest of Asia Pacific Biobetter Market Revenue (Million) Forecast, by Application 2019 & 2032
- Table 48: Rest of Asia Pacific Biobetter Market Volume (K Unit) Forecast, by Application 2019 & 2032
- Table 49: Global Biobetter Market Revenue Million Forecast, by Country 2019 & 2032
- Table 50: Global Biobetter Market Volume K Unit Forecast, by Country 2019 & 2032
- Table 51: GCC Biobetter Market Revenue (Million) Forecast, by Application 2019 & 2032
- Table 52: GCC Biobetter Market Volume (K Unit) Forecast, by Application 2019 & 2032
- Table 53: South Africa Biobetter Market Revenue (Million) Forecast, by Application 2019 & 2032
- Table 54: South Africa Biobetter Market Volume (K Unit) Forecast, by Application 2019 & 2032
- Table 55: Rest of Middle East and Africa Biobetter Market Revenue (Million) Forecast, by Application 2019 & 2032
- Table 56: Rest of Middle East and Africa Biobetter Market Volume (K Unit) Forecast, by Application 2019 & 2032
- Table 57: Global Biobetter Market Revenue Million Forecast, by Country 2019 & 2032
- Table 58: Global Biobetter Market Volume K Unit Forecast, by Country 2019 & 2032
- Table 59: Brazil Biobetter Market Revenue (Million) Forecast, by Application 2019 & 2032
- Table 60: Brazil Biobetter Market Volume (K Unit) Forecast, by Application 2019 & 2032
- Table 61: Argentina Biobetter Market Revenue (Million) Forecast, by Application 2019 & 2032
- Table 62: Argentina Biobetter Market Volume (K Unit) Forecast, by Application 2019 & 2032
- Table 63: Rest of South America Biobetter Market Revenue (Million) Forecast, by Application 2019 & 2032
- Table 64: Rest of South America Biobetter Market Volume (K Unit) Forecast, by Application 2019 & 2032
- Table 65: Global Biobetter Market Revenue Million Forecast, by Drug Class 2019 & 2032
- Table 66: Global Biobetter Market Volume K Unit Forecast, by Drug Class 2019 & 2032
- Table 67: Global Biobetter Market Revenue Million Forecast, by Application 2019 & 2032
- Table 68: Global Biobetter Market Volume K Unit Forecast, by Application 2019 & 2032
- Table 69: Global Biobetter Market Revenue Million Forecast, by Route of Administration 2019 & 2032
- Table 70: Global Biobetter Market Volume K Unit Forecast, by Route of Administration 2019 & 2032
- Table 71: Global Biobetter Market Revenue Million Forecast, by Distribution Channel 2019 & 2032
- Table 72: Global Biobetter Market Volume K Unit Forecast, by Distribution Channel 2019 & 2032
- Table 73: Global Biobetter Market Revenue Million Forecast, by Country 2019 & 2032
- Table 74: Global Biobetter Market Volume K Unit Forecast, by Country 2019 & 2032
- Table 75: United States Biobetter Market Revenue (Million) Forecast, by Application 2019 & 2032
- Table 76: United States Biobetter Market Volume (K Unit) Forecast, by Application 2019 & 2032
- Table 77: Canada Biobetter Market Revenue (Million) Forecast, by Application 2019 & 2032
- Table 78: Canada Biobetter Market Volume (K Unit) Forecast, by Application 2019 & 2032
- Table 79: Mexico Biobetter Market Revenue (Million) Forecast, by Application 2019 & 2032
- Table 80: Mexico Biobetter Market Volume (K Unit) Forecast, by Application 2019 & 2032
- Table 81: Global Biobetter Market Revenue Million Forecast, by Drug Class 2019 & 2032
- Table 82: Global Biobetter Market Volume K Unit Forecast, by Drug Class 2019 & 2032
- Table 83: Global Biobetter Market Revenue Million Forecast, by Application 2019 & 2032
- Table 84: Global Biobetter Market Volume K Unit Forecast, by Application 2019 & 2032
- Table 85: Global Biobetter Market Revenue Million Forecast, by Route of Administration 2019 & 2032
- Table 86: Global Biobetter Market Volume K Unit Forecast, by Route of Administration 2019 & 2032
- Table 87: Global Biobetter Market Revenue Million Forecast, by Distribution Channel 2019 & 2032
- Table 88: Global Biobetter Market Volume K Unit Forecast, by Distribution Channel 2019 & 2032
- Table 89: Global Biobetter Market Revenue Million Forecast, by Country 2019 & 2032
- Table 90: Global Biobetter Market Volume K Unit Forecast, by Country 2019 & 2032
- Table 91: Germany Biobetter Market Revenue (Million) Forecast, by Application 2019 & 2032
- Table 92: Germany Biobetter Market Volume (K Unit) Forecast, by Application 2019 & 2032
- Table 93: United Kingdom Biobetter Market Revenue (Million) Forecast, by Application 2019 & 2032
- Table 94: United Kingdom Biobetter Market Volume (K Unit) Forecast, by Application 2019 & 2032
- Table 95: France Biobetter Market Revenue (Million) Forecast, by Application 2019 & 2032
- Table 96: France Biobetter Market Volume (K Unit) Forecast, by Application 2019 & 2032
- Table 97: Italy Biobetter Market Revenue (Million) Forecast, by Application 2019 & 2032
- Table 98: Italy Biobetter Market Volume (K Unit) Forecast, by Application 2019 & 2032
- Table 99: Spain Biobetter Market Revenue (Million) Forecast, by Application 2019 & 2032
- Table 100: Spain Biobetter Market Volume (K Unit) Forecast, by Application 2019 & 2032
- Table 101: Rest of Europe Biobetter Market Revenue (Million) Forecast, by Application 2019 & 2032
- Table 102: Rest of Europe Biobetter Market Volume (K Unit) Forecast, by Application 2019 & 2032
- Table 103: Global Biobetter Market Revenue Million Forecast, by Drug Class 2019 & 2032
- Table 104: Global Biobetter Market Volume K Unit Forecast, by Drug Class 2019 & 2032
- Table 105: Global Biobetter Market Revenue Million Forecast, by Application 2019 & 2032
- Table 106: Global Biobetter Market Volume K Unit Forecast, by Application 2019 & 2032
- Table 107: Global Biobetter Market Revenue Million Forecast, by Route of Administration 2019 & 2032
- Table 108: Global Biobetter Market Volume K Unit Forecast, by Route of Administration 2019 & 2032
- Table 109: Global Biobetter Market Revenue Million Forecast, by Distribution Channel 2019 & 2032
- Table 110: Global Biobetter Market Volume K Unit Forecast, by Distribution Channel 2019 & 2032
- Table 111: Global Biobetter Market Revenue Million Forecast, by Country 2019 & 2032
- Table 112: Global Biobetter Market Volume K Unit Forecast, by Country 2019 & 2032
- Table 113: China Biobetter Market Revenue (Million) Forecast, by Application 2019 & 2032
- Table 114: China Biobetter Market Volume (K Unit) Forecast, by Application 2019 & 2032
- Table 115: Japan Biobetter Market Revenue (Million) Forecast, by Application 2019 & 2032
- Table 116: Japan Biobetter Market Volume (K Unit) Forecast, by Application 2019 & 2032
- Table 117: India Biobetter Market Revenue (Million) Forecast, by Application 2019 & 2032
- Table 118: India Biobetter Market Volume (K Unit) Forecast, by Application 2019 & 2032
- Table 119: Australia Biobetter Market Revenue (Million) Forecast, by Application 2019 & 2032
- Table 120: Australia Biobetter Market Volume (K Unit) Forecast, by Application 2019 & 2032
- Table 121: South Korea Biobetter Market Revenue (Million) Forecast, by Application 2019 & 2032
- Table 122: South Korea Biobetter Market Volume (K Unit) Forecast, by Application 2019 & 2032
- Table 123: Rest of Asia Pacific Biobetter Market Revenue (Million) Forecast, by Application 2019 & 2032
- Table 124: Rest of Asia Pacific Biobetter Market Volume (K Unit) Forecast, by Application 2019 & 2032
- Table 125: Global Biobetter Market Revenue Million Forecast, by Drug Class 2019 & 2032
- Table 126: Global Biobetter Market Volume K Unit Forecast, by Drug Class 2019 & 2032
- Table 127: Global Biobetter Market Revenue Million Forecast, by Application 2019 & 2032
- Table 128: Global Biobetter Market Volume K Unit Forecast, by Application 2019 & 2032
- Table 129: Global Biobetter Market Revenue Million Forecast, by Route of Administration 2019 & 2032
- Table 130: Global Biobetter Market Volume K Unit Forecast, by Route of Administration 2019 & 2032
- Table 131: Global Biobetter Market Revenue Million Forecast, by Distribution Channel 2019 & 2032
- Table 132: Global Biobetter Market Volume K Unit Forecast, by Distribution Channel 2019 & 2032
- Table 133: Global Biobetter Market Revenue Million Forecast, by Country 2019 & 2032
- Table 134: Global Biobetter Market Volume K Unit Forecast, by Country 2019 & 2032
- Table 135: GCC Biobetter Market Revenue (Million) Forecast, by Application 2019 & 2032
- Table 136: GCC Biobetter Market Volume (K Unit) Forecast, by Application 2019 & 2032
- Table 137: South Africa Biobetter Market Revenue (Million) Forecast, by Application 2019 & 2032
- Table 138: South Africa Biobetter Market Volume (K Unit) Forecast, by Application 2019 & 2032
- Table 139: Rest of Middle East and Africa Biobetter Market Revenue (Million) Forecast, by Application 2019 & 2032
- Table 140: Rest of Middle East and Africa Biobetter Market Volume (K Unit) Forecast, by Application 2019 & 2032
- Table 141: Global Biobetter Market Revenue Million Forecast, by Drug Class 2019 & 2032
- Table 142: Global Biobetter Market Volume K Unit Forecast, by Drug Class 2019 & 2032
- Table 143: Global Biobetter Market Revenue Million Forecast, by Application 2019 & 2032
- Table 144: Global Biobetter Market Volume K Unit Forecast, by Application 2019 & 2032
- Table 145: Global Biobetter Market Revenue Million Forecast, by Route of Administration 2019 & 2032
- Table 146: Global Biobetter Market Volume K Unit Forecast, by Route of Administration 2019 & 2032
- Table 147: Global Biobetter Market Revenue Million Forecast, by Distribution Channel 2019 & 2032
- Table 148: Global Biobetter Market Volume K Unit Forecast, by Distribution Channel 2019 & 2032
- Table 149: Global Biobetter Market Revenue Million Forecast, by Country 2019 & 2032
- Table 150: Global Biobetter Market Volume K Unit Forecast, by Country 2019 & 2032
- Table 151: Brazil Biobetter Market Revenue (Million) Forecast, by Application 2019 & 2032
- Table 152: Brazil Biobetter Market Volume (K Unit) Forecast, by Application 2019 & 2032
- Table 153: Argentina Biobetter Market Revenue (Million) Forecast, by Application 2019 & 2032
- Table 154: Argentina Biobetter Market Volume (K Unit) Forecast, by Application 2019 & 2032
- Table 155: Rest of South America Biobetter Market Revenue (Million) Forecast, by Application 2019 & 2032
- Table 156: Rest of South America Biobetter Market Volume (K Unit) Forecast, by Application 2019 & 2032
Frequently Asked Questions
1. What is the projected Compound Annual Growth Rate (CAGR) of the Biobetter Market?
The projected CAGR is approximately 7.80%.
2. Which companies are prominent players in the Biobetter Market?
Key companies in the market include Sanofi, Amgen Inc, Merck & Co Inc, Eli Lilly and Company, F Hoffmann-La Roche AG, Novo Nordisk A/S, Pfizer Inc, Biogen Inc, CSL Behring, Genentech USA Inc.
3. What are the main segments of the Biobetter Market?
The market segments include Drug Class, Application, Route of Administration, Distribution Channel.
4. Can you provide details about the market size?
The market size is estimated to be USD XX Million as of 2022.
5. What are some drivers contributing to market growth?
Superior Therapeutic Efficacy and Lower Adverse Effects; Comparatively Easier and Less Costly Manufacturing Processes; Non- Patent and Market Exclusivity; Longer product Half-life and Less Dosing Frequency; High Investment Opportunities.
6. What are the notable trends driving market growth?
Cancer Segment is Expected to Hold a Significant Market Share Over the Forecast Period.
7. Are there any restraints impacting market growth?
High Investment in Research and Development; Increasing Biosimilar Competition.
8. Can you provide examples of recent developments in the market?
In January 2023, Celltrion Healthcare announced the submission of a biologics license application (BLA) for Remsima SC, a biobetter of the company's infliximab biosimilar (Remsima) that allows for subcutaneous administration.
9. What pricing options are available for accessing the report?
Pricing options include single-user, multi-user, and enterprise licenses priced at USD 4750, USD 5250, and USD 8750 respectively.
10. Is the market size provided in terms of value or volume?
The market size is provided in terms of value, measured in Million and volume, measured in K Unit.
11. Are there any specific market keywords associated with the report?
Yes, the market keyword associated with the report is "Biobetter Market," which aids in identifying and referencing the specific market segment covered.
12. How do I determine which pricing option suits my needs best?
The pricing options vary based on user requirements and access needs. Individual users may opt for single-user licenses, while businesses requiring broader access may choose multi-user or enterprise licenses for cost-effective access to the report.
13. Are there any additional resources or data provided in the Biobetter Market report?
While the report offers comprehensive insights, it's advisable to review the specific contents or supplementary materials provided to ascertain if additional resources or data are available.
14. How can I stay updated on further developments or reports in the Biobetter Market?
To stay informed about further developments, trends, and reports in the Biobetter Market, consider subscribing to industry newsletters, following relevant companies and organizations, or regularly checking reputable industry news sources and publications.
Methodology
Step 1 - Identification of Relevant Samples Size from Population Database


Step 2 - Approaches for Defining Global Market Size (Value, Volume* & Price*)

Note*: In applicable scenarios
Step 3 - Data Sources
Primary Research
- Web Analytics
- Survey Reports
- Research Institute
- Latest Research Reports
- Opinion Leaders
Secondary Research
- Annual Reports
- White Paper
- Latest Press Release
- Industry Association
- Paid Database
- Investor Presentations

Step 4 - Data Triangulation
Involves using different sources of information in order to increase the validity of a study
These sources are likely to be stakeholders in a program - participants, other researchers, program staff, other community members, and so on.
Then we put all data in single framework & apply various statistical tools to find out the dynamic on the market.
During the analysis stage, feedback from the stakeholder groups would be compared to determine areas of agreement as well as areas of divergence


