
Key Insights
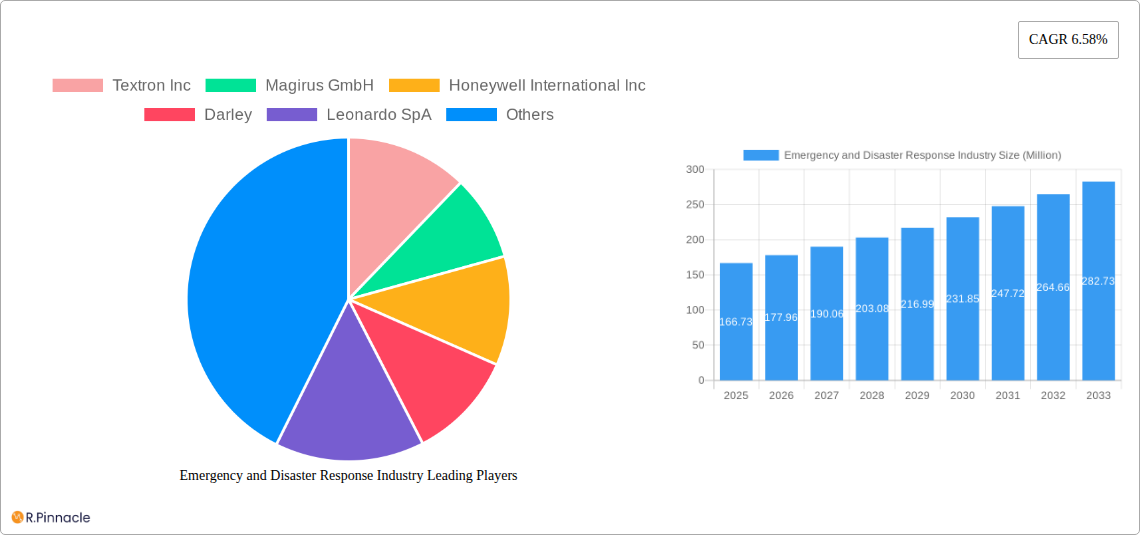
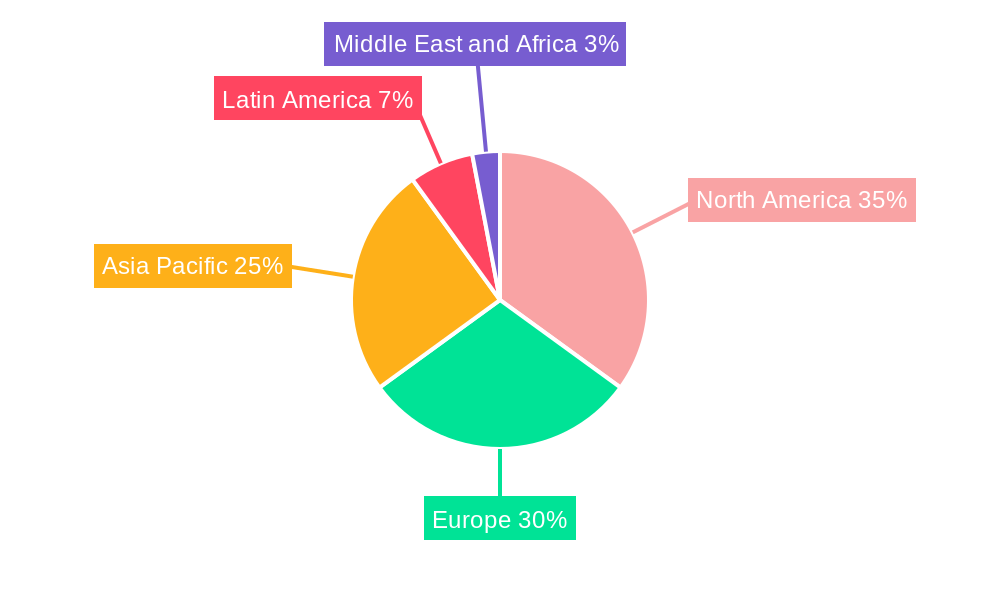
The global emergency and disaster response market, valued at $166.73 million in 2025, is projected to experience robust growth, driven by several key factors. Increasing frequency and severity of natural disasters, coupled with rising urbanization and population density, necessitate advanced preparedness and response capabilities. Technological advancements, such as improved threat detection equipment, sophisticated communication systems, and data analytics for predictive modeling, are significantly contributing to market expansion. Furthermore, stringent government regulations and increasing investments in disaster preparedness initiatives across nations are further fueling market growth. The market is segmented by equipment (threat detection, personal protection, medical, temporary shelter, mountaineering, firefighting, and others) and vehicle platforms (land, marine, and airborne), offering diverse opportunities for specialized solutions. North America and Europe currently hold significant market share due to established infrastructure and high awareness, but the Asia-Pacific region is expected to witness substantial growth in the coming years, driven by rapid economic development and increased vulnerability to natural disasters in densely populated areas.
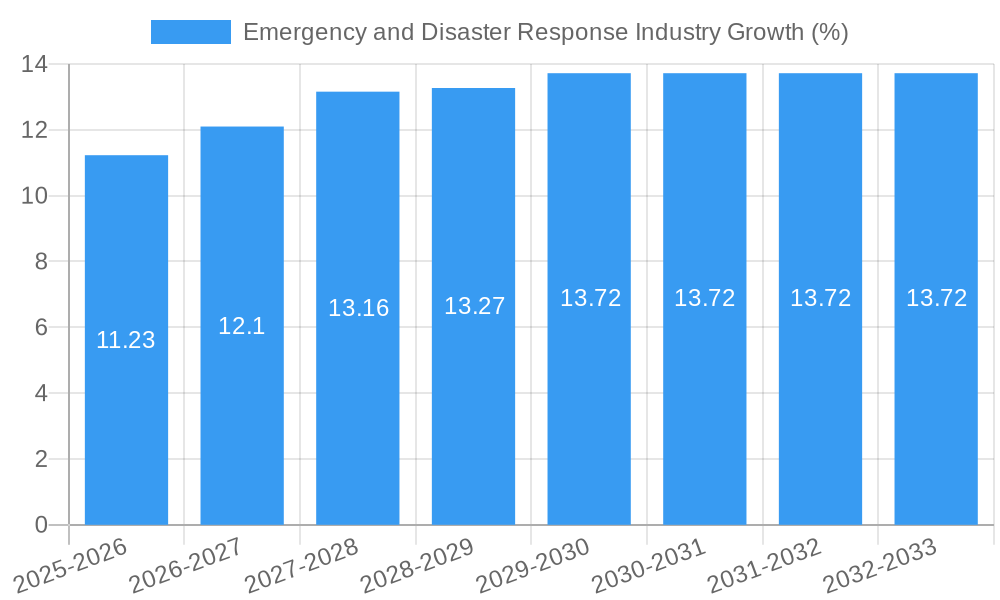
While the market presents significant opportunities, challenges remain. High initial investment costs associated with advanced equipment and training can be a barrier to entry for smaller players. The market's success also relies on effective collaboration between government agencies, private sector companies, and non-governmental organizations (NGOs). Furthermore, ensuring the long-term sustainability of disaster response infrastructure and the development of resilient communities are critical for overall market growth and impact. The forecast period (2025-2033) anticipates continued expansion, with the CAGR of 6.58% indicating a steady and promising trajectory for the industry, further emphasizing the importance of preparedness and innovation in this vital sector.
Emergency and Disaster Response Industry Market Report: 2019-2033
This comprehensive report provides a detailed analysis of the global Emergency and Disaster Response Industry, projecting a market value exceeding $XX Million by 2033. The study covers the period 2019-2033, with a base year of 2025 and a forecast period of 2025-2033. It offers actionable insights for industry professionals, investors, and stakeholders, focusing on market trends, key players, and future growth opportunities. This in-depth analysis examines market segmentation by equipment and vehicle platforms, revealing dominant regions and highlighting key innovation trends.
Emergency and Disaster Response Industry Market Structure & Innovation Trends
The Emergency and Disaster Response market is moderately fragmented, with key players like Textron Inc, Magirus GmbH, Honeywell International Inc, Darley, Leonardo SpA, Smiths Group PLC, Viking Air Ltd, Emergency Medical International, Ziegler GmbH, 3M, Juvare LLC, Emergency One Group, Everbridge Inc, Hexagon AB, Esri Inc, Rosenbauer International AG, and REV Group Inc competing for market share. The market exhibits a dynamic landscape with ongoing mergers and acquisitions (M&A) activity, with total M&A deal values exceeding $XX Million in the historical period (2019-2024).
- Market Concentration: The Herfindahl-Hirschman Index (HHI) is estimated at xx, indicating a moderately concentrated market.
- Innovation Drivers: Technological advancements in threat detection, personal protective equipment, and communication systems are significant drivers. Government regulations and increasing disaster preparedness initiatives also contribute to innovation.
- Regulatory Frameworks: Stringent safety and performance standards influence product development and market entry.
- Product Substitutes: Limited substitutes exist, but cost-effective solutions and alternative technologies are emerging.
- End-User Demographics: The primary end-users are government agencies, emergency response teams, and private organizations.
- M&A Activity: Consolidation is a prominent trend, with major players acquiring smaller companies to expand their product portfolios and geographic reach.
Emergency and Disaster Response Industry Market Dynamics & Trends
The Emergency and Disaster Response market is experiencing robust growth, with a Compound Annual Growth Rate (CAGR) of xx% projected during the forecast period (2025-2033). Several factors fuel this growth: increasing frequency and intensity of natural disasters, rising government spending on emergency preparedness, technological advancements leading to enhanced response capabilities, and growing awareness of disaster risk management. Market penetration for advanced technologies such as AI-powered threat detection systems is increasing steadily. However, economic downturns and fluctuating government budgets pose potential challenges. Competitive dynamics are shaped by technological innovation, product differentiation, and strategic partnerships.
Dominant Regions & Segments in Emergency and Disaster Response Industry
North America currently holds the largest market share, driven by robust government funding, advanced technological infrastructure, and a high level of disaster preparedness. Within equipment segments, Fire Fighting Equipment and Medical Equipment are currently leading, while the Land segment dominates the Vehicle Platform market.
Key Drivers for North America:
- High government spending on emergency response infrastructure.
- Advanced technological infrastructure facilitating rapid adoption of new technologies.
- Stringent safety regulations driving innovation.
- High level of public awareness and preparedness for disaster response.
Dominance Analysis: The dominance of North America is expected to continue throughout the forecast period, although other regions like Asia-Pacific are predicted to witness significant growth due to increasing urbanization and vulnerability to natural disasters.
Segment Analysis:
- Equipment: Fire Fighting Equipment's large market share is due to consistent demand and technological advancements. Medical Equipment shows strong growth due to increased focus on pre-hospital care and advanced medical technologies.
- Vehicle Platform: The Land segment's dominance stems from its versatility and wide range of applications, although the Airborne segment is experiencing significant growth due to increasing demand for rapid aerial response.
Emergency and Disaster Response Industry Product Innovations
Recent innovations include the development of lightweight and highly durable personal protective gear, AI-powered threat detection systems offering real-time threat analysis, and advanced medical equipment enabling on-site treatment and triage. These innovations enhance response effectiveness and improve overall safety for first responders. The market is characterized by a focus on improving equipment portability, increasing functionality through integration of various technologies (IoT, AI, Big Data), and improving user experience.
Report Scope & Segmentation Analysis
This report segments the Emergency and Disaster Response market by equipment type (Threat Detection Equipment, Personal Protection Gear, Medical Equipment, Temporary Shelter Equipment, Mountaineering Equipment, Fire Fighting Equipment, Other Equipment) and vehicle platform (Land, Marine, Airborne). Each segment’s growth projection and competitive dynamics are analyzed, detailing market size and projected growth rates for each category. The market size for each segment is projected to reach several million dollars. For instance, the Fire Fighting Equipment segment is estimated to be worth $XX Million in 2025, with projections of $XX Million by 2033.
Key Drivers of Emergency and Disaster Response Industry Growth
Several factors drive market growth: increasing frequency and severity of natural disasters, rising government investments in disaster preparedness, technological advancements improving response efficiency, and growing awareness of the importance of effective disaster management. Economic growth in developing nations also boosts demand for better emergency response capabilities. Government regulations mandate better safety and performance standards, driving innovation.
Challenges in the Emergency and Disaster Response Industry Sector
Challenges include supply chain disruptions affecting the availability of critical components, regulatory hurdles impacting product approvals and market entry, and intense competition among established players and new entrants. Fluctuations in government funding due to economic downturns can limit the market's growth potential. Furthermore, achieving interoperability between different systems and technologies is crucial yet challenging.
Emerging Opportunities in Emergency and Disaster Response Industry
Emerging opportunities include integrating AI and machine learning for predictive analytics and improved response planning, the development of drone-based delivery systems for remote areas, and expansion into new markets in developing countries with rising vulnerabilities to natural disasters. Advancements in materials science offer chances to create lighter, stronger, and more durable equipment.
Leading Players in the Emergency and Disaster Response Industry Market
- Textron Inc
- Magirus GmbH
- Honeywell International Inc
- Darley
- Leonardo SpA
- Smiths Group PLC
- Viking Air Ltd
- Emergency Medical International
- Ziegler GmbH
- 3M
- Juvare LLC
- Emergency One Group
- Everbridge Inc
- Hexagon AB
- Esri Inc
- Rosenbauer International AG
- REV Group Inc
Key Developments in Emergency and Disaster Response Industry Industry
- 2022-Q4: Rosenbauer International AG launched a new generation of electric fire trucks.
- 2023-Q1: Honeywell International Inc. announced a partnership with a major emergency response organization to deploy advanced threat detection systems.
- 2023-Q2: Textron Inc. acquired a smaller company specializing in temporary shelter solutions. (Further developments can be added here)
Future Outlook for Emergency and Disaster Response Industry Market
The Emergency and Disaster Response market is poised for continued growth, driven by technological innovation, increased government spending, and evolving disaster preparedness strategies. Opportunities lie in developing integrated and interconnected systems, leveraging AI and big data for predictive analytics, and focusing on sustainable and cost-effective solutions. The market is expected to see a significant expansion in the coming years, providing lucrative opportunities for industry players.
Emergency and Disaster Response Industry Segmentation
-
1. Equipment
- 1.1. Threat Detection Equipment
- 1.2. Personal Protection Gear
- 1.3. Medical Equipment
- 1.4. Temporary Shelter Equipment
- 1.5. Mountaineering Equipment
- 1.6. Fire Fighting Equipment
- 1.7. Other Equipment
-
2. Vehicle Platform
- 2.1. Land
- 2.2. Marine
- 2.3. Airborne
Emergency and Disaster Response Industry Segmentation By Geography
-
1. North America
- 1.1. United States
- 1.2. Canada
-
2. Europe
- 2.1. United Kingdom
- 2.2. Germany
- 2.3. France
- 2.4. Italy
- 2.5. Russia
- 2.6. Rest of Europe
-
3. Asia Pacific
- 3.1. China
- 3.2. India
- 3.3. Japan
- 3.4. South Korea
- 3.5. Australia
- 3.6. Rest of Asia Pacific
-
4. Latin America
- 4.1. Brazil
- 4.2. Mexico
- 4.3. Rest of Latin America
-
5. Middle East and Africa
- 5.1. United Arab Emirates
- 5.2. Saudi Arabia
- 5.3. Egypt
- 5.4. South Africa
- 5.5. Rest of Middle East and Africa
Emergency and Disaster Response Industry REPORT HIGHLIGHTS
| Aspects | Details |
|---|---|
| Study Period | 2019-2033 |
| Base Year | 2024 |
| Estimated Year | 2025 |
| Forecast Period | 2025-2033 |
| Historical Period | 2019-2024 |
| Growth Rate | CAGR of 6.58% from 2019-2033 |
| Segmentation |
|
Table of Contents
- 1. Introduction
- 1.1. Research Scope
- 1.2. Market Segmentation
- 1.3. Research Methodology
- 1.4. Definitions and Assumptions
- 2. Executive Summary
- 2.1. Introduction
- 3. Market Dynamics
- 3.1. Introduction
- 3.2. Market Drivers
- 3.2.1. ; Increasing Number Of Air Passengers; Use Of Portable Electronic Devices
- 3.3. Market Restrains
- 3.3.1. ; High Cost Of Connectivity Equipments
- 3.4. Market Trends
- 3.4.1. Land Segment to Register the Highest CAGR during the Forecast Period
- 4. Market Factor Analysis
- 4.1. Porters Five Forces
- 4.2. Supply/Value Chain
- 4.3. PESTEL analysis
- 4.4. Market Entropy
- 4.5. Patent/Trademark Analysis
- 5. Global Emergency and Disaster Response Industry Analysis, Insights and Forecast, 2019-2031
- 5.1. Market Analysis, Insights and Forecast - by Equipment
- 5.1.1. Threat Detection Equipment
- 5.1.2. Personal Protection Gear
- 5.1.3. Medical Equipment
- 5.1.4. Temporary Shelter Equipment
- 5.1.5. Mountaineering Equipment
- 5.1.6. Fire Fighting Equipment
- 5.1.7. Other Equipment
- 5.2. Market Analysis, Insights and Forecast - by Vehicle Platform
- 5.2.1. Land
- 5.2.2. Marine
- 5.2.3. Airborne
- 5.3. Market Analysis, Insights and Forecast - by Region
- 5.3.1. North America
- 5.3.2. Europe
- 5.3.3. Asia Pacific
- 5.3.4. Latin America
- 5.3.5. Middle East and Africa
- 5.1. Market Analysis, Insights and Forecast - by Equipment
- 6. North America Emergency and Disaster Response Industry Analysis, Insights and Forecast, 2019-2031
- 6.1. Market Analysis, Insights and Forecast - by Equipment
- 6.1.1. Threat Detection Equipment
- 6.1.2. Personal Protection Gear
- 6.1.3. Medical Equipment
- 6.1.4. Temporary Shelter Equipment
- 6.1.5. Mountaineering Equipment
- 6.1.6. Fire Fighting Equipment
- 6.1.7. Other Equipment
- 6.2. Market Analysis, Insights and Forecast - by Vehicle Platform
- 6.2.1. Land
- 6.2.2. Marine
- 6.2.3. Airborne
- 6.1. Market Analysis, Insights and Forecast - by Equipment
- 7. Europe Emergency and Disaster Response Industry Analysis, Insights and Forecast, 2019-2031
- 7.1. Market Analysis, Insights and Forecast - by Equipment
- 7.1.1. Threat Detection Equipment
- 7.1.2. Personal Protection Gear
- 7.1.3. Medical Equipment
- 7.1.4. Temporary Shelter Equipment
- 7.1.5. Mountaineering Equipment
- 7.1.6. Fire Fighting Equipment
- 7.1.7. Other Equipment
- 7.2. Market Analysis, Insights and Forecast - by Vehicle Platform
- 7.2.1. Land
- 7.2.2. Marine
- 7.2.3. Airborne
- 7.1. Market Analysis, Insights and Forecast - by Equipment
- 8. Asia Pacific Emergency and Disaster Response Industry Analysis, Insights and Forecast, 2019-2031
- 8.1. Market Analysis, Insights and Forecast - by Equipment
- 8.1.1. Threat Detection Equipment
- 8.1.2. Personal Protection Gear
- 8.1.3. Medical Equipment
- 8.1.4. Temporary Shelter Equipment
- 8.1.5. Mountaineering Equipment
- 8.1.6. Fire Fighting Equipment
- 8.1.7. Other Equipment
- 8.2. Market Analysis, Insights and Forecast - by Vehicle Platform
- 8.2.1. Land
- 8.2.2. Marine
- 8.2.3. Airborne
- 8.1. Market Analysis, Insights and Forecast - by Equipment
- 9. Latin America Emergency and Disaster Response Industry Analysis, Insights and Forecast, 2019-2031
- 9.1. Market Analysis, Insights and Forecast - by Equipment
- 9.1.1. Threat Detection Equipment
- 9.1.2. Personal Protection Gear
- 9.1.3. Medical Equipment
- 9.1.4. Temporary Shelter Equipment
- 9.1.5. Mountaineering Equipment
- 9.1.6. Fire Fighting Equipment
- 9.1.7. Other Equipment
- 9.2. Market Analysis, Insights and Forecast - by Vehicle Platform
- 9.2.1. Land
- 9.2.2. Marine
- 9.2.3. Airborne
- 9.1. Market Analysis, Insights and Forecast - by Equipment
- 10. Middle East and Africa Emergency and Disaster Response Industry Analysis, Insights and Forecast, 2019-2031
- 10.1. Market Analysis, Insights and Forecast - by Equipment
- 10.1.1. Threat Detection Equipment
- 10.1.2. Personal Protection Gear
- 10.1.3. Medical Equipment
- 10.1.4. Temporary Shelter Equipment
- 10.1.5. Mountaineering Equipment
- 10.1.6. Fire Fighting Equipment
- 10.1.7. Other Equipment
- 10.2. Market Analysis, Insights and Forecast - by Vehicle Platform
- 10.2.1. Land
- 10.2.2. Marine
- 10.2.3. Airborne
- 10.1. Market Analysis, Insights and Forecast - by Equipment
- 11. North America Emergency and Disaster Response Industry Analysis, Insights and Forecast, 2019-2031
- 11.1. Market Analysis, Insights and Forecast - By Country/Sub-region
- 11.1.1 United States
- 11.1.2 Canada
- 12. Europe Emergency and Disaster Response Industry Analysis, Insights and Forecast, 2019-2031
- 12.1. Market Analysis, Insights and Forecast - By Country/Sub-region
- 12.1.1 United Kingdom
- 12.1.2 Germany
- 12.1.3 France
- 12.1.4 Italy
- 12.1.5 Russia
- 12.1.6 Rest of Europe
- 13. Asia Pacific Emergency and Disaster Response Industry Analysis, Insights and Forecast, 2019-2031
- 13.1. Market Analysis, Insights and Forecast - By Country/Sub-region
- 13.1.1 China
- 13.1.2 India
- 13.1.3 Japan
- 13.1.4 South Korea
- 13.1.5 Australia
- 13.1.6 Rest of Asia Pacific
- 14. Latin America Emergency and Disaster Response Industry Analysis, Insights and Forecast, 2019-2031
- 14.1. Market Analysis, Insights and Forecast - By Country/Sub-region
- 14.1.1 Brazil
- 14.1.2 Mexico
- 14.1.3 Rest of Latin America
- 15. Middle East and Africa Emergency and Disaster Response Industry Analysis, Insights and Forecast, 2019-2031
- 15.1. Market Analysis, Insights and Forecast - By Country/Sub-region
- 15.1.1 United Arab Emirates
- 15.1.2 Saudi Arabia
- 15.1.3 Egypt
- 15.1.4 South Africa
- 15.1.5 Rest of Middle East and Africa
- 16. Competitive Analysis
- 16.1. Global Market Share Analysis 2024
- 16.2. Company Profiles
- 16.2.1 Textron Inc
- 16.2.1.1. Overview
- 16.2.1.2. Products
- 16.2.1.3. SWOT Analysis
- 16.2.1.4. Recent Developments
- 16.2.1.5. Financials (Based on Availability)
- 16.2.2 Magirus GmbH
- 16.2.2.1. Overview
- 16.2.2.2. Products
- 16.2.2.3. SWOT Analysis
- 16.2.2.4. Recent Developments
- 16.2.2.5. Financials (Based on Availability)
- 16.2.3 Honeywell International Inc
- 16.2.3.1. Overview
- 16.2.3.2. Products
- 16.2.3.3. SWOT Analysis
- 16.2.3.4. Recent Developments
- 16.2.3.5. Financials (Based on Availability)
- 16.2.4 Darley
- 16.2.4.1. Overview
- 16.2.4.2. Products
- 16.2.4.3. SWOT Analysis
- 16.2.4.4. Recent Developments
- 16.2.4.5. Financials (Based on Availability)
- 16.2.5 Leonardo SpA
- 16.2.5.1. Overview
- 16.2.5.2. Products
- 16.2.5.3. SWOT Analysis
- 16.2.5.4. Recent Developments
- 16.2.5.5. Financials (Based on Availability)
- 16.2.6 Smiths Group PLC
- 16.2.6.1. Overview
- 16.2.6.2. Products
- 16.2.6.3. SWOT Analysis
- 16.2.6.4. Recent Developments
- 16.2.6.5. Financials (Based on Availability)
- 16.2.7 Viking Air Ltd
- 16.2.7.1. Overview
- 16.2.7.2. Products
- 16.2.7.3. SWOT Analysis
- 16.2.7.4. Recent Developments
- 16.2.7.5. Financials (Based on Availability)
- 16.2.8 Emergency Medical International
- 16.2.8.1. Overview
- 16.2.8.2. Products
- 16.2.8.3. SWOT Analysis
- 16.2.8.4. Recent Developments
- 16.2.8.5. Financials (Based on Availability)
- 16.2.9 Ziegler GmbH
- 16.2.9.1. Overview
- 16.2.9.2. Products
- 16.2.9.3. SWOT Analysis
- 16.2.9.4. Recent Developments
- 16.2.9.5. Financials (Based on Availability)
- 16.2.10 3M
- 16.2.10.1. Overview
- 16.2.10.2. Products
- 16.2.10.3. SWOT Analysis
- 16.2.10.4. Recent Developments
- 16.2.10.5. Financials (Based on Availability)
- 16.2.11 Juvare LLC
- 16.2.11.1. Overview
- 16.2.11.2. Products
- 16.2.11.3. SWOT Analysis
- 16.2.11.4. Recent Developments
- 16.2.11.5. Financials (Based on Availability)
- 16.2.12 Emergency One Group
- 16.2.12.1. Overview
- 16.2.12.2. Products
- 16.2.12.3. SWOT Analysis
- 16.2.12.4. Recent Developments
- 16.2.12.5. Financials (Based on Availability)
- 16.2.13 Everbridge Inc
- 16.2.13.1. Overview
- 16.2.13.2. Products
- 16.2.13.3. SWOT Analysis
- 16.2.13.4. Recent Developments
- 16.2.13.5. Financials (Based on Availability)
- 16.2.14 Hexagon A
- 16.2.14.1. Overview
- 16.2.14.2. Products
- 16.2.14.3. SWOT Analysis
- 16.2.14.4. Recent Developments
- 16.2.14.5. Financials (Based on Availability)
- 16.2.15 Esri Inc
- 16.2.15.1. Overview
- 16.2.15.2. Products
- 16.2.15.3. SWOT Analysis
- 16.2.15.4. Recent Developments
- 16.2.15.5. Financials (Based on Availability)
- 16.2.16 Rosenbauer International AG
- 16.2.16.1. Overview
- 16.2.16.2. Products
- 16.2.16.3. SWOT Analysis
- 16.2.16.4. Recent Developments
- 16.2.16.5. Financials (Based on Availability)
- 16.2.17 REV Group Inc
- 16.2.17.1. Overview
- 16.2.17.2. Products
- 16.2.17.3. SWOT Analysis
- 16.2.17.4. Recent Developments
- 16.2.17.5. Financials (Based on Availability)
- 16.2.1 Textron Inc
List of Figures
- Figure 1: Global Emergency and Disaster Response Industry Revenue Breakdown (Million, %) by Region 2024 & 2032
- Figure 2: North America Emergency and Disaster Response Industry Revenue (Million), by Country 2024 & 2032
- Figure 3: North America Emergency and Disaster Response Industry Revenue Share (%), by Country 2024 & 2032
- Figure 4: Europe Emergency and Disaster Response Industry Revenue (Million), by Country 2024 & 2032
- Figure 5: Europe Emergency and Disaster Response Industry Revenue Share (%), by Country 2024 & 2032
- Figure 6: Asia Pacific Emergency and Disaster Response Industry Revenue (Million), by Country 2024 & 2032
- Figure 7: Asia Pacific Emergency and Disaster Response Industry Revenue Share (%), by Country 2024 & 2032
- Figure 8: Latin America Emergency and Disaster Response Industry Revenue (Million), by Country 2024 & 2032
- Figure 9: Latin America Emergency and Disaster Response Industry Revenue Share (%), by Country 2024 & 2032
- Figure 10: Middle East and Africa Emergency and Disaster Response Industry Revenue (Million), by Country 2024 & 2032
- Figure 11: Middle East and Africa Emergency and Disaster Response Industry Revenue Share (%), by Country 2024 & 2032
- Figure 12: North America Emergency and Disaster Response Industry Revenue (Million), by Equipment 2024 & 2032
- Figure 13: North America Emergency and Disaster Response Industry Revenue Share (%), by Equipment 2024 & 2032
- Figure 14: North America Emergency and Disaster Response Industry Revenue (Million), by Vehicle Platform 2024 & 2032
- Figure 15: North America Emergency and Disaster Response Industry Revenue Share (%), by Vehicle Platform 2024 & 2032
- Figure 16: North America Emergency and Disaster Response Industry Revenue (Million), by Country 2024 & 2032
- Figure 17: North America Emergency and Disaster Response Industry Revenue Share (%), by Country 2024 & 2032
- Figure 18: Europe Emergency and Disaster Response Industry Revenue (Million), by Equipment 2024 & 2032
- Figure 19: Europe Emergency and Disaster Response Industry Revenue Share (%), by Equipment 2024 & 2032
- Figure 20: Europe Emergency and Disaster Response Industry Revenue (Million), by Vehicle Platform 2024 & 2032
- Figure 21: Europe Emergency and Disaster Response Industry Revenue Share (%), by Vehicle Platform 2024 & 2032
- Figure 22: Europe Emergency and Disaster Response Industry Revenue (Million), by Country 2024 & 2032
- Figure 23: Europe Emergency and Disaster Response Industry Revenue Share (%), by Country 2024 & 2032
- Figure 24: Asia Pacific Emergency and Disaster Response Industry Revenue (Million), by Equipment 2024 & 2032
- Figure 25: Asia Pacific Emergency and Disaster Response Industry Revenue Share (%), by Equipment 2024 & 2032
- Figure 26: Asia Pacific Emergency and Disaster Response Industry Revenue (Million), by Vehicle Platform 2024 & 2032
- Figure 27: Asia Pacific Emergency and Disaster Response Industry Revenue Share (%), by Vehicle Platform 2024 & 2032
- Figure 28: Asia Pacific Emergency and Disaster Response Industry Revenue (Million), by Country 2024 & 2032
- Figure 29: Asia Pacific Emergency and Disaster Response Industry Revenue Share (%), by Country 2024 & 2032
- Figure 30: Latin America Emergency and Disaster Response Industry Revenue (Million), by Equipment 2024 & 2032
- Figure 31: Latin America Emergency and Disaster Response Industry Revenue Share (%), by Equipment 2024 & 2032
- Figure 32: Latin America Emergency and Disaster Response Industry Revenue (Million), by Vehicle Platform 2024 & 2032
- Figure 33: Latin America Emergency and Disaster Response Industry Revenue Share (%), by Vehicle Platform 2024 & 2032
- Figure 34: Latin America Emergency and Disaster Response Industry Revenue (Million), by Country 2024 & 2032
- Figure 35: Latin America Emergency and Disaster Response Industry Revenue Share (%), by Country 2024 & 2032
- Figure 36: Middle East and Africa Emergency and Disaster Response Industry Revenue (Million), by Equipment 2024 & 2032
- Figure 37: Middle East and Africa Emergency and Disaster Response Industry Revenue Share (%), by Equipment 2024 & 2032
- Figure 38: Middle East and Africa Emergency and Disaster Response Industry Revenue (Million), by Vehicle Platform 2024 & 2032
- Figure 39: Middle East and Africa Emergency and Disaster Response Industry Revenue Share (%), by Vehicle Platform 2024 & 2032
- Figure 40: Middle East and Africa Emergency and Disaster Response Industry Revenue (Million), by Country 2024 & 2032
- Figure 41: Middle East and Africa Emergency and Disaster Response Industry Revenue Share (%), by Country 2024 & 2032
List of Tables
- Table 1: Global Emergency and Disaster Response Industry Revenue Million Forecast, by Region 2019 & 2032
- Table 2: Global Emergency and Disaster Response Industry Revenue Million Forecast, by Equipment 2019 & 2032
- Table 3: Global Emergency and Disaster Response Industry Revenue Million Forecast, by Vehicle Platform 2019 & 2032
- Table 4: Global Emergency and Disaster Response Industry Revenue Million Forecast, by Region 2019 & 2032
- Table 5: Global Emergency and Disaster Response Industry Revenue Million Forecast, by Country 2019 & 2032
- Table 6: United States Emergency and Disaster Response Industry Revenue (Million) Forecast, by Application 2019 & 2032
- Table 7: Canada Emergency and Disaster Response Industry Revenue (Million) Forecast, by Application 2019 & 2032
- Table 8: Global Emergency and Disaster Response Industry Revenue Million Forecast, by Country 2019 & 2032
- Table 9: United Kingdom Emergency and Disaster Response Industry Revenue (Million) Forecast, by Application 2019 & 2032
- Table 10: Germany Emergency and Disaster Response Industry Revenue (Million) Forecast, by Application 2019 & 2032
- Table 11: France Emergency and Disaster Response Industry Revenue (Million) Forecast, by Application 2019 & 2032
- Table 12: Italy Emergency and Disaster Response Industry Revenue (Million) Forecast, by Application 2019 & 2032
- Table 13: Russia Emergency and Disaster Response Industry Revenue (Million) Forecast, by Application 2019 & 2032
- Table 14: Rest of Europe Emergency and Disaster Response Industry Revenue (Million) Forecast, by Application 2019 & 2032
- Table 15: Global Emergency and Disaster Response Industry Revenue Million Forecast, by Country 2019 & 2032
- Table 16: China Emergency and Disaster Response Industry Revenue (Million) Forecast, by Application 2019 & 2032
- Table 17: India Emergency and Disaster Response Industry Revenue (Million) Forecast, by Application 2019 & 2032
- Table 18: Japan Emergency and Disaster Response Industry Revenue (Million) Forecast, by Application 2019 & 2032
- Table 19: South Korea Emergency and Disaster Response Industry Revenue (Million) Forecast, by Application 2019 & 2032
- Table 20: Australia Emergency and Disaster Response Industry Revenue (Million) Forecast, by Application 2019 & 2032
- Table 21: Rest of Asia Pacific Emergency and Disaster Response Industry Revenue (Million) Forecast, by Application 2019 & 2032
- Table 22: Global Emergency and Disaster Response Industry Revenue Million Forecast, by Country 2019 & 2032
- Table 23: Brazil Emergency and Disaster Response Industry Revenue (Million) Forecast, by Application 2019 & 2032
- Table 24: Mexico Emergency and Disaster Response Industry Revenue (Million) Forecast, by Application 2019 & 2032
- Table 25: Rest of Latin America Emergency and Disaster Response Industry Revenue (Million) Forecast, by Application 2019 & 2032
- Table 26: Global Emergency and Disaster Response Industry Revenue Million Forecast, by Country 2019 & 2032
- Table 27: United Arab Emirates Emergency and Disaster Response Industry Revenue (Million) Forecast, by Application 2019 & 2032
- Table 28: Saudi Arabia Emergency and Disaster Response Industry Revenue (Million) Forecast, by Application 2019 & 2032
- Table 29: Egypt Emergency and Disaster Response Industry Revenue (Million) Forecast, by Application 2019 & 2032
- Table 30: South Africa Emergency and Disaster Response Industry Revenue (Million) Forecast, by Application 2019 & 2032
- Table 31: Rest of Middle East and Africa Emergency and Disaster Response Industry Revenue (Million) Forecast, by Application 2019 & 2032
- Table 32: Global Emergency and Disaster Response Industry Revenue Million Forecast, by Equipment 2019 & 2032
- Table 33: Global Emergency and Disaster Response Industry Revenue Million Forecast, by Vehicle Platform 2019 & 2032
- Table 34: Global Emergency and Disaster Response Industry Revenue Million Forecast, by Country 2019 & 2032
- Table 35: United States Emergency and Disaster Response Industry Revenue (Million) Forecast, by Application 2019 & 2032
- Table 36: Canada Emergency and Disaster Response Industry Revenue (Million) Forecast, by Application 2019 & 2032
- Table 37: Global Emergency and Disaster Response Industry Revenue Million Forecast, by Equipment 2019 & 2032
- Table 38: Global Emergency and Disaster Response Industry Revenue Million Forecast, by Vehicle Platform 2019 & 2032
- Table 39: Global Emergency and Disaster Response Industry Revenue Million Forecast, by Country 2019 & 2032
- Table 40: United Kingdom Emergency and Disaster Response Industry Revenue (Million) Forecast, by Application 2019 & 2032
- Table 41: Germany Emergency and Disaster Response Industry Revenue (Million) Forecast, by Application 2019 & 2032
- Table 42: France Emergency and Disaster Response Industry Revenue (Million) Forecast, by Application 2019 & 2032
- Table 43: Italy Emergency and Disaster Response Industry Revenue (Million) Forecast, by Application 2019 & 2032
- Table 44: Russia Emergency and Disaster Response Industry Revenue (Million) Forecast, by Application 2019 & 2032
- Table 45: Rest of Europe Emergency and Disaster Response Industry Revenue (Million) Forecast, by Application 2019 & 2032
- Table 46: Global Emergency and Disaster Response Industry Revenue Million Forecast, by Equipment 2019 & 2032
- Table 47: Global Emergency and Disaster Response Industry Revenue Million Forecast, by Vehicle Platform 2019 & 2032
- Table 48: Global Emergency and Disaster Response Industry Revenue Million Forecast, by Country 2019 & 2032
- Table 49: China Emergency and Disaster Response Industry Revenue (Million) Forecast, by Application 2019 & 2032
- Table 50: India Emergency and Disaster Response Industry Revenue (Million) Forecast, by Application 2019 & 2032
- Table 51: Japan Emergency and Disaster Response Industry Revenue (Million) Forecast, by Application 2019 & 2032
- Table 52: South Korea Emergency and Disaster Response Industry Revenue (Million) Forecast, by Application 2019 & 2032
- Table 53: Australia Emergency and Disaster Response Industry Revenue (Million) Forecast, by Application 2019 & 2032
- Table 54: Rest of Asia Pacific Emergency and Disaster Response Industry Revenue (Million) Forecast, by Application 2019 & 2032
- Table 55: Global Emergency and Disaster Response Industry Revenue Million Forecast, by Equipment 2019 & 2032
- Table 56: Global Emergency and Disaster Response Industry Revenue Million Forecast, by Vehicle Platform 2019 & 2032
- Table 57: Global Emergency and Disaster Response Industry Revenue Million Forecast, by Country 2019 & 2032
- Table 58: Brazil Emergency and Disaster Response Industry Revenue (Million) Forecast, by Application 2019 & 2032
- Table 59: Mexico Emergency and Disaster Response Industry Revenue (Million) Forecast, by Application 2019 & 2032
- Table 60: Rest of Latin America Emergency and Disaster Response Industry Revenue (Million) Forecast, by Application 2019 & 2032
- Table 61: Global Emergency and Disaster Response Industry Revenue Million Forecast, by Equipment 2019 & 2032
- Table 62: Global Emergency and Disaster Response Industry Revenue Million Forecast, by Vehicle Platform 2019 & 2032
- Table 63: Global Emergency and Disaster Response Industry Revenue Million Forecast, by Country 2019 & 2032
- Table 64: United Arab Emirates Emergency and Disaster Response Industry Revenue (Million) Forecast, by Application 2019 & 2032
- Table 65: Saudi Arabia Emergency and Disaster Response Industry Revenue (Million) Forecast, by Application 2019 & 2032
- Table 66: Egypt Emergency and Disaster Response Industry Revenue (Million) Forecast, by Application 2019 & 2032
- Table 67: South Africa Emergency and Disaster Response Industry Revenue (Million) Forecast, by Application 2019 & 2032
- Table 68: Rest of Middle East and Africa Emergency and Disaster Response Industry Revenue (Million) Forecast, by Application 2019 & 2032
Frequently Asked Questions
1. What is the projected Compound Annual Growth Rate (CAGR) of the Emergency and Disaster Response Industry?
The projected CAGR is approximately 6.58%.
2. Which companies are prominent players in the Emergency and Disaster Response Industry?
Key companies in the market include Textron Inc, Magirus GmbH, Honeywell International Inc, Darley, Leonardo SpA, Smiths Group PLC, Viking Air Ltd, Emergency Medical International, Ziegler GmbH, 3M, Juvare LLC, Emergency One Group, Everbridge Inc, Hexagon A, Esri Inc, Rosenbauer International AG, REV Group Inc.
3. What are the main segments of the Emergency and Disaster Response Industry?
The market segments include Equipment, Vehicle Platform.
4. Can you provide details about the market size?
The market size is estimated to be USD 166.73 Million as of 2022.
5. What are some drivers contributing to market growth?
; Increasing Number Of Air Passengers; Use Of Portable Electronic Devices.
6. What are the notable trends driving market growth?
Land Segment to Register the Highest CAGR during the Forecast Period.
7. Are there any restraints impacting market growth?
; High Cost Of Connectivity Equipments.
8. Can you provide examples of recent developments in the market?
N/A
9. What pricing options are available for accessing the report?
Pricing options include single-user, multi-user, and enterprise licenses priced at USD 4750, USD 5250, and USD 8750 respectively.
10. Is the market size provided in terms of value or volume?
The market size is provided in terms of value, measured in Million.
11. Are there any specific market keywords associated with the report?
Yes, the market keyword associated with the report is "Emergency and Disaster Response Industry," which aids in identifying and referencing the specific market segment covered.
12. How do I determine which pricing option suits my needs best?
The pricing options vary based on user requirements and access needs. Individual users may opt for single-user licenses, while businesses requiring broader access may choose multi-user or enterprise licenses for cost-effective access to the report.
13. Are there any additional resources or data provided in the Emergency and Disaster Response Industry report?
While the report offers comprehensive insights, it's advisable to review the specific contents or supplementary materials provided to ascertain if additional resources or data are available.
14. How can I stay updated on further developments or reports in the Emergency and Disaster Response Industry?
To stay informed about further developments, trends, and reports in the Emergency and Disaster Response Industry, consider subscribing to industry newsletters, following relevant companies and organizations, or regularly checking reputable industry news sources and publications.
Methodology
Step 1 - Identification of Relevant Samples Size from Population Database


Step 2 - Approaches for Defining Global Market Size (Value, Volume* & Price*)

Note*: In applicable scenarios
Step 3 - Data Sources
Primary Research
- Web Analytics
- Survey Reports
- Research Institute
- Latest Research Reports
- Opinion Leaders
Secondary Research
- Annual Reports
- White Paper
- Latest Press Release
- Industry Association
- Paid Database
- Investor Presentations

Step 4 - Data Triangulation
Involves using different sources of information in order to increase the validity of a study
These sources are likely to be stakeholders in a program - participants, other researchers, program staff, other community members, and so on.
Then we put all data in single framework & apply various statistical tools to find out the dynamic on the market.
During the analysis stage, feedback from the stakeholder groups would be compared to determine areas of agreement as well as areas of divergence


