
Key Insights
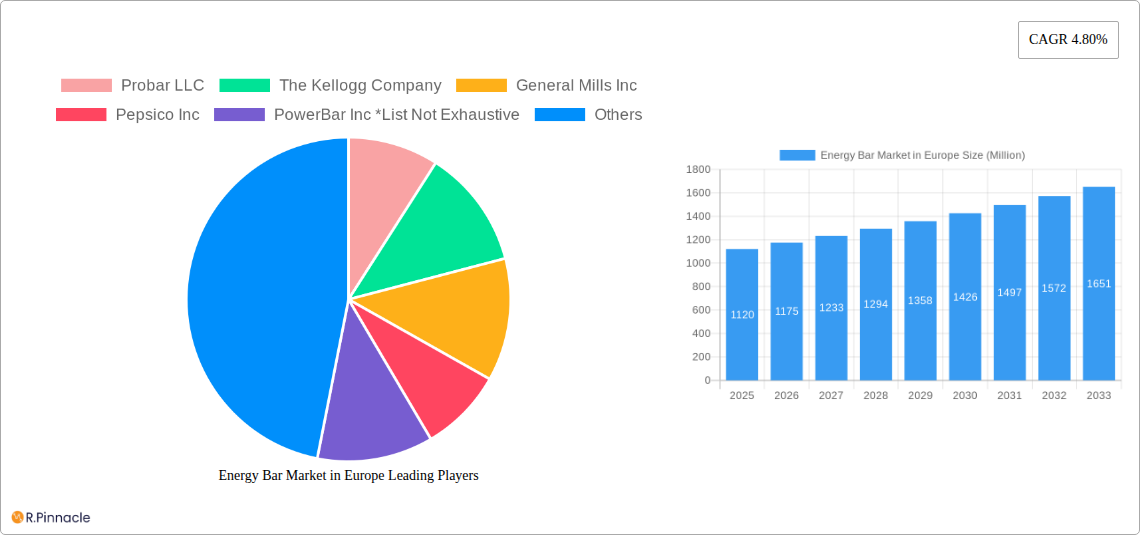
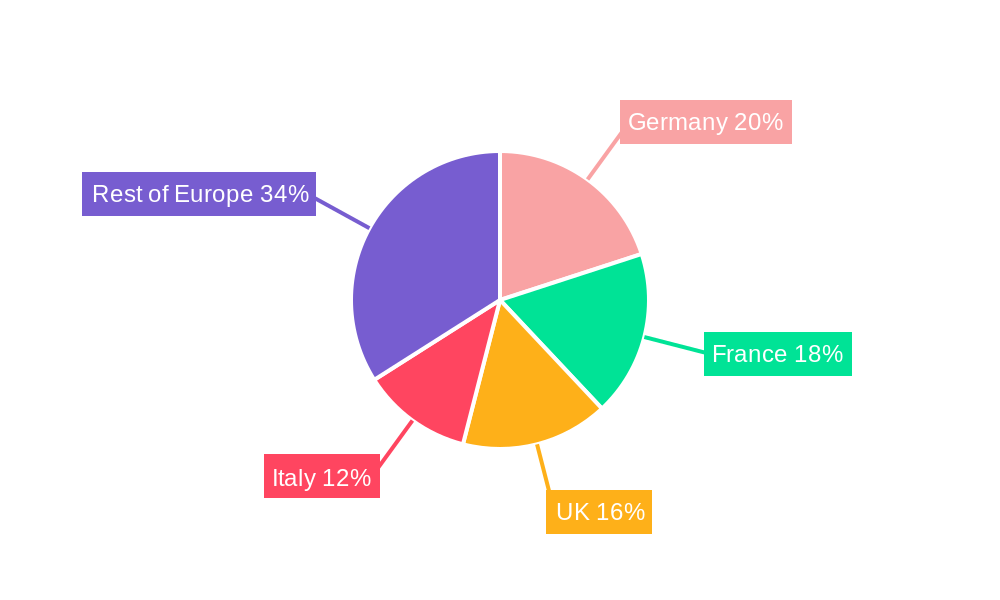
The European energy bar market, valued at €1120 million in 2025, is projected to experience robust growth, driven by increasing health consciousness among consumers and the rising popularity of convenient, on-the-go snacking options. The market's Compound Annual Growth Rate (CAGR) of 4.80% from 2025 to 2033 indicates a steady expansion, fueled by the increasing demand for functional foods and the growing adoption of active lifestyles. Key distribution channels include supermarkets/hypermarkets, convenience stores, and online retail platforms, with the latter witnessing significant growth due to increased e-commerce penetration. Leading players like Probar LLC, Kellogg's, General Mills, PepsiCo, and Nestlé are vying for market share through product innovation, strategic partnerships, and expansion into new markets. Growth is further spurred by the introduction of energy bars catering to specific dietary needs, such as vegan, gluten-free, and high-protein options. However, factors like fluctuating raw material prices and increasing competition from alternative healthy snacks could pose challenges to market expansion. The German, French, UK, and Italian markets are expected to be the major contributors to the overall European market growth due to high consumer spending on health and wellness products and established distribution networks.
The segmentation by distribution channel reveals a dynamic market landscape. Supermarkets and hypermarkets currently hold a significant share, but online retail is rapidly gaining traction, driven by consumer preference for convenience and wider product selection. Specialist stores catering to health-conscious consumers also represent a notable segment. Regional variations in consumer preferences and dietary habits influence market dynamics within Europe. Further research into specific regional trends within the various European countries listed would offer a more granular understanding of market opportunities. Sustained growth will likely depend on continued innovation in product formulations, flavors, and packaging, coupled with effective marketing strategies that resonate with the target demographic. Addressing consumer concerns regarding sugar content and artificial ingredients will be crucial for maintaining market momentum.
Energy Bar Market in Europe: A Comprehensive Market Report (2019-2033)
This comprehensive report provides an in-depth analysis of the Energy Bar Market in Europe, covering the period from 2019 to 2033. It offers valuable insights into market dynamics, competitive landscape, and future growth potential, empowering industry professionals to make informed strategic decisions. The report utilizes data from the historical period (2019-2024), base year (2025), and estimated year (2025) to project the market's trajectory until 2033. Key players analyzed include Probar LLC, The Kellogg Company, General Mills Inc, Pepsico Inc, PowerBar Inc, Quest Nutrition LLC, Oatein, Clif Bar & Company, Nestlé S.A., and Mars, Incorporated. This is not an exhaustive list. The market is segmented by distribution channel: Supermarkets/Hypermarkets, Convenience Stores, Specialist stores, Online Retail Stores, and Other Distribution Channels. The report’s total market value is projected to reach xx Million by 2033.
Energy Bar Market in Europe Market Structure & Innovation Trends
This section analyzes the European energy bar market's structure, focusing on market concentration, innovation drivers, regulatory landscapes, product substitutes, end-user demographics, and mergers and acquisitions (M&A) activities. The market exhibits a moderately concentrated structure, with a few major players holding significant market share. However, smaller niche players and private labels are also contributing to the market's diversity.
Market Concentration: The top 5 players hold approximately xx% of the market share in 2025. This is expected to slightly decrease to xx% by 2033 due to increased competition from smaller brands and private label offerings.
Innovation Drivers: Health and wellness trends, increasing demand for convenient and nutritious snacks, and the rise of functional foods are key innovation drivers. Product innovation focuses on organic, gluten-free, vegan, and high-protein options.
Regulatory Frameworks: EU regulations concerning food labeling, ingredients, and health claims significantly impact product development and marketing strategies. Compliance costs are a factor in market dynamics.
Product Substitutes: Other convenient snack options, such as protein shakes, fruit, and yogurt, pose competitive challenges. However, energy bars’ unique combination of convenience and nutritional benefits contributes to their continued market appeal.
End-User Demographics: The primary consumer base consists of health-conscious individuals, athletes, and busy professionals aged 25-55. However, growth is observed across a wider age range due to the increasing awareness of the importance of health and nutrition.
M&A Activities: The energy bar sector has witnessed significant M&A activity in recent years, with deal values exceeding xx Million in the last five years. These activities are driven by expansion strategies and the consolidation of market share. For instance, the acquisition of Bioenergy by Clif Bar & Company in 2022 is a noteworthy event.
Energy Bar Market in Europe Market Dynamics & Trends
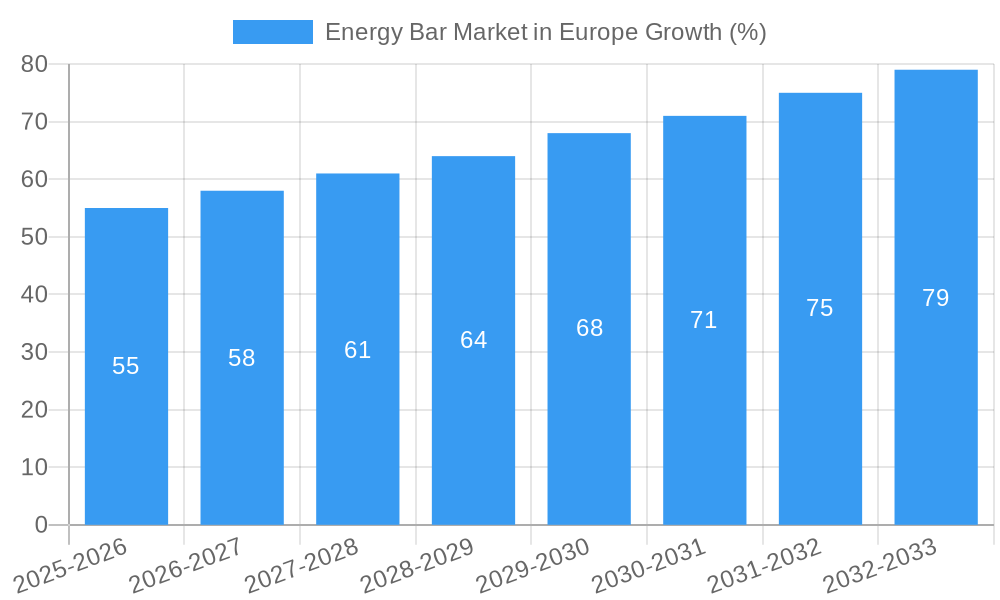
The European energy bar market is experiencing robust growth, driven by several factors. The market’s Compound Annual Growth Rate (CAGR) is estimated to be xx% during the forecast period (2025-2033). Market penetration is expected to increase from xx% in 2025 to xx% by 2033, indicating significant growth potential. The rise in health consciousness, increasing demand for convenient food options, and the growing popularity of fitness activities are significant growth drivers. However, changing consumer preferences and the emergence of substitute products pose challenges. Technological disruptions, such as improved manufacturing techniques and innovative packaging solutions, are shaping market competition. Pricing strategies also play a crucial role in influencing market dynamics.
Dominant Regions & Segments in Energy Bar Market in Europe
The UK and Germany currently hold the largest market share within Europe. This dominance is attributed to several factors:
Key Drivers in the UK: High disposable incomes, a strong focus on health and wellness, a well-established retail infrastructure, and the presence of a large number of health-conscious consumers.
Key Drivers in Germany: Similar to the UK, Germany also boasts strong consumer spending power, a growing health-conscious population, and a well-developed retail network.
By Distribution Channel: Supermarkets/hypermarkets account for the largest segment, followed by convenience stores and specialist stores. Online retail is a growing segment demonstrating strong growth potential.
Energy Bar Market in Europe Product Innovations
Recent product innovations focus on natural and organic ingredients, unique flavor profiles, and functional benefits beyond simple energy boosting. Increased emphasis on sustainability in packaging and sourcing is also apparent. The competitive advantage lies in offering unique ingredient blends, specialized formulations for specific dietary needs (e.g., vegan, keto), and convenient packaging formats. Technological advancements in manufacturing processes enable the production of more nutritious and palatable products, thus contributing to market growth.
Report Scope & Segmentation Analysis
This report segments the Energy Bar Market in Europe by distribution channel:
Supermarkets/Hypermarkets: This segment holds the largest market share due to wide reach and consumer preference for bulk purchases. Growth is projected at xx% CAGR during the forecast period.
Convenience Stores: This segment benefits from its accessibility and impulse buying nature, exhibiting moderate growth. CAGR is projected at xx%.
Specialist Stores: This segment focuses on niche products and caters to specific consumer needs, showing significant growth potential with a CAGR of xx%.
Online Retail Stores: Rapid growth is observed in this segment, driven by increased online shopping and convenience. CAGR is projected at xx%.
Other Distribution Channels: This segment includes smaller retailers and direct-to-consumer sales, with moderate growth potential and a CAGR of xx%.
Key Drivers of Energy Bar Market in Europe Growth
The growth of the European energy bar market is driven by several key factors: the rising prevalence of health-conscious consumers, the growing popularity of fitness and sports, and increased demand for convenient and portable snack options. Government regulations promoting healthy eating habits also contribute. Technological advancements in production and packaging enhance product quality and shelf life, further boosting growth.
Challenges in the Energy Bar Market in Europe Sector
Challenges include intense competition from established and emerging players, fluctuating raw material prices, stringent regulatory compliance requirements, and consumer preferences shifting towards healthier and more natural ingredients. These factors influence pricing and profitability, necessitating continuous innovation and efficient supply chain management.
Emerging Opportunities in Energy Bar Market in Europe
Opportunities include the growing demand for functional energy bars with added health benefits (e.g., probiotics, added vitamins), expanding into new markets within Europe, and exploring sustainable and ethically sourced ingredients. Developing innovative packaging solutions, particularly focusing on eco-friendly options, can attract environmentally conscious consumers.
Leading Players in the Energy Bar Market in Europe Market
- Probar LLC
- The Kellogg Company
- General Mills Inc
- Pepsico Inc
- PowerBar Inc
- Quest Nutrition LLC
- Oatein
- Clif Bar & Company
- Nestlé S.A.
- Mars, Incorporated
Key Developments in Energy Bar Market in Europe Industry
- 2022: Clif Bar & Company acquires a majority stake in Bioenergy, expanding its European presence.
- 2021: Launch of several new product lines focusing on vegan and organic ingredients by major players.
- 2020: Increased focus on sustainable packaging across the industry.
- 2019: Several mergers and acquisitions aimed at consolidating market share.
Future Outlook for Energy Bar Market in Europe Market
The European energy bar market is poised for continued growth, driven by evolving consumer preferences and increasing demand for convenient and healthy snack options. The market's future hinges on innovation, sustainability, and a strong focus on meeting evolving consumer needs. Strategic partnerships and expansions into emerging markets will play a vital role in shaping the market's trajectory.
Energy Bar Market in Europe Segmentation
-
1. Distribution Channel
- 1.1. Supermarkets/Hypermarkets
- 1.2. Convenience Stores
- 1.3. Specialist stores
- 1.4. Online Retail Stores
- 1.5. Other Distribution Channels
Energy Bar Market in Europe Segmentation By Geography
-
1. Europe
- 1.1. Spain
- 1.2. United Kingdom
- 1.3. Germany
- 1.4. France
- 1.5. Italy
- 1.6. Russia
- 1.7. Rest of Europe
Energy Bar Market in Europe REPORT HIGHLIGHTS
| Aspects | Details |
|---|---|
| Study Period | 2019-2033 |
| Base Year | 2024 |
| Estimated Year | 2025 |
| Forecast Period | 2025-2033 |
| Historical Period | 2019-2024 |
| Growth Rate | CAGR of 4.80% from 2019-2033 |
| Segmentation |
|
Table of Contents
- 1. Introduction
- 1.1. Research Scope
- 1.2. Market Segmentation
- 1.3. Research Methodology
- 1.4. Definitions and Assumptions
- 2. Executive Summary
- 2.1. Introduction
- 3. Market Dynamics
- 3.1. Introduction
- 3.2. Market Drivers
- 3.2.1. Increasing Demand for Clean Label Ingredients; Growing Health Consciousness of Consumers
- 3.3. Market Restrains
- 3.3.1. Higher Manufacturing Cost
- 3.4. Market Trends
- 3.4.1. United Kingdom Dominating the Market
- 4. Market Factor Analysis
- 4.1. Porters Five Forces
- 4.2. Supply/Value Chain
- 4.3. PESTEL analysis
- 4.4. Market Entropy
- 4.5. Patent/Trademark Analysis
- 5. Energy Bar Market in Europe Analysis, Insights and Forecast, 2019-2031
- 5.1. Market Analysis, Insights and Forecast - by Distribution Channel
- 5.1.1. Supermarkets/Hypermarkets
- 5.1.2. Convenience Stores
- 5.1.3. Specialist stores
- 5.1.4. Online Retail Stores
- 5.1.5. Other Distribution Channels
- 5.2. Market Analysis, Insights and Forecast - by Region
- 5.2.1. Europe
- 5.1. Market Analysis, Insights and Forecast - by Distribution Channel
- 6. Germany Energy Bar Market in Europe Analysis, Insights and Forecast, 2019-2031
- 7. France Energy Bar Market in Europe Analysis, Insights and Forecast, 2019-2031
- 8. Italy Energy Bar Market in Europe Analysis, Insights and Forecast, 2019-2031
- 9. United Kingdom Energy Bar Market in Europe Analysis, Insights and Forecast, 2019-2031
- 10. Netherlands Energy Bar Market in Europe Analysis, Insights and Forecast, 2019-2031
- 11. Sweden Energy Bar Market in Europe Analysis, Insights and Forecast, 2019-2031
- 12. Rest of Europe Energy Bar Market in Europe Analysis, Insights and Forecast, 2019-2031
- 13. Competitive Analysis
- 13.1. Market Share Analysis 2024
- 13.2. Company Profiles
- 13.2.1 Probar LLC
- 13.2.1.1. Overview
- 13.2.1.2. Products
- 13.2.1.3. SWOT Analysis
- 13.2.1.4. Recent Developments
- 13.2.1.5. Financials (Based on Availability)
- 13.2.2 The Kellogg Company
- 13.2.2.1. Overview
- 13.2.2.2. Products
- 13.2.2.3. SWOT Analysis
- 13.2.2.4. Recent Developments
- 13.2.2.5. Financials (Based on Availability)
- 13.2.3 General Mills Inc
- 13.2.3.1. Overview
- 13.2.3.2. Products
- 13.2.3.3. SWOT Analysis
- 13.2.3.4. Recent Developments
- 13.2.3.5. Financials (Based on Availability)
- 13.2.4 Pepsico Inc
- 13.2.4.1. Overview
- 13.2.4.2. Products
- 13.2.4.3. SWOT Analysis
- 13.2.4.4. Recent Developments
- 13.2.4.5. Financials (Based on Availability)
- 13.2.5 PowerBar Inc *List Not Exhaustive
- 13.2.5.1. Overview
- 13.2.5.2. Products
- 13.2.5.3. SWOT Analysis
- 13.2.5.4. Recent Developments
- 13.2.5.5. Financials (Based on Availability)
- 13.2.6 QuestNutrition LLC
- 13.2.6.1. Overview
- 13.2.6.2. Products
- 13.2.6.3. SWOT Analysis
- 13.2.6.4. Recent Developments
- 13.2.6.5. Financials (Based on Availability)
- 13.2.7 Oatein
- 13.2.7.1. Overview
- 13.2.7.2. Products
- 13.2.7.3. SWOT Analysis
- 13.2.7.4. Recent Developments
- 13.2.7.5. Financials (Based on Availability)
- 13.2.8 Clif Bar & Company
- 13.2.8.1. Overview
- 13.2.8.2. Products
- 13.2.8.3. SWOT Analysis
- 13.2.8.4. Recent Developments
- 13.2.8.5. Financials (Based on Availability)
- 13.2.9 Nestlé S.A.
- 13.2.9.1. Overview
- 13.2.9.2. Products
- 13.2.9.3. SWOT Analysis
- 13.2.9.4. Recent Developments
- 13.2.9.5. Financials (Based on Availability)
- 13.2.10 Mars Incorporated
- 13.2.10.1. Overview
- 13.2.10.2. Products
- 13.2.10.3. SWOT Analysis
- 13.2.10.4. Recent Developments
- 13.2.10.5. Financials (Based on Availability)
- 13.2.1 Probar LLC
List of Figures
- Figure 1: Energy Bar Market in Europe Revenue Breakdown (Million, %) by Product 2024 & 2032
- Figure 2: Energy Bar Market in Europe Share (%) by Company 2024
List of Tables
- Table 1: Energy Bar Market in Europe Revenue Million Forecast, by Region 2019 & 2032
- Table 2: Energy Bar Market in Europe Volume K Tons Forecast, by Region 2019 & 2032
- Table 3: Energy Bar Market in Europe Revenue Million Forecast, by Distribution Channel 2019 & 2032
- Table 4: Energy Bar Market in Europe Volume K Tons Forecast, by Distribution Channel 2019 & 2032
- Table 5: Energy Bar Market in Europe Revenue Million Forecast, by Region 2019 & 2032
- Table 6: Energy Bar Market in Europe Volume K Tons Forecast, by Region 2019 & 2032
- Table 7: Energy Bar Market in Europe Revenue Million Forecast, by Country 2019 & 2032
- Table 8: Energy Bar Market in Europe Volume K Tons Forecast, by Country 2019 & 2032
- Table 9: Germany Energy Bar Market in Europe Revenue (Million) Forecast, by Application 2019 & 2032
- Table 10: Germany Energy Bar Market in Europe Volume (K Tons) Forecast, by Application 2019 & 2032
- Table 11: France Energy Bar Market in Europe Revenue (Million) Forecast, by Application 2019 & 2032
- Table 12: France Energy Bar Market in Europe Volume (K Tons) Forecast, by Application 2019 & 2032
- Table 13: Italy Energy Bar Market in Europe Revenue (Million) Forecast, by Application 2019 & 2032
- Table 14: Italy Energy Bar Market in Europe Volume (K Tons) Forecast, by Application 2019 & 2032
- Table 15: United Kingdom Energy Bar Market in Europe Revenue (Million) Forecast, by Application 2019 & 2032
- Table 16: United Kingdom Energy Bar Market in Europe Volume (K Tons) Forecast, by Application 2019 & 2032
- Table 17: Netherlands Energy Bar Market in Europe Revenue (Million) Forecast, by Application 2019 & 2032
- Table 18: Netherlands Energy Bar Market in Europe Volume (K Tons) Forecast, by Application 2019 & 2032
- Table 19: Sweden Energy Bar Market in Europe Revenue (Million) Forecast, by Application 2019 & 2032
- Table 20: Sweden Energy Bar Market in Europe Volume (K Tons) Forecast, by Application 2019 & 2032
- Table 21: Rest of Europe Energy Bar Market in Europe Revenue (Million) Forecast, by Application 2019 & 2032
- Table 22: Rest of Europe Energy Bar Market in Europe Volume (K Tons) Forecast, by Application 2019 & 2032
- Table 23: Energy Bar Market in Europe Revenue Million Forecast, by Distribution Channel 2019 & 2032
- Table 24: Energy Bar Market in Europe Volume K Tons Forecast, by Distribution Channel 2019 & 2032
- Table 25: Energy Bar Market in Europe Revenue Million Forecast, by Country 2019 & 2032
- Table 26: Energy Bar Market in Europe Volume K Tons Forecast, by Country 2019 & 2032
- Table 27: Spain Energy Bar Market in Europe Revenue (Million) Forecast, by Application 2019 & 2032
- Table 28: Spain Energy Bar Market in Europe Volume (K Tons) Forecast, by Application 2019 & 2032
- Table 29: United Kingdom Energy Bar Market in Europe Revenue (Million) Forecast, by Application 2019 & 2032
- Table 30: United Kingdom Energy Bar Market in Europe Volume (K Tons) Forecast, by Application 2019 & 2032
- Table 31: Germany Energy Bar Market in Europe Revenue (Million) Forecast, by Application 2019 & 2032
- Table 32: Germany Energy Bar Market in Europe Volume (K Tons) Forecast, by Application 2019 & 2032
- Table 33: France Energy Bar Market in Europe Revenue (Million) Forecast, by Application 2019 & 2032
- Table 34: France Energy Bar Market in Europe Volume (K Tons) Forecast, by Application 2019 & 2032
- Table 35: Italy Energy Bar Market in Europe Revenue (Million) Forecast, by Application 2019 & 2032
- Table 36: Italy Energy Bar Market in Europe Volume (K Tons) Forecast, by Application 2019 & 2032
- Table 37: Russia Energy Bar Market in Europe Revenue (Million) Forecast, by Application 2019 & 2032
- Table 38: Russia Energy Bar Market in Europe Volume (K Tons) Forecast, by Application 2019 & 2032
- Table 39: Rest of Europe Energy Bar Market in Europe Revenue (Million) Forecast, by Application 2019 & 2032
- Table 40: Rest of Europe Energy Bar Market in Europe Volume (K Tons) Forecast, by Application 2019 & 2032
Frequently Asked Questions
1. What is the projected Compound Annual Growth Rate (CAGR) of the Energy Bar Market in Europe?
The projected CAGR is approximately 4.80%.
2. Which companies are prominent players in the Energy Bar Market in Europe?
Key companies in the market include Probar LLC, The Kellogg Company, General Mills Inc, Pepsico Inc, PowerBar Inc *List Not Exhaustive, QuestNutrition LLC, Oatein, Clif Bar & Company, Nestlé S.A. , Mars, Incorporated.
3. What are the main segments of the Energy Bar Market in Europe?
The market segments include Distribution Channel.
4. Can you provide details about the market size?
The market size is estimated to be USD 1120 Million as of 2022.
5. What are some drivers contributing to market growth?
Increasing Demand for Clean Label Ingredients; Growing Health Consciousness of Consumers.
6. What are the notable trends driving market growth?
United Kingdom Dominating the Market.
7. Are there any restraints impacting market growth?
Higher Manufacturing Cost.
8. Can you provide examples of recent developments in the market?
Recent developments in the Energy Bar Market in Europe include product launches, mergers and acquisitions, and strategic partnerships. For instance, in 2022, Clif Bar & Company acquired a majority stake in UK-based energy bar manufacturer, Bioenergy. This acquisition expanded Clif Bar's presence in the European market and strengthened its product portfolio.
9. What pricing options are available for accessing the report?
Pricing options include single-user, multi-user, and enterprise licenses priced at USD 4750, USD 5250, and USD 8750 respectively.
10. Is the market size provided in terms of value or volume?
The market size is provided in terms of value, measured in Million and volume, measured in K Tons.
11. Are there any specific market keywords associated with the report?
Yes, the market keyword associated with the report is "Energy Bar Market in Europe," which aids in identifying and referencing the specific market segment covered.
12. How do I determine which pricing option suits my needs best?
The pricing options vary based on user requirements and access needs. Individual users may opt for single-user licenses, while businesses requiring broader access may choose multi-user or enterprise licenses for cost-effective access to the report.
13. Are there any additional resources or data provided in the Energy Bar Market in Europe report?
While the report offers comprehensive insights, it's advisable to review the specific contents or supplementary materials provided to ascertain if additional resources or data are available.
14. How can I stay updated on further developments or reports in the Energy Bar Market in Europe?
To stay informed about further developments, trends, and reports in the Energy Bar Market in Europe, consider subscribing to industry newsletters, following relevant companies and organizations, or regularly checking reputable industry news sources and publications.
Methodology
Step 1 - Identification of Relevant Samples Size from Population Database


Step 2 - Approaches for Defining Global Market Size (Value, Volume* & Price*)

Note*: In applicable scenarios
Step 3 - Data Sources
Primary Research
- Web Analytics
- Survey Reports
- Research Institute
- Latest Research Reports
- Opinion Leaders
Secondary Research
- Annual Reports
- White Paper
- Latest Press Release
- Industry Association
- Paid Database
- Investor Presentations

Step 4 - Data Triangulation
Involves using different sources of information in order to increase the validity of a study
These sources are likely to be stakeholders in a program - participants, other researchers, program staff, other community members, and so on.
Then we put all data in single framework & apply various statistical tools to find out the dynamic on the market.
During the analysis stage, feedback from the stakeholder groups would be compared to determine areas of agreement as well as areas of divergence


