

Key Insights
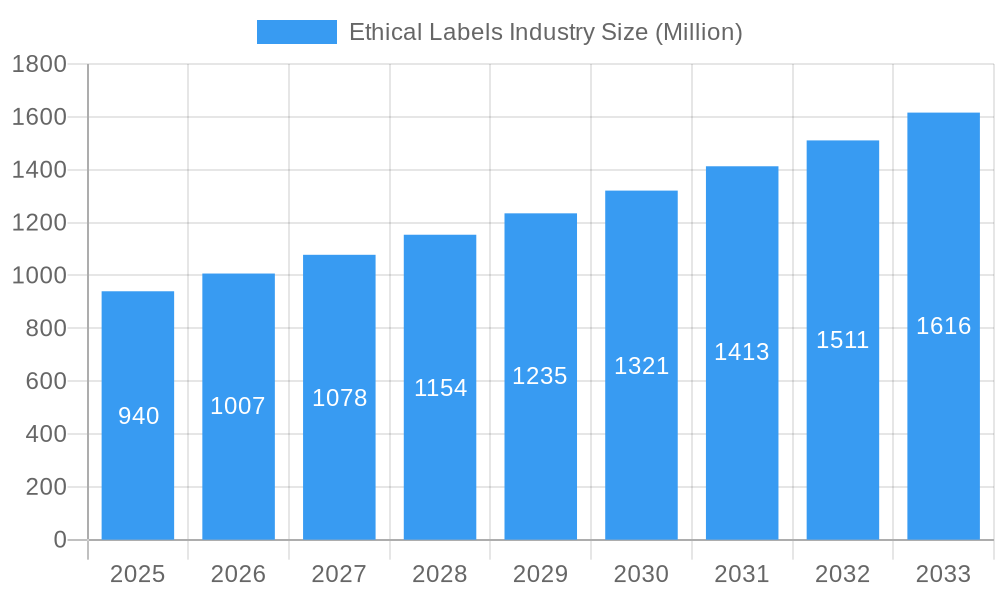
The ethical labels market, valued at $0.94 billion in 2025, is experiencing robust growth, projected to expand at a compound annual growth rate (CAGR) of 7.10% from 2025 to 2033. This growth is fueled by rising consumer demand for transparency and ethically sourced products. Increasing awareness of environmental and social issues, coupled with a growing preference for sustainable and responsible consumption patterns, are key drivers. The market segmentation reveals significant opportunities across various label types, including Halal, organic, clean, sustainability, fair trade, animal welfare, and vegan labels, catering to diverse consumer preferences and ethical concerns. The food and beverage sectors dominate product-type segmentation, reflecting the significant impact of ethical considerations on food choices. Distribution channels are witnessing a shift towards online platforms, reflecting broader e-commerce trends and the convenience it offers to consumers seeking ethically labeled products. Major players like PepsiCo, Ingredion, DSM, Kraft Heinz, Kerry Group, Cargill, and others are actively involved, indicating significant industry competition and potential for further consolidation and innovation. Geographic distribution likely reflects established consumer markets in North America and Europe, with significant growth potential in the Asia Pacific region driven by increasing disposable incomes and changing consumer attitudes.
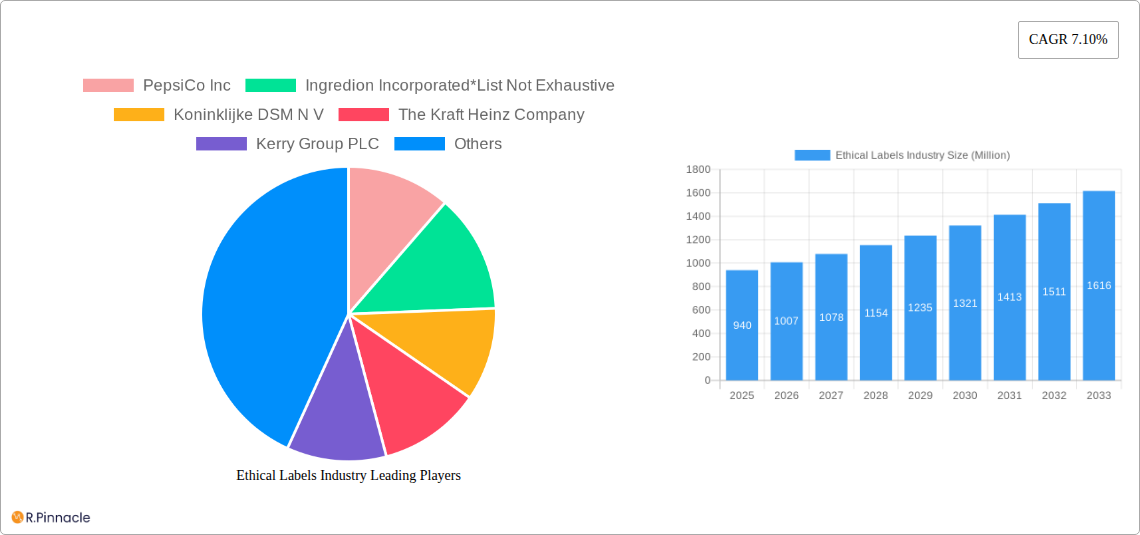
Ethical Labels Industry Market Size (In Million)
The forecast period (2025-2033) suggests a continued upward trajectory for the ethical labels market, driven by factors such as stricter regulations promoting ethical sourcing and labeling, the expansion of e-commerce, and ongoing technological advancements aiding in traceability and transparency. However, challenges remain, including potential inconsistencies in labeling standards across different regions and the need for robust verification mechanisms to ensure authenticity and consumer trust. Successful players will likely focus on building strong supply chains, ensuring product traceability, and actively engaging with consumers to communicate their ethical commitment. Innovation in label technologies, coupled with strategic partnerships across the value chain, will be crucial for sustained growth and market leadership in the coming years.
Ethical Labels Industry Company Market Share
Ethical Labels Industry: A Comprehensive Market Report (2019-2033)
This in-depth report provides a comprehensive analysis of the Ethical Labels Industry, projecting a market size of $XX Million by 2033. The study period spans from 2019 to 2033, with 2025 serving as the base and estimated year. This report is invaluable for industry professionals, investors, and strategists seeking actionable insights into this rapidly evolving market. The report covers key segments including Halal, Organic, Vegan, and Fairtrade labels across food and beverage products, distributed both online and offline. Leading companies like PepsiCo Inc, Ingredion Incorporated, Koninklijke DSM N V, and others are profiled, offering a detailed competitive landscape.
Ethical Labels Industry Market Structure & Innovation Trends
The Ethical Labels Industry exhibits a moderately concentrated market structure, with several large multinational corporations holding significant market share. PepsiCo Inc, for example, holds an estimated xx% market share in the beverage segment. However, smaller, specialized companies are also gaining traction, particularly in niche label types like vegan and animal welfare certifications. The market is driven by increasing consumer demand for ethical and sustainable products. Regulatory frameworks, such as those related to organic certification and fair trade practices, are significant drivers of industry growth. The market is also witnessing substantial M&A activity, with deal values exceeding $XX Million in the past five years. These deals are primarily focused on expanding product portfolios and geographical reach.
- Market Concentration: Moderately concentrated, with major players holding significant shares.
- Innovation Drivers: Growing consumer demand for ethical products, stringent regulations.
- M&A Activity: Significant M&A activity valued at over $XX Million in the last five years.
- Regulatory Frameworks: Stringent regulations drive innovation and standardization.
- Product Substitutes: Limited substitutes, as ethical labels offer unique value propositions.
Ethical Labels Industry Market Dynamics & Trends
The Ethical Labels Industry is experiencing robust growth, with a Compound Annual Growth Rate (CAGR) of xx% projected from 2025 to 2033. This growth is fueled by several key factors. Rising consumer awareness of ethical sourcing and sustainable practices is a major driver. Technological advancements, such as blockchain technology for traceability, are enhancing transparency and trust. Changing consumer preferences, particularly among millennials and Gen Z, are pushing demand for products with ethical labels. The competitive landscape is dynamic, with both established players and new entrants vying for market share. Market penetration of ethical labels is projected to reach xx% by 2033.
Dominant Regions & Segments in Ethical Labels Industry
The Ethical Labels Industry shows strong regional variations. Europe and North America are currently the dominant regions, driven by high consumer awareness and strong regulatory frameworks. However, Asia-Pacific is expected to experience significant growth in the forecast period due to increasing disposable incomes and growing environmental consciousness.
By Label Type:
- Organic: Remains a dominant segment, driven by strong consumer preference for natural and healthy products.
- Vegan: Shows strong growth potential, fuelled by the increasing adoption of vegan lifestyles.
- Fairtrade: Steady growth reflecting consumer support for fair labor practices.
By Product Type:
- Food: Holds the largest market share due to widespread consumer preference for ethical food products.
- Beverages: Shows strong growth potential due to the increasing adoption of plant-based beverages.
By Distribution Channel:
Offline: Remains the dominant channel, especially for food products.
Online: Growing rapidly, driven by increased e-commerce penetration and convenience.
Key Drivers (Europe & North America): Strong consumer awareness, robust regulatory frameworks.
Key Drivers (Asia-Pacific): Rising disposable incomes, growing environmental consciousness.
Ethical Labels Industry Product Innovations
Recent product innovations focus on enhancing transparency, traceability, and sustainability. Blockchain technology is increasingly being used to track products from farm to shelf, building consumer trust. Companies are also developing innovative solutions to reduce their environmental footprint, such as using recycled materials and minimizing waste. These innovations improve the competitive advantage of manufacturers by demonstrating commitment to ethical practices.
Report Scope & Segmentation Analysis
This report segments the Ethical Labels Industry by Label Type (Halal, Organic, Clean, Sustainability and Fairtrade labels, Animal Welfare Labels, Vegan Labels, Other Label Types), Product Type (Food, Beverages), and Distribution Channel (Offline, Online). Each segment's growth projections, market size, and competitive dynamics are analyzed extensively. Market size for each segment is projected to reach $XX Million by 2033 with varying CAGRs based on segment attractiveness. Competitive intensity varies across segments, with some experiencing more competition than others.
Key Drivers of Ethical Labels Industry Growth
The Ethical Labels Industry is experiencing robust expansion, fueled by a confluence of powerful factors. A paramount driver is the burgeoning consumer consciousness regarding ethical sourcing, environmental sustainability, and fair labor practices. Consumers are increasingly scrutinizing the origins of products and making purchasing decisions that align with their values. Complementing this consumer push are evolving government regulations and the proliferation of certifications, which not only mandate higher standards but also provide a framework for accountability and consumer trust. Furthermore, technological advancements, notably blockchain technology, are revolutionizing supply chain transparency and traceability. This enhanced visibility empowers consumers and businesses alike, fostering greater confidence in the integrity of ethical claims. Finally, the growing global disposable incomes, particularly within emerging economies, are creating a larger consumer base with the financial capacity to prioritize ethical and sustainable product choices.
Challenges in the Ethical Labels Industry Sector
Despite its upward trajectory, the Ethical Labels Industry navigates a landscape marked by distinct challenges. A significant hurdle is the fragmented and inconsistent regulatory landscape across different geographical regions, creating complexities in achieving and maintaining compliance for global businesses. Ensuring end-to-end ethical practices throughout intricate global supply chains remains a constant and resource-intensive endeavor. Moreover, the industry grapples with the challenge of "greenwashing" or unsubstantiated ethical claims made by some companies, which can erode consumer trust and create an uneven playing field for genuinely committed businesses. These collective challenges can lead to significant financial repercussions, with estimates suggesting a potential loss of up to 15-20% in annual revenue due to non-compliance, supply chain disruptions, and reputational damage.
Emerging Opportunities in Ethical Labels Industry
The Ethical Labels Industry is brimming with promising avenues for growth and innovation. A key opportunity lies in the strategic expansion into burgeoning new markets, especially within developing economies where a growing middle class is increasingly adopting ethical consumption habits. Technological advancements are unlocking new potential, with AI-powered solutions poised to enhance supply chain management, detect fraudulent claims, and improve the efficiency of ethical verification processes. The industry can also capitalize on the demand for specialized ethical certifications by focusing on niche areas such as carbon footprint labeling, water usage transparency, and biodiversity preservation. These targeted labels cater to increasingly informed consumer segments and offer distinct competitive advantages.
Leading Players in the Ethical Labels Industry Market
Key Developments in Ethical Labels Industry Industry
- September 2023: Maranello made a significant entry into the promotional objects market with the launch of its new ethical label, emphasizing sustainability and social responsibility. This initiative is anticipated to set new benchmarks and influence the broader promotional materials sector within the ethical label domain.
- June 2023: Kerry introduced Biobake EgR, an innovative enzyme solution designed to facilitate the use of free-range or organic eggs in baked goods. This development directly addresses growing consumer demand for ethically sourced animal products and is expected to positively impact the market for animal welfare-focused labels in the bakery industry.
Future Outlook for Ethical Labels Industry Market
The future outlook for the Ethical Labels Industry Market is exceptionally bright, characterized by sustained and significant growth. The unwavering surge in consumer demand for products that demonstrably adhere to ethical and sustainable principles will continue to be the primary growth engine. Strategic penetration into new and emerging markets, particularly those with rapidly expanding middle-class populations, presents a substantial opportunity for market expansion. Continuous investment in and adoption of advanced technologies, with a steadfast focus on enhancing transparency, traceability, and verifiable claims, will be crucial in solidifying the industry's progress and building enduring consumer trust. Furthermore, the concerted effort towards establishing and promoting broader, universally recognized industry standards and certifications will be instrumental in driving future growth, fostering market consolidation, and elevating the overall credibility of the ethical labels sector.
Ethical Labels Industry Segmentation
-
1. Label Type
- 1.1. Halal
- 1.2. Organic
- 1.3. Clean
- 1.4. Sustainability and Fairtrade labels
- 1.5. Animal Welfare Labels
- 1.6. Vegan Labels
- 1.7. Other Label Types
-
2. Product Type
- 2.1. Food
- 2.2. Beverages
-
3. Distribution Channel
- 3.1. Offline
- 3.2. Online
Ethical Labels Industry Segmentation By Geography
- 1. North America
- 2. Europe
- 3. Asia
- 4. Australia and New Zealand
- 5. Latin America
- 6. Middle East and Africa
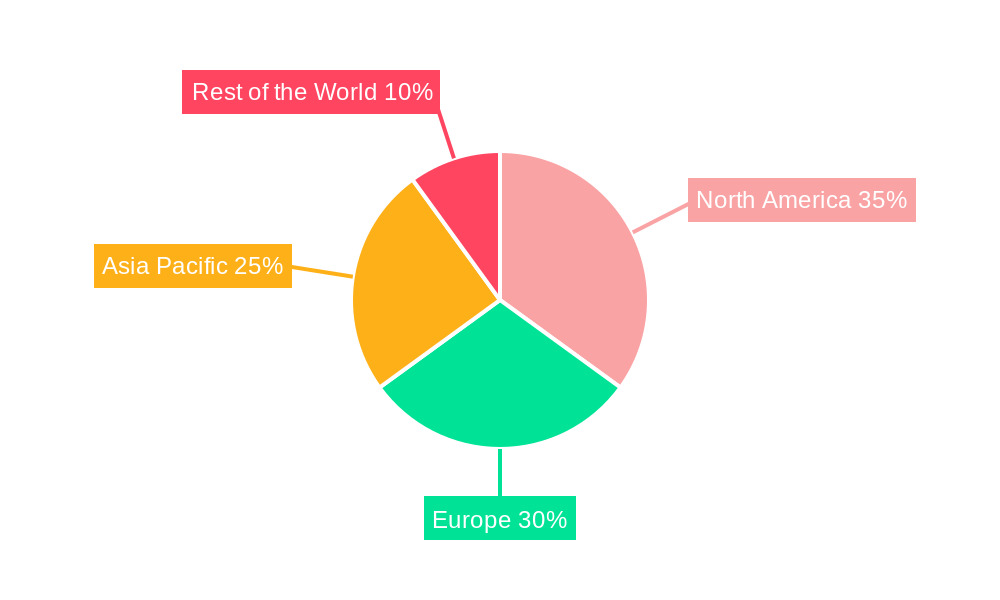
Ethical Labels Industry Regional Market Share
Geographic Coverage of Ethical Labels Industry
Ethical Labels Industry REPORT HIGHLIGHTS
| Aspects | Details |
|---|---|
| Study Period | 2020-2034 |
| Base Year | 2025 |
| Estimated Year | 2026 |
| Forecast Period | 2026-2034 |
| Historical Period | 2020-2025 |
| Growth Rate | CAGR of 7.10% from 2020-2034 |
| Segmentation |
|
Table of Contents
- 1. Introduction
- 1.1. Research Scope
- 1.2. Market Segmentation
- 1.3. Research Objective
- 1.4. Definitions and Assumptions
- 2. Executive Summary
- 2.1. Market Snapshot
- 3. Market Dynamics
- 3.1. Market Drivers
- 3.2. Market Restrains
- 3.3. Market Trends
- 3.4. Market Opportunities
- 4. Market Factor Analysis
- 4.1. Porters Five Forces
- 4.1.1. Bargaining Power of Suppliers
- 4.1.2. Bargaining Power of Buyers
- 4.1.3. Threat of New Entrants
- 4.1.4. Threat of Substitutes
- 4.1.5. Competitive Rivalry
- 4.2. PESTEL analysis
- 4.3. BCG Analysis
- 4.3.1. Stars (High Growth, High Market Share)
- 4.3.2. Cash Cows (Low Growth, High Market Share)
- 4.3.3. Question Mark (High Growth, Low Market Share)
- 4.3.4. Dogs (Low Growth, Low Market Share)
- 4.4. Ansoff Matrix Analysis
- 4.5. Supply Chain Analysis
- 4.6. Regulatory Landscape
- 4.7. Current Market Potential and Opportunity Assessment (TAM–SAM–SOM Framework)
- 4.8. PRI Analyst Note
- 4.1. Porters Five Forces
- 5. Market Analysis, Insights and Forecast 2021-2033
- 5.1. Market Analysis, Insights and Forecast - by Label Type
- 5.1.1. Halal
- 5.1.2. Organic
- 5.1.3. Clean
- 5.1.4. Sustainability and Fairtrade labels
- 5.1.5. Animal Welfare Labels
- 5.1.6. Vegan Labels
- 5.1.7. Other Label Types
- 5.2. Market Analysis, Insights and Forecast - by Product Type
- 5.2.1. Food
- 5.2.2. Beverages
- 5.3. Market Analysis, Insights and Forecast - by Distribution Channel
- 5.3.1. Offline
- 5.3.2. Online
- 5.4. Market Analysis, Insights and Forecast - by Region
- 5.4.1. North America
- 5.4.2. Europe
- 5.4.3. Asia
- 5.4.4. Australia and New Zealand
- 5.4.5. Latin America
- 5.4.6. Middle East and Africa
- 5.1. Market Analysis, Insights and Forecast - by Label Type
- 6. Global Ethical Labels Industry Analysis, Insights and Forecast, 2021-2033
- 6.1. Market Analysis, Insights and Forecast - by Label Type
- 6.1.1. Halal
- 6.1.2. Organic
- 6.1.3. Clean
- 6.1.4. Sustainability and Fairtrade labels
- 6.1.5. Animal Welfare Labels
- 6.1.6. Vegan Labels
- 6.1.7. Other Label Types
- 6.2. Market Analysis, Insights and Forecast - by Product Type
- 6.2.1. Food
- 6.2.2. Beverages
- 6.3. Market Analysis, Insights and Forecast - by Distribution Channel
- 6.3.1. Offline
- 6.3.2. Online
- 6.1. Market Analysis, Insights and Forecast - by Label Type
- 7. North America Ethical Labels Industry Analysis, Insights and Forecast, 2020-2032
- 7.1. Market Analysis, Insights and Forecast - by Label Type
- 7.1.1. Halal
- 7.1.2. Organic
- 7.1.3. Clean
- 7.1.4. Sustainability and Fairtrade labels
- 7.1.5. Animal Welfare Labels
- 7.1.6. Vegan Labels
- 7.1.7. Other Label Types
- 7.2. Market Analysis, Insights and Forecast - by Product Type
- 7.2.1. Food
- 7.2.2. Beverages
- 7.3. Market Analysis, Insights and Forecast - by Distribution Channel
- 7.3.1. Offline
- 7.3.2. Online
- 7.1. Market Analysis, Insights and Forecast - by Label Type
- 8. Europe Ethical Labels Industry Analysis, Insights and Forecast, 2020-2032
- 8.1. Market Analysis, Insights and Forecast - by Label Type
- 8.1.1. Halal
- 8.1.2. Organic
- 8.1.3. Clean
- 8.1.4. Sustainability and Fairtrade labels
- 8.1.5. Animal Welfare Labels
- 8.1.6. Vegan Labels
- 8.1.7. Other Label Types
- 8.2. Market Analysis, Insights and Forecast - by Product Type
- 8.2.1. Food
- 8.2.2. Beverages
- 8.3. Market Analysis, Insights and Forecast - by Distribution Channel
- 8.3.1. Offline
- 8.3.2. Online
- 8.1. Market Analysis, Insights and Forecast - by Label Type
- 9. Asia Ethical Labels Industry Analysis, Insights and Forecast, 2020-2032
- 9.1. Market Analysis, Insights and Forecast - by Label Type
- 9.1.1. Halal
- 9.1.2. Organic
- 9.1.3. Clean
- 9.1.4. Sustainability and Fairtrade labels
- 9.1.5. Animal Welfare Labels
- 9.1.6. Vegan Labels
- 9.1.7. Other Label Types
- 9.2. Market Analysis, Insights and Forecast - by Product Type
- 9.2.1. Food
- 9.2.2. Beverages
- 9.3. Market Analysis, Insights and Forecast - by Distribution Channel
- 9.3.1. Offline
- 9.3.2. Online
- 9.1. Market Analysis, Insights and Forecast - by Label Type
- 10. Australia and New Zealand Ethical Labels Industry Analysis, Insights and Forecast, 2020-2032
- 10.1. Market Analysis, Insights and Forecast - by Label Type
- 10.1.1. Halal
- 10.1.2. Organic
- 10.1.3. Clean
- 10.1.4. Sustainability and Fairtrade labels
- 10.1.5. Animal Welfare Labels
- 10.1.6. Vegan Labels
- 10.1.7. Other Label Types
- 10.2. Market Analysis, Insights and Forecast - by Product Type
- 10.2.1. Food
- 10.2.2. Beverages
- 10.3. Market Analysis, Insights and Forecast - by Distribution Channel
- 10.3.1. Offline
- 10.3.2. Online
- 10.1. Market Analysis, Insights and Forecast - by Label Type
- 11. Latin America Ethical Labels Industry Analysis, Insights and Forecast, 2020-2032
- 11.1. Market Analysis, Insights and Forecast - by Label Type
- 11.1.1. Halal
- 11.1.2. Organic
- 11.1.3. Clean
- 11.1.4. Sustainability and Fairtrade labels
- 11.1.5. Animal Welfare Labels
- 11.1.6. Vegan Labels
- 11.1.7. Other Label Types
- 11.2. Market Analysis, Insights and Forecast - by Product Type
- 11.2.1. Food
- 11.2.2. Beverages
- 11.3. Market Analysis, Insights and Forecast - by Distribution Channel
- 11.3.1. Offline
- 11.3.2. Online
- 11.1. Market Analysis, Insights and Forecast - by Label Type
- 12. Middle East and Africa Ethical Labels Industry Analysis, Insights and Forecast, 2020-2032
- 12.1. Market Analysis, Insights and Forecast - by Label Type
- 12.1.1. Halal
- 12.1.2. Organic
- 12.1.3. Clean
- 12.1.4. Sustainability and Fairtrade labels
- 12.1.5. Animal Welfare Labels
- 12.1.6. Vegan Labels
- 12.1.7. Other Label Types
- 12.2. Market Analysis, Insights and Forecast - by Product Type
- 12.2.1. Food
- 12.2.2. Beverages
- 12.3. Market Analysis, Insights and Forecast - by Distribution Channel
- 12.3.1. Offline
- 12.3.2. Online
- 12.1. Market Analysis, Insights and Forecast - by Label Type
- 13. Competitive Analysis
- 13.1. Company Profiles
- 13.1.1 PepsiCo Inc
- 13.1.1.1. Company Overview
- 13.1.1.2. Products
- 13.1.1.3. Company Financials
- 13.1.1.4. SWOT Analysis
- 13.1.2 Ingredion Incorporated*List Not Exhaustive
- 13.1.2.1. Company Overview
- 13.1.2.2. Products
- 13.1.2.3. Company Financials
- 13.1.2.4. SWOT Analysis
- 13.1.3 Koninklijke DSM N V
- 13.1.3.1. Company Overview
- 13.1.3.2. Products
- 13.1.3.3. Company Financials
- 13.1.3.4. SWOT Analysis
- 13.1.4 The Kraft Heinz Company
- 13.1.4.1. Company Overview
- 13.1.4.2. Products
- 13.1.4.3. Company Financials
- 13.1.4.4. SWOT Analysis
- 13.1.5 Kerry Group PLC
- 13.1.5.1. Company Overview
- 13.1.5.2. Products
- 13.1.5.3. Company Financials
- 13.1.5.4. SWOT Analysis
- 13.1.6 Cargill Inc
- 13.1.6.1. Company Overview
- 13.1.6.2. Products
- 13.1.6.3. Company Financials
- 13.1.6.4. SWOT Analysis
- 13.1.7 Go Macro LLC
- 13.1.7.1. Company Overview
- 13.1.7.2. Products
- 13.1.7.3. Company Financials
- 13.1.7.4. SWOT Analysis
- 13.1.8 Archer-Daniels-Midland Company
- 13.1.8.1. Company Overview
- 13.1.8.2. Products
- 13.1.8.3. Company Financials
- 13.1.8.4. SWOT Analysis
- 13.1.9 Garden of Life (Nestlé S A )
- 13.1.9.1. Company Overview
- 13.1.9.2. Products
- 13.1.9.3. Company Financials
- 13.1.9.4. SWOT Analysis
- 13.1.10 The Hershey Company
- 13.1.10.1. Company Overview
- 13.1.10.2. Products
- 13.1.10.3. Company Financials
- 13.1.10.4. SWOT Analysis
- 13.1.1 PepsiCo Inc
- 13.2. Market Entropy
- 13.2.1 Company's Key Areas Served
- 13.2.2 Recent Developments
- 13.3. Company Market Share Analysis 2025
- 13.3.1 Top 5 Companies Market Share Analysis
- 13.3.2 Top 3 Companies Market Share Analysis
- 13.4. List of Potential Customers
- 14. Research Methodology
List of Figures
- Figure 1: Global Ethical Labels Industry Revenue Breakdown (Million, %) by Region 2025 & 2033
- Figure 2: North America Ethical Labels Industry Revenue (Million), by Label Type 2025 & 2033
- Figure 3: North America Ethical Labels Industry Revenue Share (%), by Label Type 2025 & 2033
- Figure 4: North America Ethical Labels Industry Revenue (Million), by Product Type 2025 & 2033
- Figure 5: North America Ethical Labels Industry Revenue Share (%), by Product Type 2025 & 2033
- Figure 6: North America Ethical Labels Industry Revenue (Million), by Distribution Channel 2025 & 2033
- Figure 7: North America Ethical Labels Industry Revenue Share (%), by Distribution Channel 2025 & 2033
- Figure 8: North America Ethical Labels Industry Revenue (Million), by Country 2025 & 2033
- Figure 9: North America Ethical Labels Industry Revenue Share (%), by Country 2025 & 2033
- Figure 10: Europe Ethical Labels Industry Revenue (Million), by Label Type 2025 & 2033
- Figure 11: Europe Ethical Labels Industry Revenue Share (%), by Label Type 2025 & 2033
- Figure 12: Europe Ethical Labels Industry Revenue (Million), by Product Type 2025 & 2033
- Figure 13: Europe Ethical Labels Industry Revenue Share (%), by Product Type 2025 & 2033
- Figure 14: Europe Ethical Labels Industry Revenue (Million), by Distribution Channel 2025 & 2033
- Figure 15: Europe Ethical Labels Industry Revenue Share (%), by Distribution Channel 2025 & 2033
- Figure 16: Europe Ethical Labels Industry Revenue (Million), by Country 2025 & 2033
- Figure 17: Europe Ethical Labels Industry Revenue Share (%), by Country 2025 & 2033
- Figure 18: Asia Ethical Labels Industry Revenue (Million), by Label Type 2025 & 2033
- Figure 19: Asia Ethical Labels Industry Revenue Share (%), by Label Type 2025 & 2033
- Figure 20: Asia Ethical Labels Industry Revenue (Million), by Product Type 2025 & 2033
- Figure 21: Asia Ethical Labels Industry Revenue Share (%), by Product Type 2025 & 2033
- Figure 22: Asia Ethical Labels Industry Revenue (Million), by Distribution Channel 2025 & 2033
- Figure 23: Asia Ethical Labels Industry Revenue Share (%), by Distribution Channel 2025 & 2033
- Figure 24: Asia Ethical Labels Industry Revenue (Million), by Country 2025 & 2033
- Figure 25: Asia Ethical Labels Industry Revenue Share (%), by Country 2025 & 2033
- Figure 26: Australia and New Zealand Ethical Labels Industry Revenue (Million), by Label Type 2025 & 2033
- Figure 27: Australia and New Zealand Ethical Labels Industry Revenue Share (%), by Label Type 2025 & 2033
- Figure 28: Australia and New Zealand Ethical Labels Industry Revenue (Million), by Product Type 2025 & 2033
- Figure 29: Australia and New Zealand Ethical Labels Industry Revenue Share (%), by Product Type 2025 & 2033
- Figure 30: Australia and New Zealand Ethical Labels Industry Revenue (Million), by Distribution Channel 2025 & 2033
- Figure 31: Australia and New Zealand Ethical Labels Industry Revenue Share (%), by Distribution Channel 2025 & 2033
- Figure 32: Australia and New Zealand Ethical Labels Industry Revenue (Million), by Country 2025 & 2033
- Figure 33: Australia and New Zealand Ethical Labels Industry Revenue Share (%), by Country 2025 & 2033
- Figure 34: Latin America Ethical Labels Industry Revenue (Million), by Label Type 2025 & 2033
- Figure 35: Latin America Ethical Labels Industry Revenue Share (%), by Label Type 2025 & 2033
- Figure 36: Latin America Ethical Labels Industry Revenue (Million), by Product Type 2025 & 2033
- Figure 37: Latin America Ethical Labels Industry Revenue Share (%), by Product Type 2025 & 2033
- Figure 38: Latin America Ethical Labels Industry Revenue (Million), by Distribution Channel 2025 & 2033
- Figure 39: Latin America Ethical Labels Industry Revenue Share (%), by Distribution Channel 2025 & 2033
- Figure 40: Latin America Ethical Labels Industry Revenue (Million), by Country 2025 & 2033
- Figure 41: Latin America Ethical Labels Industry Revenue Share (%), by Country 2025 & 2033
- Figure 42: Middle East and Africa Ethical Labels Industry Revenue (Million), by Label Type 2025 & 2033
- Figure 43: Middle East and Africa Ethical Labels Industry Revenue Share (%), by Label Type 2025 & 2033
- Figure 44: Middle East and Africa Ethical Labels Industry Revenue (Million), by Product Type 2025 & 2033
- Figure 45: Middle East and Africa Ethical Labels Industry Revenue Share (%), by Product Type 2025 & 2033
- Figure 46: Middle East and Africa Ethical Labels Industry Revenue (Million), by Distribution Channel 2025 & 2033
- Figure 47: Middle East and Africa Ethical Labels Industry Revenue Share (%), by Distribution Channel 2025 & 2033
- Figure 48: Middle East and Africa Ethical Labels Industry Revenue (Million), by Country 2025 & 2033
- Figure 49: Middle East and Africa Ethical Labels Industry Revenue Share (%), by Country 2025 & 2033
List of Tables
- Table 1: Global Ethical Labels Industry Revenue Million Forecast, by Label Type 2020 & 2033
- Table 2: Global Ethical Labels Industry Revenue Million Forecast, by Product Type 2020 & 2033
- Table 3: Global Ethical Labels Industry Revenue Million Forecast, by Distribution Channel 2020 & 2033
- Table 4: Global Ethical Labels Industry Revenue Million Forecast, by Region 2020 & 2033
- Table 5: Global Ethical Labels Industry Revenue Million Forecast, by Label Type 2020 & 2033
- Table 6: Global Ethical Labels Industry Revenue Million Forecast, by Product Type 2020 & 2033
- Table 7: Global Ethical Labels Industry Revenue Million Forecast, by Distribution Channel 2020 & 2033
- Table 8: Global Ethical Labels Industry Revenue Million Forecast, by Country 2020 & 2033
- Table 9: Global Ethical Labels Industry Revenue Million Forecast, by Label Type 2020 & 2033
- Table 10: Global Ethical Labels Industry Revenue Million Forecast, by Product Type 2020 & 2033
- Table 11: Global Ethical Labels Industry Revenue Million Forecast, by Distribution Channel 2020 & 2033
- Table 12: Global Ethical Labels Industry Revenue Million Forecast, by Country 2020 & 2033
- Table 13: Global Ethical Labels Industry Revenue Million Forecast, by Label Type 2020 & 2033
- Table 14: Global Ethical Labels Industry Revenue Million Forecast, by Product Type 2020 & 2033
- Table 15: Global Ethical Labels Industry Revenue Million Forecast, by Distribution Channel 2020 & 2033
- Table 16: Global Ethical Labels Industry Revenue Million Forecast, by Country 2020 & 2033
- Table 17: Global Ethical Labels Industry Revenue Million Forecast, by Label Type 2020 & 2033
- Table 18: Global Ethical Labels Industry Revenue Million Forecast, by Product Type 2020 & 2033
- Table 19: Global Ethical Labels Industry Revenue Million Forecast, by Distribution Channel 2020 & 2033
- Table 20: Global Ethical Labels Industry Revenue Million Forecast, by Country 2020 & 2033
- Table 21: Global Ethical Labels Industry Revenue Million Forecast, by Label Type 2020 & 2033
- Table 22: Global Ethical Labels Industry Revenue Million Forecast, by Product Type 2020 & 2033
- Table 23: Global Ethical Labels Industry Revenue Million Forecast, by Distribution Channel 2020 & 2033
- Table 24: Global Ethical Labels Industry Revenue Million Forecast, by Country 2020 & 2033
- Table 25: Global Ethical Labels Industry Revenue Million Forecast, by Label Type 2020 & 2033
- Table 26: Global Ethical Labels Industry Revenue Million Forecast, by Product Type 2020 & 2033
- Table 27: Global Ethical Labels Industry Revenue Million Forecast, by Distribution Channel 2020 & 2033
- Table 28: Global Ethical Labels Industry Revenue Million Forecast, by Country 2020 & 2033
Frequently Asked Questions
1. What is the projected Compound Annual Growth Rate (CAGR) of the Ethical Labels Industry?
The projected CAGR is approximately 7.10%.
2. Which companies are prominent players in the Ethical Labels Industry?
Key companies in the market include PepsiCo Inc, Ingredion Incorporated*List Not Exhaustive, Koninklijke DSM N V, The Kraft Heinz Company, Kerry Group PLC, Cargill Inc, Go Macro LLC, Archer-Daniels-Midland Company, Garden of Life (Nestlé S A ), The Hershey Company.
3. What are the main segments of the Ethical Labels Industry?
The market segments include Label Type, Product Type, Distribution Channel.
4. Can you provide details about the market size?
The market size is estimated to be USD 0.94 Million as of 2022.
5. What are some drivers contributing to market growth?
Increased Consumer Conscious toward Health and Ethical Values; Growth due to Online Retailing and CSR Activities; Reduction in Meat Consumption for Environmental Sustainability.
6. What are the notable trends driving market growth?
Beverages To Occupy Highest Market Share.
7. Are there any restraints impacting market growth?
Increasing Competition Among Players.
8. Can you provide examples of recent developments in the market?
September 2023: Maranello launched its ethical label. To obtain the Maranello on Earth label, a product must fulfill one of 4 criteria: a useful, sustainable promotional object that can be recycled and that is biodegradable, or a renewable promotional object that uses fewer materials or eco-designed materials produced using organic and recycled materials. It can also be a promotional object with a low carbon footprint, using locally-produced raw materials and green transport over short distances, or a promotional object with a socially positive contribution, environmentally ethical, using European, national, or even local know-how; using local or international, charity-based, socially responsible or fair-trade manufacture.
9. What pricing options are available for accessing the report?
Pricing options include single-user, multi-user, and enterprise licenses priced at USD 4750, USD 5250, and USD 8750 respectively.
10. Is the market size provided in terms of value or volume?
The market size is provided in terms of value, measured in Million.
11. Are there any specific market keywords associated with the report?
Yes, the market keyword associated with the report is "Ethical Labels Industry," which aids in identifying and referencing the specific market segment covered.
12. How do I determine which pricing option suits my needs best?
The pricing options vary based on user requirements and access needs. Individual users may opt for single-user licenses, while businesses requiring broader access may choose multi-user or enterprise licenses for cost-effective access to the report.
13. Are there any additional resources or data provided in the Ethical Labels Industry report?
While the report offers comprehensive insights, it's advisable to review the specific contents or supplementary materials provided to ascertain if additional resources or data are available.
14. How can I stay updated on further developments or reports in the Ethical Labels Industry?
To stay informed about further developments, trends, and reports in the Ethical Labels Industry, consider subscribing to industry newsletters, following relevant companies and organizations, or regularly checking reputable industry news sources and publications.
Methodology
Step 1 - Identification of Relevant Samples Size from Population Database


Step 2 - Approaches for Defining Global Market Size (Value, Volume* & Price*)

Note*: In applicable scenarios
Step 3 - Data Sources
Primary Research
- Web Analytics
- Survey Reports
- Research Institute
- Latest Research Reports
- Opinion Leaders
Secondary Research
- Annual Reports
- White Paper
- Latest Press Release
- Industry Association
- Paid Database
- Investor Presentations

Step 4 - Data Triangulation
Involves using different sources of information in order to increase the validity of a study
These sources are likely to be stakeholders in a program - participants, other researchers, program staff, other community members, and so on.
Then we put all data in single framework & apply various statistical tools to find out the dynamic on the market.
During the analysis stage, feedback from the stakeholder groups would be compared to determine areas of agreement as well as areas of divergence