
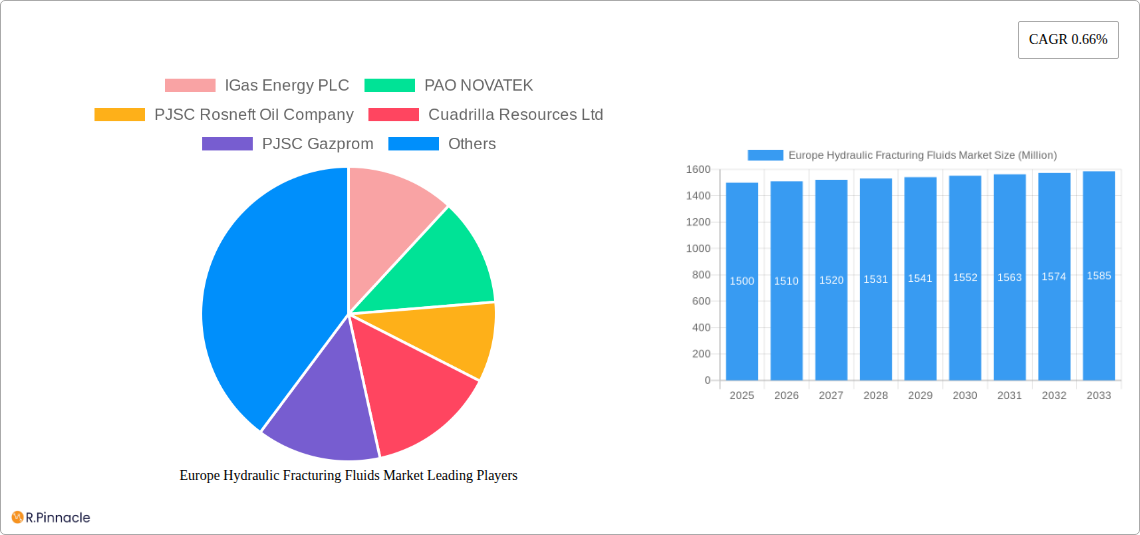
Key Insights
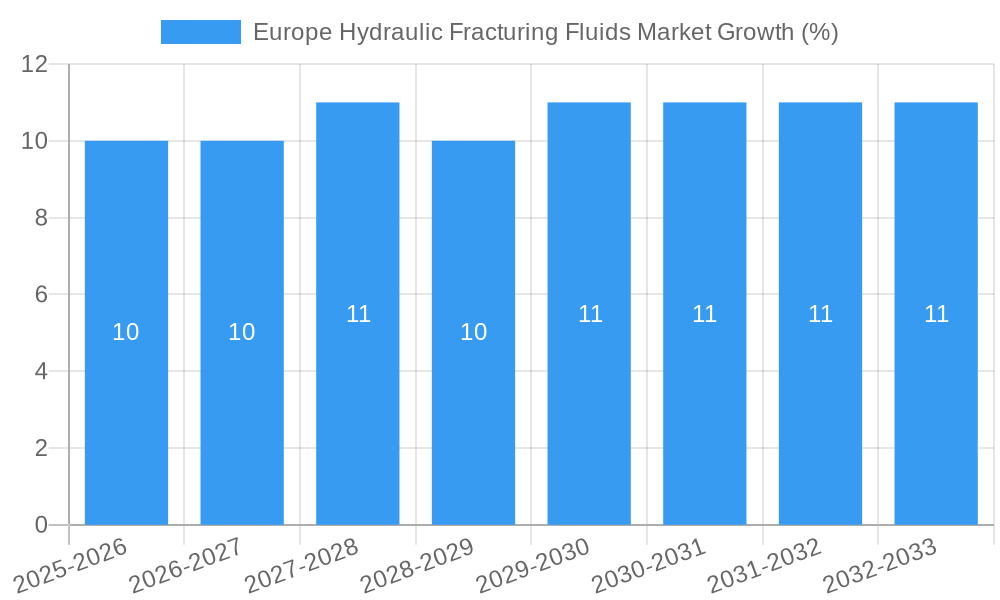
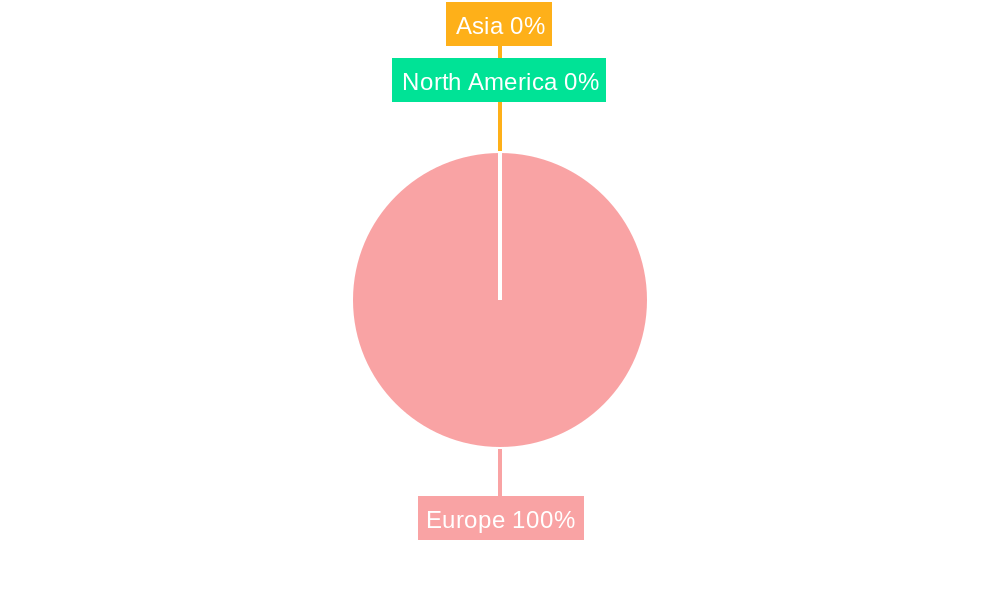
The European hydraulic fracturing fluids market, while exhibiting a relatively modest CAGR of 0.66%, presents a nuanced picture of growth and challenges. The market size in 2025 is estimated at €1.5 billion, based on a reasonable extrapolation considering the industry's historical performance and projected energy demands. Several factors contribute to this moderate growth. Firstly, the increasing demand for natural gas in Europe, driven by energy security concerns and the transition away from coal, fuels demand for hydraulic fracturing fluids used in unconventional gas extraction. However, this demand is tempered by stricter environmental regulations and public opposition to fracking in several European countries. The market segmentation reveals that slick water-based fluids dominate due to their cost-effectiveness and relatively lower environmental impact compared to oil-based fluids. However, advancements in foam-based and gelled oil-based fluids are anticipated to drive gradual shifts in market share as these options offer improved performance characteristics in specific geological formations. Furthermore, the prevalence of horizontal well drilling contributes to higher fluid consumption, boosting the overall market size. Major players like Schlumberger, Halliburton, and Baker Hughes, along with regional operators like IGas Energy and PAO NOVATEK, are heavily involved, shaping the competitive landscape through technological innovations and strategic partnerships. The geographical distribution sees the UK, Germany, and France as key markets due to their established shale gas resources and relatively advanced exploration activities. Despite the challenges, the long-term outlook suggests continued, though measured, growth driven by Europe's evolving energy mix and ongoing technological advancements in hydraulic fracturing techniques.
The forecast period (2025-2033) anticipates incremental gains, largely attributed to technological improvements enhancing operational efficiency and mitigating environmental concerns. While the restraints, particularly environmental regulations and public perception, will continue to impact the market's expansion rate, the ongoing demand for natural gas is expected to counterbalance these challenges to some degree. Furthermore, the potential expansion of fracking activities into new areas and the development of more environmentally friendly fracturing fluids are factors that could stimulate more rapid market growth towards the end of the forecast period. Therefore, while the CAGR remains modest, the European hydraulic fracturing fluids market exhibits resilience and significant opportunity for companies capable of adapting to evolving regulatory landscapes and technological advancements.
Europe Hydraulic Fracturing Fluids Market: A Comprehensive Report (2019-2033)
This comprehensive report provides an in-depth analysis of the Europe Hydraulic Fracturing Fluids Market, offering invaluable insights for industry professionals, investors, and strategic decision-makers. With a detailed study period spanning from 2019 to 2033 (Base Year: 2025, Estimated Year: 2025, Forecast Period: 2025-2033, Historical Period: 2019-2024), this report unveils the market's current state and future trajectory. The report covers key segments including resource type (Oil, Natural Gas), fluid type (Slick Water-based Fluid, Foam-based Fluid, Gelled Oil-based Fluid, Other Fluid Types), and well type (Horizontal, Vertical). Leading players like IGas Energy PLC, PAO NOVATEK, PJSC Rosneft Oil Company, Cuadrilla Resources Ltd, PJSC Gazprom, Equinor ASA, Schlumberger, Halliburton, Baker Hughes, and Weatherford International are analyzed, amongst others. The market is projected to reach xx Million by 2033, exhibiting a significant CAGR.
Europe Hydraulic Fracturing Fluids Market Market Structure & Innovation Trends
This section analyzes the competitive landscape, innovation drivers, and regulatory influences shaping the European hydraulic fracturing fluids market. Market concentration is assessed, revealing the dominance of major players and their respective market shares. The report further examines the impact of mergers and acquisitions (M&A) activities, providing details on notable deals and their financial implications. The total value of M&A deals in the past five years is estimated at xx Million.
- Market Concentration: The market is moderately concentrated, with the top five players holding approximately xx% of the market share in 2024.
- Innovation Drivers: Technological advancements in fluid formulations, focusing on enhanced efficiency and reduced environmental impact, are key drivers. Furthermore, the increasing demand for shale gas and oil extraction is fueling innovation in fluid technology.
- Regulatory Frameworks: Stringent environmental regulations and safety standards are influencing product development and adoption. Variations in regulations across European countries contribute to market complexity.
- Product Substitutes: The emergence of alternative well completion techniques presents a competitive challenge, impacting market growth.
- End-User Demographics: The primary end-users are oil and gas exploration and production companies, with varying demand based on regional exploration activities.
- M&A Activities: Consolidation through mergers and acquisitions is anticipated to continue, leading to increased market concentration and driving innovation.
Europe Hydraulic Fracturing Fluids Market Market Dynamics & Trends
This section explores the factors driving market growth, including technological advancements, evolving consumer preferences, and competitive dynamics. The market is expected to witness significant growth due to increasing energy demand and the exploration of unconventional resources. Technological disruptions, such as the development of environmentally friendly fluids and advanced fracturing techniques, are reshaping the market landscape.
The projected CAGR for the forecast period (2025-2033) is estimated at xx%. This growth is primarily fueled by:
- Increased exploration and production of shale gas and oil in key European regions.
- Technological advancements leading to improved efficiency and reduced environmental impact of hydraulic fracturing.
- Growing demand for energy to support economic growth in Europe.
- Investments in infrastructure to support hydraulic fracturing operations.
Dominant Regions & Segments in Europe Hydraulic Fracturing Fluids Market
This section identifies the leading regions and segments within the European hydraulic fracturing fluids market. Analysis reveals that [Specific Country/Region – e.g., Norway or the UK] holds the largest market share, driven by [Specific reasons – e.g., substantial shale gas reserves or supportive government policies].
Key Drivers for Dominant Regions:
- [Region/Country]: [Specific reasons for dominance, e.g., established shale gas production, robust infrastructure, supportive government policies]
- [Region/Country]: [Specific reasons for dominance, e.g., high oil and gas production, favorable regulatory environment]
Dominant Segments:
- Resource Type: Natural gas currently holds a larger market share than oil due to the increased focus on shale gas extraction in specific European regions.
- Fluid Type: Slick water-based fluids dominate the market due to their cost-effectiveness. However, increasing environmental concerns are driving growth in the demand for more environmentally friendly fluid types.
- Well Type: Horizontal wells are the predominant well type, reflecting the preference for efficient shale gas extraction.
Europe Hydraulic Fracturing Fluids Market Product Innovations
The market is witnessing continuous innovation in fluid formulations, focusing on enhanced performance and environmental considerations. Companies are developing fluids with improved viscosity, proppant carrying capacity, and reduced environmental impact. These advancements cater to the demand for efficient and environmentally responsible shale gas and oil extraction. Technological advancements in fracturing techniques, such as the use of hybrid fluids, are also contributing to market innovation.
Report Scope & Segmentation Analysis
This report provides a comprehensive segmentation of the Europe Hydraulic Fracturing Fluids Market based on resource type, fluid type, and well type. Each segment is analyzed in terms of its market size, growth potential, and competitive landscape.
Resource Type: The market is segmented into Oil and Natural Gas, with projections for individual segment growth during the forecast period.
Fluid Type: The market is segmented into Slick Water-based Fluid, Foam-based Fluid, Gelled Oil-based Fluid, and Other Fluid Types. Market size and growth projections for each segment are detailed within the report.
Well Type: The market is segmented into Horizontal and Vertical wells. Growth projections and competitive dynamics are analyzed for each segment.
Key Drivers of Europe Hydraulic Fracturing Fluids Market Growth
Growth in the Europe Hydraulic Fracturing Fluids market is propelled by several factors: the increasing demand for natural gas and oil, the expansion of shale gas exploration and production activities, and technological advancements leading to improved efficiency and reduced environmental impacts of hydraulic fracturing. Favorable government policies in certain European countries further stimulate market expansion.
Challenges in the Europe Hydraulic Fracturing Fluids Market Sector
The Europe Hydraulic Fracturing Fluids Market faces challenges, including stringent environmental regulations, potential supply chain disruptions, and intense competition. These factors can impact the cost and availability of fluids and influence overall market growth. Public perception and concerns regarding the environmental impact of hydraulic fracturing also pose a significant challenge.
Emerging Opportunities in Europe Hydraulic Fracturing Fluids Market
Emerging opportunities exist in developing environmentally friendly fluids, expanding into new geographical regions with shale gas potential, and optimizing fracturing techniques for improved efficiency. Furthermore, technological advancements in fluid recycling and waste management offer potential avenues for growth.
Leading Players in the Europe Hydraulic Fracturing Fluids Market Market
- IGas Energy PLC
- PAO NOVATEK
- PJSC Rosneft Oil Company
- Cuadrilla Resources Ltd
- PJSC Gazprom
- Equinor ASA
- Schlumberger
- Halliburton
- Baker Hughes
- Weatherford International
Key Developments in Europe Hydraulic Fracturing Fluids Market Industry
- September 2022: Gazprom Neft and Mekamineft announced plans to test the first Russian hydraulic fracturing fleet in KhMAO-Yugra fields. This signifies a push towards domestic technology adoption and potential cost reductions.
Future Outlook for Europe Hydraulic Fracturing Fluids Market Market
The future outlook for the Europe Hydraulic Fracturing Fluids Market is positive, driven by ongoing exploration activities, technological advancements, and government support in specific regions. Strategic partnerships and investments in research and development will play a crucial role in shaping the market's future trajectory. The market is poised for sustained growth, driven by factors such as increasing energy demand and the continued exploration and development of unconventional oil and gas reserves.
Europe Hydraulic Fracturing Fluids Market Segmentation
-
1. Resource Type
- 1.1. Oil
- 1.2. Natural Gas
-
2. Fluid Type
- 2.1. Slick Water-based Fluid
- 2.2. Foam-based Fluid
- 2.3. Gelled Oil-based Fluid
- 2.4. Other Fluid Types
-
3. Well Type
- 3.1. Horizontal
- 3.2. Vertical
Europe Hydraulic Fracturing Fluids Market Segmentation By Geography
- 1. United Kingdom
- 2. Russia
- 3. Norway
- 4. Rest of Europe
Europe Hydraulic Fracturing Fluids Market REPORT HIGHLIGHTS
| Aspects | Details |
|---|---|
| Study Period | 2019-2033 |
| Base Year | 2024 |
| Estimated Year | 2025 |
| Forecast Period | 2025-2033 |
| Historical Period | 2019-2024 |
| Growth Rate | CAGR of 0.66% from 2019-2033 |
| Segmentation |
|
Table of Contents
- 1. Introduction
- 1.1. Research Scope
- 1.2. Market Segmentation
- 1.3. Research Methodology
- 1.4. Definitions and Assumptions
- 2. Executive Summary
- 2.1. Introduction
- 3. Market Dynamics
- 3.1. Introduction
- 3.2. Market Drivers
- 3.2.1. 4.; Growing Demand for Solar Energy4.; Reducing Solar Panel Costs and Associated Components for Solar Projects
- 3.3. Market Restrains
- 3.3.1. 4.; Availability of Pure Silicon to make Solar PV Cells
- 3.4. Market Trends
- 3.4.1. Natural Gas to Witness Significant Growth
- 4. Market Factor Analysis
- 4.1. Porters Five Forces
- 4.2. Supply/Value Chain
- 4.3. PESTEL analysis
- 4.4. Market Entropy
- 4.5. Patent/Trademark Analysis
- 5. Europe Hydraulic Fracturing Fluids Market Analysis, Insights and Forecast, 2019-2031
- 5.1. Market Analysis, Insights and Forecast - by Resource Type
- 5.1.1. Oil
- 5.1.2. Natural Gas
- 5.2. Market Analysis, Insights and Forecast - by Fluid Type
- 5.2.1. Slick Water-based Fluid
- 5.2.2. Foam-based Fluid
- 5.2.3. Gelled Oil-based Fluid
- 5.2.4. Other Fluid Types
- 5.3. Market Analysis, Insights and Forecast - by Well Type
- 5.3.1. Horizontal
- 5.3.2. Vertical
- 5.4. Market Analysis, Insights and Forecast - by Region
- 5.4.1. United Kingdom
- 5.4.2. Russia
- 5.4.3. Norway
- 5.4.4. Rest of Europe
- 5.1. Market Analysis, Insights and Forecast - by Resource Type
- 6. United Kingdom Europe Hydraulic Fracturing Fluids Market Analysis, Insights and Forecast, 2019-2031
- 6.1. Market Analysis, Insights and Forecast - by Resource Type
- 6.1.1. Oil
- 6.1.2. Natural Gas
- 6.2. Market Analysis, Insights and Forecast - by Fluid Type
- 6.2.1. Slick Water-based Fluid
- 6.2.2. Foam-based Fluid
- 6.2.3. Gelled Oil-based Fluid
- 6.2.4. Other Fluid Types
- 6.3. Market Analysis, Insights and Forecast - by Well Type
- 6.3.1. Horizontal
- 6.3.2. Vertical
- 6.1. Market Analysis, Insights and Forecast - by Resource Type
- 7. Russia Europe Hydraulic Fracturing Fluids Market Analysis, Insights and Forecast, 2019-2031
- 7.1. Market Analysis, Insights and Forecast - by Resource Type
- 7.1.1. Oil
- 7.1.2. Natural Gas
- 7.2. Market Analysis, Insights and Forecast - by Fluid Type
- 7.2.1. Slick Water-based Fluid
- 7.2.2. Foam-based Fluid
- 7.2.3. Gelled Oil-based Fluid
- 7.2.4. Other Fluid Types
- 7.3. Market Analysis, Insights and Forecast - by Well Type
- 7.3.1. Horizontal
- 7.3.2. Vertical
- 7.1. Market Analysis, Insights and Forecast - by Resource Type
- 8. Norway Europe Hydraulic Fracturing Fluids Market Analysis, Insights and Forecast, 2019-2031
- 8.1. Market Analysis, Insights and Forecast - by Resource Type
- 8.1.1. Oil
- 8.1.2. Natural Gas
- 8.2. Market Analysis, Insights and Forecast - by Fluid Type
- 8.2.1. Slick Water-based Fluid
- 8.2.2. Foam-based Fluid
- 8.2.3. Gelled Oil-based Fluid
- 8.2.4. Other Fluid Types
- 8.3. Market Analysis, Insights and Forecast - by Well Type
- 8.3.1. Horizontal
- 8.3.2. Vertical
- 8.1. Market Analysis, Insights and Forecast - by Resource Type
- 9. Rest of Europe Europe Hydraulic Fracturing Fluids Market Analysis, Insights and Forecast, 2019-2031
- 9.1. Market Analysis, Insights and Forecast - by Resource Type
- 9.1.1. Oil
- 9.1.2. Natural Gas
- 9.2. Market Analysis, Insights and Forecast - by Fluid Type
- 9.2.1. Slick Water-based Fluid
- 9.2.2. Foam-based Fluid
- 9.2.3. Gelled Oil-based Fluid
- 9.2.4. Other Fluid Types
- 9.3. Market Analysis, Insights and Forecast - by Well Type
- 9.3.1. Horizontal
- 9.3.2. Vertical
- 9.1. Market Analysis, Insights and Forecast - by Resource Type
- 10. Germany Europe Hydraulic Fracturing Fluids Market Analysis, Insights and Forecast, 2019-2031
- 11. France Europe Hydraulic Fracturing Fluids Market Analysis, Insights and Forecast, 2019-2031
- 12. Italy Europe Hydraulic Fracturing Fluids Market Analysis, Insights and Forecast, 2019-2031
- 13. United Kingdom Europe Hydraulic Fracturing Fluids Market Analysis, Insights and Forecast, 2019-2031
- 14. Netherlands Europe Hydraulic Fracturing Fluids Market Analysis, Insights and Forecast, 2019-2031
- 15. Sweden Europe Hydraulic Fracturing Fluids Market Analysis, Insights and Forecast, 2019-2031
- 16. Rest of Europe Europe Hydraulic Fracturing Fluids Market Analysis, Insights and Forecast, 2019-2031
- 17. Competitive Analysis
- 17.1. Market Share Analysis 2024
- 17.2. Company Profiles
- 17.2.1 IGas Energy PLC
- 17.2.1.1. Overview
- 17.2.1.2. Products
- 17.2.1.3. SWOT Analysis
- 17.2.1.4. Recent Developments
- 17.2.1.5. Financials (Based on Availability)
- 17.2.2 PAO NOVATEK
- 17.2.2.1. Overview
- 17.2.2.2. Products
- 17.2.2.3. SWOT Analysis
- 17.2.2.4. Recent Developments
- 17.2.2.5. Financials (Based on Availability)
- 17.2.3 PJSC Rosneft Oil Company
- 17.2.3.1. Overview
- 17.2.3.2. Products
- 17.2.3.3. SWOT Analysis
- 17.2.3.4. Recent Developments
- 17.2.3.5. Financials (Based on Availability)
- 17.2.4 Cuadrilla Resources Ltd
- 17.2.4.1. Overview
- 17.2.4.2. Products
- 17.2.4.3. SWOT Analysis
- 17.2.4.4. Recent Developments
- 17.2.4.5. Financials (Based on Availability)
- 17.2.5 PJSC Gazprom
- 17.2.5.1. Overview
- 17.2.5.2. Products
- 17.2.5.3. SWOT Analysis
- 17.2.5.4. Recent Developments
- 17.2.5.5. Financials (Based on Availability)
- 17.2.6 Equinor ASA*List Not Exhaustive
- 17.2.6.1. Overview
- 17.2.6.2. Products
- 17.2.6.3. SWOT Analysis
- 17.2.6.4. Recent Developments
- 17.2.6.5. Financials (Based on Availability)
- 17.2.7 Schlumberger
- 17.2.7.1. Overview
- 17.2.7.2. Products
- 17.2.7.3. SWOT Analysis
- 17.2.7.4. Recent Developments
- 17.2.7.5. Financials (Based on Availability)
- 17.2.8 Halliburton
- 17.2.8.1. Overview
- 17.2.8.2. Products
- 17.2.8.3. SWOT Analysis
- 17.2.8.4. Recent Developments
- 17.2.8.5. Financials (Based on Availability)
- 17.2.9 Baker Hughes
- 17.2.9.1. Overview
- 17.2.9.2. Products
- 17.2.9.3. SWOT Analysis
- 17.2.9.4. Recent Developments
- 17.2.9.5. Financials (Based on Availability)
- 17.2.10 Weatherford International
- 17.2.10.1. Overview
- 17.2.10.2. Products
- 17.2.10.3. SWOT Analysis
- 17.2.10.4. Recent Developments
- 17.2.10.5. Financials (Based on Availability)
- 17.2.1 IGas Energy PLC
List of Figures
- Figure 1: Europe Hydraulic Fracturing Fluids Market Revenue Breakdown (Million, %) by Product 2024 & 2032
- Figure 2: Europe Hydraulic Fracturing Fluids Market Share (%) by Company 2024
List of Tables
- Table 1: Europe Hydraulic Fracturing Fluids Market Revenue Million Forecast, by Region 2019 & 2032
- Table 2: Europe Hydraulic Fracturing Fluids Market Volume K Tons Forecast, by Region 2019 & 2032
- Table 3: Europe Hydraulic Fracturing Fluids Market Revenue Million Forecast, by Resource Type 2019 & 2032
- Table 4: Europe Hydraulic Fracturing Fluids Market Volume K Tons Forecast, by Resource Type 2019 & 2032
- Table 5: Europe Hydraulic Fracturing Fluids Market Revenue Million Forecast, by Fluid Type 2019 & 2032
- Table 6: Europe Hydraulic Fracturing Fluids Market Volume K Tons Forecast, by Fluid Type 2019 & 2032
- Table 7: Europe Hydraulic Fracturing Fluids Market Revenue Million Forecast, by Well Type 2019 & 2032
- Table 8: Europe Hydraulic Fracturing Fluids Market Volume K Tons Forecast, by Well Type 2019 & 2032
- Table 9: Europe Hydraulic Fracturing Fluids Market Revenue Million Forecast, by Region 2019 & 2032
- Table 10: Europe Hydraulic Fracturing Fluids Market Volume K Tons Forecast, by Region 2019 & 2032
- Table 11: Europe Hydraulic Fracturing Fluids Market Revenue Million Forecast, by Country 2019 & 2032
- Table 12: Europe Hydraulic Fracturing Fluids Market Volume K Tons Forecast, by Country 2019 & 2032
- Table 13: Germany Europe Hydraulic Fracturing Fluids Market Revenue (Million) Forecast, by Application 2019 & 2032
- Table 14: Germany Europe Hydraulic Fracturing Fluids Market Volume (K Tons) Forecast, by Application 2019 & 2032
- Table 15: France Europe Hydraulic Fracturing Fluids Market Revenue (Million) Forecast, by Application 2019 & 2032
- Table 16: France Europe Hydraulic Fracturing Fluids Market Volume (K Tons) Forecast, by Application 2019 & 2032
- Table 17: Italy Europe Hydraulic Fracturing Fluids Market Revenue (Million) Forecast, by Application 2019 & 2032
- Table 18: Italy Europe Hydraulic Fracturing Fluids Market Volume (K Tons) Forecast, by Application 2019 & 2032
- Table 19: United Kingdom Europe Hydraulic Fracturing Fluids Market Revenue (Million) Forecast, by Application 2019 & 2032
- Table 20: United Kingdom Europe Hydraulic Fracturing Fluids Market Volume (K Tons) Forecast, by Application 2019 & 2032
- Table 21: Netherlands Europe Hydraulic Fracturing Fluids Market Revenue (Million) Forecast, by Application 2019 & 2032
- Table 22: Netherlands Europe Hydraulic Fracturing Fluids Market Volume (K Tons) Forecast, by Application 2019 & 2032
- Table 23: Sweden Europe Hydraulic Fracturing Fluids Market Revenue (Million) Forecast, by Application 2019 & 2032
- Table 24: Sweden Europe Hydraulic Fracturing Fluids Market Volume (K Tons) Forecast, by Application 2019 & 2032
- Table 25: Rest of Europe Europe Hydraulic Fracturing Fluids Market Revenue (Million) Forecast, by Application 2019 & 2032
- Table 26: Rest of Europe Europe Hydraulic Fracturing Fluids Market Volume (K Tons) Forecast, by Application 2019 & 2032
- Table 27: Europe Hydraulic Fracturing Fluids Market Revenue Million Forecast, by Resource Type 2019 & 2032
- Table 28: Europe Hydraulic Fracturing Fluids Market Volume K Tons Forecast, by Resource Type 2019 & 2032
- Table 29: Europe Hydraulic Fracturing Fluids Market Revenue Million Forecast, by Fluid Type 2019 & 2032
- Table 30: Europe Hydraulic Fracturing Fluids Market Volume K Tons Forecast, by Fluid Type 2019 & 2032
- Table 31: Europe Hydraulic Fracturing Fluids Market Revenue Million Forecast, by Well Type 2019 & 2032
- Table 32: Europe Hydraulic Fracturing Fluids Market Volume K Tons Forecast, by Well Type 2019 & 2032
- Table 33: Europe Hydraulic Fracturing Fluids Market Revenue Million Forecast, by Country 2019 & 2032
- Table 34: Europe Hydraulic Fracturing Fluids Market Volume K Tons Forecast, by Country 2019 & 2032
- Table 35: Europe Hydraulic Fracturing Fluids Market Revenue Million Forecast, by Resource Type 2019 & 2032
- Table 36: Europe Hydraulic Fracturing Fluids Market Volume K Tons Forecast, by Resource Type 2019 & 2032
- Table 37: Europe Hydraulic Fracturing Fluids Market Revenue Million Forecast, by Fluid Type 2019 & 2032
- Table 38: Europe Hydraulic Fracturing Fluids Market Volume K Tons Forecast, by Fluid Type 2019 & 2032
- Table 39: Europe Hydraulic Fracturing Fluids Market Revenue Million Forecast, by Well Type 2019 & 2032
- Table 40: Europe Hydraulic Fracturing Fluids Market Volume K Tons Forecast, by Well Type 2019 & 2032
- Table 41: Europe Hydraulic Fracturing Fluids Market Revenue Million Forecast, by Country 2019 & 2032
- Table 42: Europe Hydraulic Fracturing Fluids Market Volume K Tons Forecast, by Country 2019 & 2032
- Table 43: Europe Hydraulic Fracturing Fluids Market Revenue Million Forecast, by Resource Type 2019 & 2032
- Table 44: Europe Hydraulic Fracturing Fluids Market Volume K Tons Forecast, by Resource Type 2019 & 2032
- Table 45: Europe Hydraulic Fracturing Fluids Market Revenue Million Forecast, by Fluid Type 2019 & 2032
- Table 46: Europe Hydraulic Fracturing Fluids Market Volume K Tons Forecast, by Fluid Type 2019 & 2032
- Table 47: Europe Hydraulic Fracturing Fluids Market Revenue Million Forecast, by Well Type 2019 & 2032
- Table 48: Europe Hydraulic Fracturing Fluids Market Volume K Tons Forecast, by Well Type 2019 & 2032
- Table 49: Europe Hydraulic Fracturing Fluids Market Revenue Million Forecast, by Country 2019 & 2032
- Table 50: Europe Hydraulic Fracturing Fluids Market Volume K Tons Forecast, by Country 2019 & 2032
- Table 51: Europe Hydraulic Fracturing Fluids Market Revenue Million Forecast, by Resource Type 2019 & 2032
- Table 52: Europe Hydraulic Fracturing Fluids Market Volume K Tons Forecast, by Resource Type 2019 & 2032
- Table 53: Europe Hydraulic Fracturing Fluids Market Revenue Million Forecast, by Fluid Type 2019 & 2032
- Table 54: Europe Hydraulic Fracturing Fluids Market Volume K Tons Forecast, by Fluid Type 2019 & 2032
- Table 55: Europe Hydraulic Fracturing Fluids Market Revenue Million Forecast, by Well Type 2019 & 2032
- Table 56: Europe Hydraulic Fracturing Fluids Market Volume K Tons Forecast, by Well Type 2019 & 2032
- Table 57: Europe Hydraulic Fracturing Fluids Market Revenue Million Forecast, by Country 2019 & 2032
- Table 58: Europe Hydraulic Fracturing Fluids Market Volume K Tons Forecast, by Country 2019 & 2032
Frequently Asked Questions
1. What is the projected Compound Annual Growth Rate (CAGR) of the Europe Hydraulic Fracturing Fluids Market?
The projected CAGR is approximately 0.66%.
2. Which companies are prominent players in the Europe Hydraulic Fracturing Fluids Market?
Key companies in the market include IGas Energy PLC, PAO NOVATEK, PJSC Rosneft Oil Company, Cuadrilla Resources Ltd, PJSC Gazprom, Equinor ASA*List Not Exhaustive, Schlumberger , Halliburton, Baker Hughes , Weatherford International.
3. What are the main segments of the Europe Hydraulic Fracturing Fluids Market?
The market segments include Resource Type, Fluid Type, Well Type.
4. Can you provide details about the market size?
The market size is estimated to be USD XX Million as of 2022.
5. What are some drivers contributing to market growth?
4.; Growing Demand for Solar Energy4.; Reducing Solar Panel Costs and Associated Components for Solar Projects.
6. What are the notable trends driving market growth?
Natural Gas to Witness Significant Growth.
7. Are there any restraints impacting market growth?
4.; Availability of Pure Silicon to make Solar PV Cells.
8. Can you provide examples of recent developments in the market?
In September 2022, Gazprom Neft and Mekamineft announced their plan to test the first Russian hydraulic fracturing fleet at the fields in KhMAO-Yugra. The agreement between the companies was signed at the Industrial and Energy Forum in Tyumen. The tests of the modern domestic complex will take place in 2023.
9. What pricing options are available for accessing the report?
Pricing options include single-user, multi-user, and enterprise licenses priced at USD 4750, USD 5250, and USD 8750 respectively.
10. Is the market size provided in terms of value or volume?
The market size is provided in terms of value, measured in Million and volume, measured in K Tons.
11. Are there any specific market keywords associated with the report?
Yes, the market keyword associated with the report is "Europe Hydraulic Fracturing Fluids Market," which aids in identifying and referencing the specific market segment covered.
12. How do I determine which pricing option suits my needs best?
The pricing options vary based on user requirements and access needs. Individual users may opt for single-user licenses, while businesses requiring broader access may choose multi-user or enterprise licenses for cost-effective access to the report.
13. Are there any additional resources or data provided in the Europe Hydraulic Fracturing Fluids Market report?
While the report offers comprehensive insights, it's advisable to review the specific contents or supplementary materials provided to ascertain if additional resources or data are available.
14. How can I stay updated on further developments or reports in the Europe Hydraulic Fracturing Fluids Market?
To stay informed about further developments, trends, and reports in the Europe Hydraulic Fracturing Fluids Market, consider subscribing to industry newsletters, following relevant companies and organizations, or regularly checking reputable industry news sources and publications.
Methodology
Step 1 - Identification of Relevant Samples Size from Population Database


Step 2 - Approaches for Defining Global Market Size (Value, Volume* & Price*)

Note*: In applicable scenarios
Step 3 - Data Sources
Primary Research
- Web Analytics
- Survey Reports
- Research Institute
- Latest Research Reports
- Opinion Leaders
Secondary Research
- Annual Reports
- White Paper
- Latest Press Release
- Industry Association
- Paid Database
- Investor Presentations

Step 4 - Data Triangulation
Involves using different sources of information in order to increase the validity of a study
These sources are likely to be stakeholders in a program - participants, other researchers, program staff, other community members, and so on.
Then we put all data in single framework & apply various statistical tools to find out the dynamic on the market.
During the analysis stage, feedback from the stakeholder groups would be compared to determine areas of agreement as well as areas of divergence


