

Key Insights
The European natural gas market, projected to reach 401.9 billion by 2025, is poised for significant expansion with a Compound Annual Growth Rate (CAGR) of 1.4% from 2025 to 2033. This growth is propelled by escalating energy demand across residential, industrial, and power generation sectors. Natural gas continues to serve as a vital transitional fuel, ensuring reliable electricity and heating, particularly during intermittent renewable energy generation. Furthermore, evolving geopolitical landscapes and a focus on energy security are driving supply diversification, supporting market growth amidst decarbonization efforts.
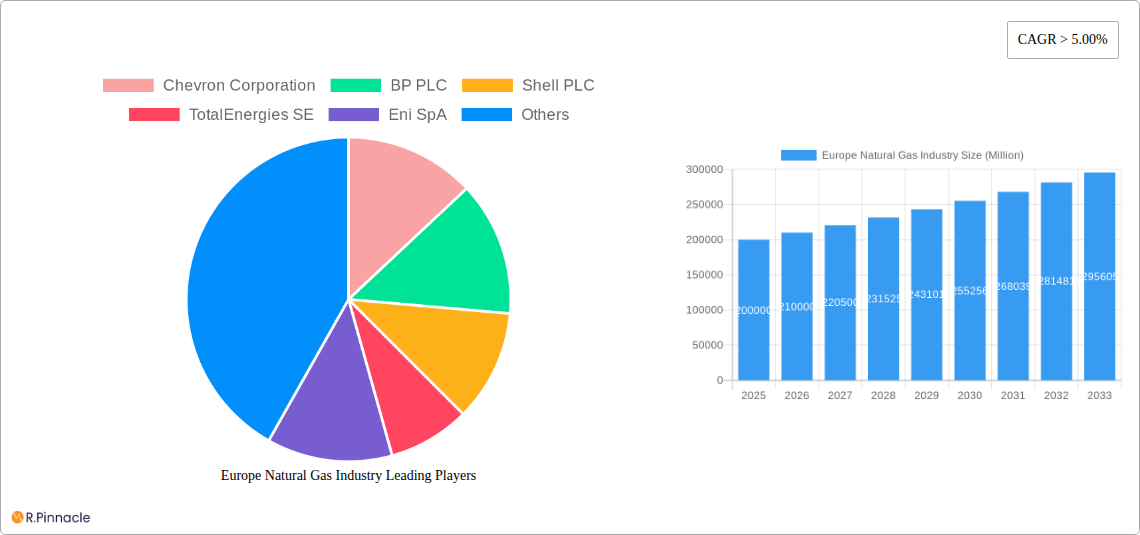
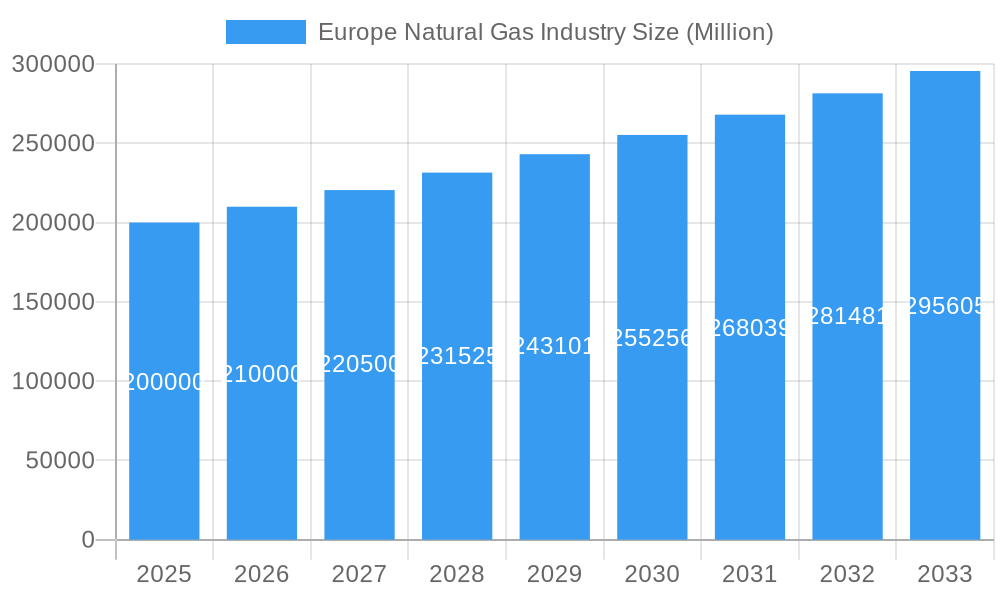
Europe Natural Gas Industry Market Size (In Billion)
Despite its expansion, the market encounters challenges including price volatility stemming from global geopolitical instability and supply chain disruptions. Stringent environmental regulations aimed at reducing greenhouse gas emissions are also a significant factor, driving investment in carbon capture technologies and renewable alternatives. The competitive arena features major international energy corporations such as Chevron, BP, Shell, and TotalEnergies, alongside national entities. Market segmentation is primarily defined by geographical regions, with Western Europe exhibiting higher consumption than Eastern Europe, and by gas type, differentiating between pipeline gas and Liquefied Natural Gas (LNG).
Europe Natural Gas Industry Company Market Share
European Natural Gas Market Analysis: 2019-2033
This comprehensive report delivers an in-depth analysis of the European natural gas industry, providing critical insights for stakeholders. Spanning the period from 2019 to 2033, with a specific focus on the base year 2025, this report meticulously examines market dynamics, key industry players, and future growth trajectories. Utilizing extensive data and analytical frameworks, the report offers actionable intelligence for navigating this evolving sector.
Europe Natural Gas Industry Market Structure & Innovation Trends
This section analyzes the competitive landscape of the European natural gas market, encompassing market concentration, innovation drivers, regulatory frameworks, and M&A activities. The study period (2019-2033), base year (2025), and forecast period (2025-2033) provide a comprehensive overview.
Market Concentration: The European natural gas market exhibits a moderately concentrated structure with a few major players controlling a significant market share. Further analysis will detail the market share of key players such as Chevron Corporation, BP PLC, Shell PLC, TotalEnergies SE, Eni SpA, ConocoPhillips, Exxon Mobil Corporation, Norwegian Energy Company ASA, Engie SA, and Electricite de France SA. The exact market share percentages will be determined in the full report.
Innovation Drivers: Technological advancements in exploration, extraction, and transportation of natural gas are driving innovation. The push for cleaner energy sources and stricter environmental regulations are also key drivers.
Regulatory Frameworks: EU and national-level regulations significantly influence the industry, impacting investment decisions and operational strategies. This section will analyze the impact of these regulations on market dynamics.
Product Substitutes: The emergence of renewable energy sources (e.g., solar, wind) and the increasing adoption of electric vehicles pose significant challenges and create a need for industry adaptation.
End-User Demographics: The report will examine the changing energy consumption patterns across different sectors (residential, commercial, industrial) and their impact on natural gas demand.
M&A Activities: This section will analyze mergers and acquisitions within the sector, including deal values and their strategic implications. The total value of M&A deals in the period covered will be quantified. For example, a significant deal size in xx Million was observed in 2024.
Europe Natural Gas Industry Market Dynamics & Trends
This section provides an in-depth analysis of the critical forces shaping the European natural gas industry, encompassing market growth drivers, transformative technological advancements, and the intricate competitive landscape.
Our comprehensive report will meticulously dissect the multifaceted factors influencing market expansion. This includes the volatility of energy prices, the strategic imperative of government policies focused on bolstering energy security, the pervasive impact of geopolitical events, and the overarching global transition towards a lower-carbon energy ecosystem. We will present a detailed assessment of the Compound Annual Growth Rate (CAGR) and projected market penetration rates for the defined forecast period. Key metrics will encompass, but are not limited to, total gas consumption volumes, import and export flows, and demand forecasts derived from a spectrum of plausible scenarios. The significance of these data points for the industry's strategic direction and operational planning will be thoroughly elucidated.
Dominant Regions & Segments in Europe Natural Gas Industry
This section identifies the leading regions and segments within the European natural gas market.
Key Drivers: This report will highlight the key factors contributing to the dominance of specific regions and segments, such as:
- Favorable economic policies
- Robust infrastructure development
- Abundant natural gas reserves
- High energy demand
Dominance Analysis: A detailed analysis of the leading regions and segments will be presented, including a comparative assessment of their performance metrics and market share. This section will also assess the impact of external factors, such as geopolitical tensions and climate change policies, on regional and segmental performance. For example, the impact of the Ukraine war on the European gas market will be analysed.
Europe Natural Gas Industry Product Innovations
This section examines recent product developments, applications, and competitive advantages in the European natural gas industry. Technological trends such as improved gas extraction techniques, efficient pipeline infrastructure, and the adoption of liquefied natural gas (LNG) technologies will be assessed, highlighting their market fit and impact on competitiveness.
Report Scope & Segmentation Analysis
The report provides a comprehensive segmentation of the European natural gas market, covering different segments and their growth projections, market sizes, and competitive dynamics. This will include a detailed explanation of segmentation criteria and methodologies used for each segment's analysis.
Key Drivers of Europe Natural Gas Industry Growth
This section meticulously outlines the pivotal factors propelling the expansion of the European natural gas industry. These growth accelerators are strategically categorized into technological innovations, significant economic influences, and evolving regulatory frameworks, each substantiated with concrete, illustrative examples.
Challenges in the Europe Natural Gas Industry Sector
This section identifies the key challenges faced by the European natural gas industry, including regulatory hurdles, supply chain disruptions, and competitive pressures. Quantifiable impacts of these challenges will be presented.
Emerging Opportunities in Europe Natural Gas Industry
This section explores emerging opportunities in the European natural gas industry, focusing on new markets, technologies, and consumer preferences.
Leading Players in the Europe Natural Gas Industry Market
Key Developments in Europe Natural Gas Industry Industry
- September 2022: The German government announced a USD 65 Billion plan to mitigate soaring energy prices, highlighting the impact of the energy crisis on national economies.
- March 2022: Equinor's announcement to increase gas supply to Europe in response to reduced Russian supply demonstrates industry adaptability and the ongoing efforts to secure energy supplies. Increased production at the Troll, Oseberg, and Heidrun fields exemplifies this.
Future Outlook for Europe Natural Gas Industry Market
This section synthesizes the principal growth accelerators within the European natural gas industry, offering a forward-looking perspective on future market potential and highlighting strategic opportunities. The trajectory of the European natural gas industry in the coming years will be intricately linked to the evolution of energy policies, the pace of technological innovation, and the dynamic geopolitical landscape. Our report will provide critical insights into the long-term prospects and strategic considerations for stakeholders navigating this evolving market.
Europe Natural Gas Industry Segmentation
- 1. Production Analysis
- 2. Consumption Analysis
- 3. Import Market Analysis (Value & Volume)
- 4. Export Market Analysis (Value & Volume)
- 5. Price Trend Analysis
Europe Natural Gas Industry Segmentation By Geography
-
1. Europe
- 1.1. United Kingdom
- 1.2. Germany
- 1.3. France
- 1.4. Italy
- 1.5. Spain
- 1.6. Netherlands
- 1.7. Belgium
- 1.8. Sweden
- 1.9. Norway
- 1.10. Poland
- 1.11. Denmark
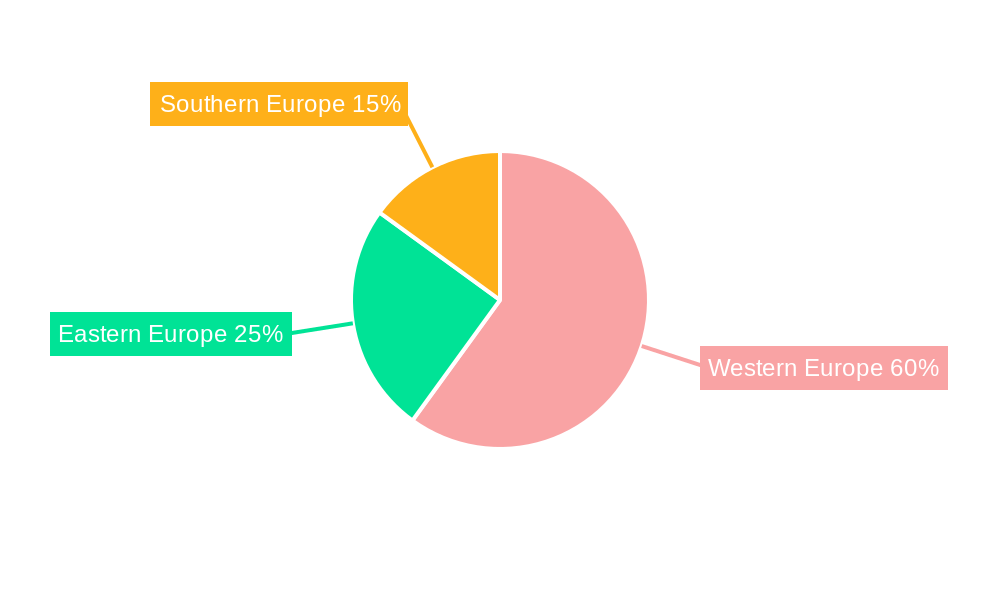
Europe Natural Gas Industry Regional Market Share
Geographic Coverage of Europe Natural Gas Industry
Europe Natural Gas Industry REPORT HIGHLIGHTS
| Aspects | Details |
|---|---|
| Study Period | 2020-2034 |
| Base Year | 2025 |
| Estimated Year | 2026 |
| Forecast Period | 2026-2034 |
| Historical Period | 2020-2025 |
| Growth Rate | CAGR of 1.4% from 2020-2034 |
| Segmentation |
|
Table of Contents
- 1. Introduction
- 1.1. Research Scope
- 1.2. Market Segmentation
- 1.3. Research Objective
- 1.4. Definitions and Assumptions
- 2. Executive Summary
- 2.1. Market Snapshot
- 3. Market Dynamics
- 3.1. Market Drivers
- 3.2. Market Restrains
- 3.3. Market Trends
- 3.4. Market Opportunities
- 4. Market Factor Analysis
- 4.1. Porters Five Forces
- 4.1.1. Bargaining Power of Suppliers
- 4.1.2. Bargaining Power of Buyers
- 4.1.3. Threat of New Entrants
- 4.1.4. Threat of Substitutes
- 4.1.5. Competitive Rivalry
- 4.2. PESTEL analysis
- 4.3. BCG Analysis
- 4.3.1. Stars (High Growth, High Market Share)
- 4.3.2. Cash Cows (Low Growth, High Market Share)
- 4.3.3. Question Mark (High Growth, Low Market Share)
- 4.3.4. Dogs (Low Growth, Low Market Share)
- 4.4. Ansoff Matrix Analysis
- 4.5. Supply Chain Analysis
- 4.6. Regulatory Landscape
- 4.7. Current Market Potential and Opportunity Assessment (TAM–SAM–SOM Framework)
- 4.8. PRI Analyst Note
- 4.1. Porters Five Forces
- 5. Market Analysis, Insights and Forecast 2021-2033
- 5.1. Market Analysis, Insights and Forecast - by Production Analysis
- 5.2. Market Analysis, Insights and Forecast - by Consumption Analysis
- 5.3. Market Analysis, Insights and Forecast - by Import Market Analysis (Value & Volume)
- 5.4. Market Analysis, Insights and Forecast - by Export Market Analysis (Value & Volume)
- 5.5. Market Analysis, Insights and Forecast - by Price Trend Analysis
- 5.6. Market Analysis, Insights and Forecast - by Region
- 5.6.1. Europe
- 6. Europe Natural Gas Industry Analysis, Insights and Forecast, 2021-2033
- 6.1. Market Analysis, Insights and Forecast - by Production Analysis
- 6.2. Market Analysis, Insights and Forecast - by Consumption Analysis
- 6.3. Market Analysis, Insights and Forecast - by Import Market Analysis (Value & Volume)
- 6.4. Market Analysis, Insights and Forecast - by Export Market Analysis (Value & Volume)
- 6.5. Market Analysis, Insights and Forecast - by Price Trend Analysis
- 7. Competitive Analysis
- 7.1. Company Profiles
- 7.1.1 Chevron Corporation
- 7.1.1.1. Company Overview
- 7.1.1.2. Products
- 7.1.1.3. Company Financials
- 7.1.1.4. SWOT Analysis
- 7.1.2 BP PLC
- 7.1.2.1. Company Overview
- 7.1.2.2. Products
- 7.1.2.3. Company Financials
- 7.1.2.4. SWOT Analysis
- 7.1.3 Shell PLC
- 7.1.3.1. Company Overview
- 7.1.3.2. Products
- 7.1.3.3. Company Financials
- 7.1.3.4. SWOT Analysis
- 7.1.4 TotalEnergies SE
- 7.1.4.1. Company Overview
- 7.1.4.2. Products
- 7.1.4.3. Company Financials
- 7.1.4.4. SWOT Analysis
- 7.1.5 Eni SpA
- 7.1.5.1. Company Overview
- 7.1.5.2. Products
- 7.1.5.3. Company Financials
- 7.1.5.4. SWOT Analysis
- 7.1.6 ConocoPhillips
- 7.1.6.1. Company Overview
- 7.1.6.2. Products
- 7.1.6.3. Company Financials
- 7.1.6.4. SWOT Analysis
- 7.1.7 Exxon Mobil Corporation
- 7.1.7.1. Company Overview
- 7.1.7.2. Products
- 7.1.7.3. Company Financials
- 7.1.7.4. SWOT Analysis
- 7.1.8 Norwegian Energy Company ASA
- 7.1.8.1. Company Overview
- 7.1.8.2. Products
- 7.1.8.3. Company Financials
- 7.1.8.4. SWOT Analysis
- 7.1.9 Engie SA
- 7.1.9.1. Company Overview
- 7.1.9.2. Products
- 7.1.9.3. Company Financials
- 7.1.9.4. SWOT Analysis
- 7.1.10 Electricite de France SA*List Not Exhaustive
- 7.1.10.1. Company Overview
- 7.1.10.2. Products
- 7.1.10.3. Company Financials
- 7.1.10.4. SWOT Analysis
- 7.1.1 Chevron Corporation
- 7.2. Market Entropy
- 7.2.1 Company's Key Areas Served
- 7.2.2 Recent Developments
- 7.3. Company Market Share Analysis 2025
- 7.3.1 Top 5 Companies Market Share Analysis
- 7.3.2 Top 3 Companies Market Share Analysis
- 7.4. List of Potential Customers
- 8. Research Methodology
List of Figures
- Figure 1: Europe Natural Gas Industry Revenue Breakdown (billion, %) by Product 2025 & 2033
- Figure 2: Europe Natural Gas Industry Share (%) by Company 2025
List of Tables
- Table 1: Europe Natural Gas Industry Revenue billion Forecast, by Production Analysis 2020 & 2033
- Table 2: Europe Natural Gas Industry Revenue billion Forecast, by Consumption Analysis 2020 & 2033
- Table 3: Europe Natural Gas Industry Revenue billion Forecast, by Import Market Analysis (Value & Volume) 2020 & 2033
- Table 4: Europe Natural Gas Industry Revenue billion Forecast, by Export Market Analysis (Value & Volume) 2020 & 2033
- Table 5: Europe Natural Gas Industry Revenue billion Forecast, by Price Trend Analysis 2020 & 2033
- Table 6: Europe Natural Gas Industry Revenue billion Forecast, by Region 2020 & 2033
- Table 7: Europe Natural Gas Industry Revenue billion Forecast, by Production Analysis 2020 & 2033
- Table 8: Europe Natural Gas Industry Revenue billion Forecast, by Consumption Analysis 2020 & 2033
- Table 9: Europe Natural Gas Industry Revenue billion Forecast, by Import Market Analysis (Value & Volume) 2020 & 2033
- Table 10: Europe Natural Gas Industry Revenue billion Forecast, by Export Market Analysis (Value & Volume) 2020 & 2033
- Table 11: Europe Natural Gas Industry Revenue billion Forecast, by Price Trend Analysis 2020 & 2033
- Table 12: Europe Natural Gas Industry Revenue billion Forecast, by Country 2020 & 2033
- Table 13: United Kingdom Europe Natural Gas Industry Revenue (billion) Forecast, by Application 2020 & 2033
- Table 14: Germany Europe Natural Gas Industry Revenue (billion) Forecast, by Application 2020 & 2033
- Table 15: France Europe Natural Gas Industry Revenue (billion) Forecast, by Application 2020 & 2033
- Table 16: Italy Europe Natural Gas Industry Revenue (billion) Forecast, by Application 2020 & 2033
- Table 17: Spain Europe Natural Gas Industry Revenue (billion) Forecast, by Application 2020 & 2033
- Table 18: Netherlands Europe Natural Gas Industry Revenue (billion) Forecast, by Application 2020 & 2033
- Table 19: Belgium Europe Natural Gas Industry Revenue (billion) Forecast, by Application 2020 & 2033
- Table 20: Sweden Europe Natural Gas Industry Revenue (billion) Forecast, by Application 2020 & 2033
- Table 21: Norway Europe Natural Gas Industry Revenue (billion) Forecast, by Application 2020 & 2033
- Table 22: Poland Europe Natural Gas Industry Revenue (billion) Forecast, by Application 2020 & 2033
- Table 23: Denmark Europe Natural Gas Industry Revenue (billion) Forecast, by Application 2020 & 2033
Frequently Asked Questions
1. What is the projected Compound Annual Growth Rate (CAGR) of the Europe Natural Gas Industry?
The projected CAGR is approximately 1.4%.
2. Which companies are prominent players in the Europe Natural Gas Industry?
Key companies in the market include Chevron Corporation, BP PLC, Shell PLC, TotalEnergies SE, Eni SpA, ConocoPhillips, Exxon Mobil Corporation, Norwegian Energy Company ASA, Engie SA, Electricite de France SA*List Not Exhaustive.
3. What are the main segments of the Europe Natural Gas Industry?
The market segments include Production Analysis, Consumption Analysis, Import Market Analysis (Value & Volume), Export Market Analysis (Value & Volume), Price Trend Analysis.
4. Can you provide details about the market size?
The market size is estimated to be USD 401.9 billion as of 2022.
5. What are some drivers contributing to market growth?
N/A
6. What are the notable trends driving market growth?
Upstream Sector to Witness Significant Growth.
7. Are there any restraints impacting market growth?
N/A
8. Can you provide examples of recent developments in the market?
In September 2022, the German government announced a USD 65 billion plan to help people and businesses cope with soaring prices. Several European nations introduce emergency measures to prepare for a long winter in the wake of disruption in Russian gas supplies to Europe following the Ukraine war.
9. What pricing options are available for accessing the report?
Pricing options include single-user, multi-user, and enterprise licenses priced at USD 4750, USD 5250, and USD 8750 respectively.
10. Is the market size provided in terms of value or volume?
The market size is provided in terms of value, measured in billion.
11. Are there any specific market keywords associated with the report?
Yes, the market keyword associated with the report is "Europe Natural Gas Industry," which aids in identifying and referencing the specific market segment covered.
12. How do I determine which pricing option suits my needs best?
The pricing options vary based on user requirements and access needs. Individual users may opt for single-user licenses, while businesses requiring broader access may choose multi-user or enterprise licenses for cost-effective access to the report.
13. Are there any additional resources or data provided in the Europe Natural Gas Industry report?
While the report offers comprehensive insights, it's advisable to review the specific contents or supplementary materials provided to ascertain if additional resources or data are available.
14. How can I stay updated on further developments or reports in the Europe Natural Gas Industry?
To stay informed about further developments, trends, and reports in the Europe Natural Gas Industry, consider subscribing to industry newsletters, following relevant companies and organizations, or regularly checking reputable industry news sources and publications.
Methodology
Step 1 - Identification of Relevant Samples Size from Population Database


Step 2 - Approaches for Defining Global Market Size (Value, Volume* & Price*)

Note*: In applicable scenarios
Step 3 - Data Sources
Primary Research
- Web Analytics
- Survey Reports
- Research Institute
- Latest Research Reports
- Opinion Leaders
Secondary Research
- Annual Reports
- White Paper
- Latest Press Release
- Industry Association
- Paid Database
- Investor Presentations

Step 4 - Data Triangulation
Involves using different sources of information in order to increase the validity of a study
These sources are likely to be stakeholders in a program - participants, other researchers, program staff, other community members, and so on.
Then we put all data in single framework & apply various statistical tools to find out the dynamic on the market.
During the analysis stage, feedback from the stakeholder groups would be compared to determine areas of agreement as well as areas of divergence