
Key Insights
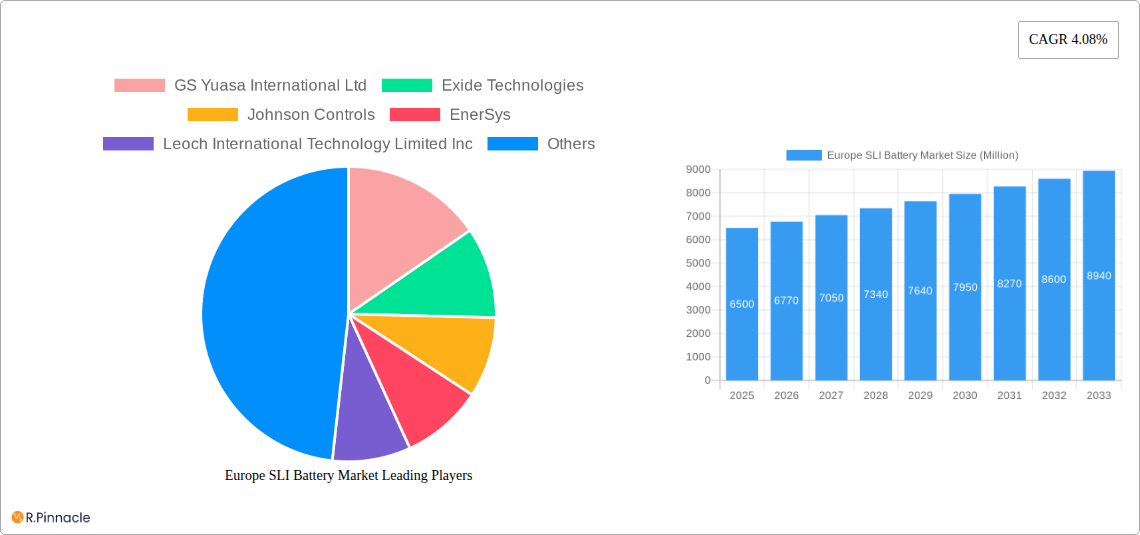
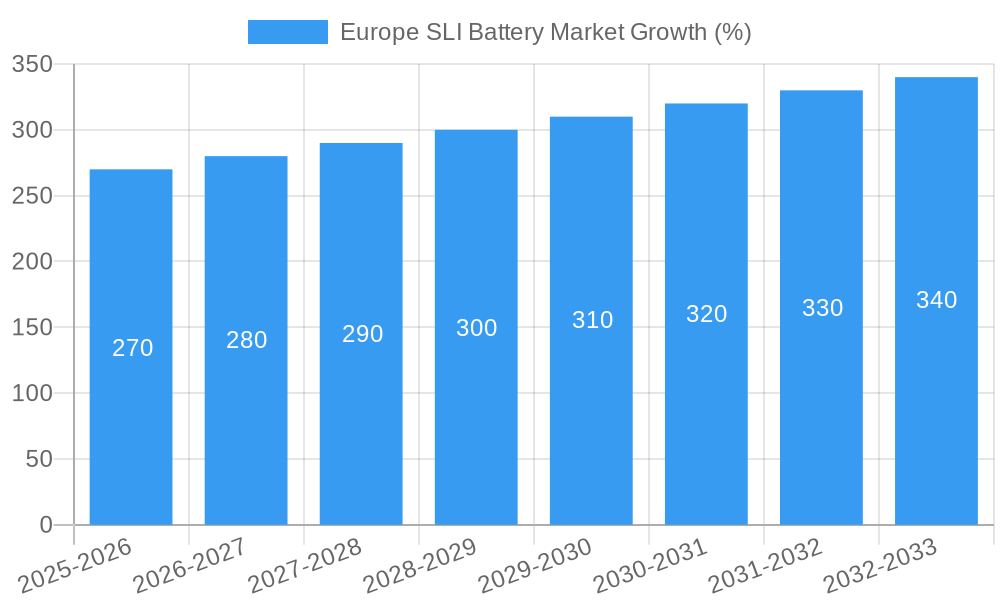
The Europe SLI (Starting, Lighting, and Ignition) battery market, valued at €6.5 billion in 2025, is projected to experience steady growth, driven by the increasing demand for passenger vehicles and commercial fleets. A Compound Annual Growth Rate (CAGR) of 4.08% from 2025 to 2033 indicates a robust market expansion, fueled by factors such as the rising adoption of advanced driver-assistance systems (ADAS) and the growing preference for electric vehicles (EVs), albeit indirectly impacting SLI battery demand as EVs require different battery technologies. Stringent emission regulations across Europe are also pushing for improved battery performance and lifespan, creating opportunities for manufacturers to innovate and offer higher-quality, longer-lasting SLI batteries. However, the market faces challenges such as fluctuating raw material prices and increasing competition from Asian battery manufacturers. The market segmentation likely includes various battery chemistries (lead-acid, AGM, EFB), vehicle types (cars, trucks, motorcycles), and distribution channels (OEMs, aftermarket). Leading players like GS Yuasa, Exide Technologies, Johnson Controls, and EnerSys are vying for market share through technological advancements, strategic partnerships, and geographical expansion. The projected growth will likely be influenced by economic fluctuations, technological innovations in battery technology, and evolving government policies.
The sustained growth trajectory reflects the continuous demand from the automotive industry and related sectors. The significant presence of established players such as GS Yuasa, Exide Technologies, and Johnson Controls points towards a competitive landscape with ongoing investments in research and development to enhance product features and optimize production efficiencies. Despite economic headwinds, the long-term outlook for the European SLI battery market remains optimistic due to ongoing fleet renewal and the increasing lifespan expectations of vehicles. The market's evolution is expected to be shaped by sustainability concerns, leading to greater focus on recycling initiatives and environmentally friendly manufacturing practices.
This comprehensive report provides an in-depth analysis of the Europe SLI (Starting, Lighting, and Ignition) Battery market, offering valuable insights for industry professionals, investors, and strategic decision-makers. Covering the period 2019-2033, with a focus on 2025, this report dissects market dynamics, competitive landscapes, and future growth potential. Benefit from detailed segmentation, key player analysis, and crucial trend identification to navigate this evolving market effectively.
Europe SLI Battery Market Market Structure & Innovation Trends
The Europe SLI battery market exhibits a moderately concentrated structure, with several key players holding significant market share. Market share analysis reveals that GS Yuasa International Ltd, Exide Technologies, Johnson Controls, EnerSys, and Clarios International Inc. are among the leading companies, collectively accounting for an estimated xx% of the market in 2025. However, the market also includes numerous smaller players, fostering competition and innovation.
- Market Concentration: Moderate, with top 5 players holding xx% market share (2025).
- Innovation Drivers: Stringent emission regulations, the rise of electric vehicles (indirectly impacting SLI demand), and the increasing demand for higher-performance batteries are driving innovation.
- Regulatory Frameworks: The EU's Regulation (EU) 2023/1542 significantly impacts the market, mandating sustainability and safety standards throughout the battery lifecycle. This regulation drives innovation in sustainable battery production and recycling technologies.
- Product Substitutes: While no direct substitutes exist, advancements in alternative energy storage technologies, like ultracapacitors, pose a long-term potential threat.
- End-User Demographics: The automotive industry is the primary end-user, with substantial demand from passenger cars, commercial vehicles, and two-wheelers.
- M&A Activities: The past five years have witnessed xx M&A deals valued at approximately €xx Million, primarily focused on expanding product portfolios and geographical reach. These deals have consolidated market share among leading players.
Europe SLI Battery Market Market Dynamics & Trends
The Europe SLI battery market is projected to experience a Compound Annual Growth Rate (CAGR) of xx% during the forecast period (2025-2033). This growth is primarily driven by the increasing sales of vehicles across Europe, particularly in key markets like Germany, France, and the UK. Technological advancements, such as improved battery performance and lifespan, further fuel market expansion. However, fluctuating raw material prices and the increasing adoption of alternative energy storage systems present challenges to growth. Market penetration of high-performance SLI batteries is expected to reach xx% by 2033.
Dominant Regions & Segments in Europe SLI Battery Market
Germany currently holds the largest market share within the European SLI battery market, followed by France and the UK.
- Key Drivers for Germany's Dominance: Strong automotive manufacturing base, robust infrastructure supporting the automotive supply chain, and government initiatives promoting sustainable transportation.
The passenger car segment currently dominates the market, accounting for approximately xx% of total sales. This reflects the significant demand for SLI batteries from the large passenger car market in Europe.
- Detailed Dominance Analysis: Germany's strong automotive industry is the key driver behind its market leadership. The country's well-established automotive supply chain, coupled with government support for the sector, creates a favorable environment for SLI battery manufacturers.
Europe SLI Battery Market Product Innovations
Recent innovations focus on enhancing battery performance, extending lifespan, and improving environmental sustainability. Manufacturers are developing advanced battery chemistries and incorporating improved manufacturing processes to meet stringent regulatory requirements and increasing customer demands for longer-lasting and more reliable batteries. The integration of smart technology for battery management systems is also gaining traction.
Report Scope & Segmentation Analysis
This report segments the Europe SLI battery market by battery type (VRLA, flooded, etc.), vehicle type (passenger cars, commercial vehicles, motorcycles), and country. Each segment is analyzed based on historical data, current market size, and future growth projections, along with competitive dynamics within each segment. Growth projections indicate xx% growth in the VRLA segment by 2033, driven by its superior performance and safety features.
Key Drivers of Europe SLI Battery Market Growth
- Growing Vehicle Sales: The steady growth in vehicle sales across Europe fuels demand for SLI batteries.
- Technological Advancements: Innovations in battery chemistry and manufacturing processes are leading to improved battery performance and longer lifespan.
- Stringent Emission Regulations: Regulations promoting cleaner transportation indirectly impact SLI battery demand by encouraging vehicle sales.
Challenges in the Europe SLI Battery Market Sector
- Fluctuating Raw Material Prices: Price volatility of lead and other raw materials impacts manufacturing costs and profitability.
- Supply Chain Disruptions: Global supply chain issues can affect the availability of raw materials and components.
- Competitive Pressure: The presence of numerous players creates intense competition, impacting pricing and profitability.
Emerging Opportunities in Europe SLI Battery Market
- Growth in Electric Vehicles (Indirectly): While EVs use different battery technologies, the growth of the EV market still influences the SLI market as it indirectly increases the overall demand for batteries in the transportation sector.
- Demand for Higher-Performance Batteries: The increasing demand for improved battery performance and longer lifespan offers opportunities for innovation and premium product development.
- Focus on Sustainability: The growing emphasis on sustainability creates opportunities for environmentally friendly battery technologies and recycling solutions.
Leading Players in the Europe SLI Battery Market Market
- GS Yuasa International Ltd
- Exide Technologies
- Johnson Controls
- EnerSys
- Leoch International Technology Limited Inc
- East Penn Manufacturing Company
- C&D Technologies Inc
- Clarios International Inc
- Trojan Battery Company
- Crown Battery Manufacturing Company
- List Not Exhaustive
Key Developments in Europe SLI Battery Market Industry
- June 2023: The European Union introduced Regulation (EU) 2023/1542, impacting battery manufacturing and recycling.
- February 2024: Euro Energy Resources Limited unveils breakthroughs in VRLA batteries, impacting the high-performance segment.
Future Outlook for Europe SLI Battery Market Market
The Europe SLI battery market is poised for continued growth, driven by factors such as increasing vehicle sales, technological advancements, and the focus on sustainability. Strategic partnerships, investments in R&D, and the development of innovative battery technologies will be crucial for sustained success in this dynamic market. The market is expected to continue to consolidate, with larger players acquiring smaller ones to gain market share and access new technologies.
Europe SLI Battery Market Segmentation
-
1. Type
- 1.1. Flooded Battery
- 1.2. VRLA Battery
- 1.3. EBF Battery
-
2. End-User
- 2.1. Automotive
- 2.2. Others
Europe SLI Battery Market Segmentation By Geography
- 1. Germany
- 2. France
- 3. United Kingdom
- 4. Italy
- 5. Spain
- 6. NORDIC
- 7. Russia
- 8. Turkey
- 9. Rest of Europe
Europe SLI Battery Market REPORT HIGHLIGHTS
| Aspects | Details |
|---|---|
| Study Period | 2019-2033 |
| Base Year | 2024 |
| Estimated Year | 2025 |
| Forecast Period | 2025-2033 |
| Historical Period | 2019-2024 |
| Growth Rate | CAGR of 4.08% from 2019-2033 |
| Segmentation |
|
Table of Contents
- 1. Introduction
- 1.1. Research Scope
- 1.2. Market Segmentation
- 1.3. Research Methodology
- 1.4. Definitions and Assumptions
- 2. Executive Summary
- 2.1. Introduction
- 3. Market Dynamics
- 3.1. Introduction
- 3.2. Market Drivers
- 3.2.1. 4.; Increasing Adoption of Motor Vehicles4.; Growing Demand for SLI Batteries from Industrial and Agricultural Applications
- 3.3. Market Restrains
- 3.3.1. 4.; Increasing Adoption of Motor Vehicles4.; Growing Demand for SLI Batteries from Industrial and Agricultural Applications
- 3.4. Market Trends
- 3.4.1. Automotive End User Industry to Witness Significant Growth
- 4. Market Factor Analysis
- 4.1. Porters Five Forces
- 4.2. Supply/Value Chain
- 4.3. PESTEL analysis
- 4.4. Market Entropy
- 4.5. Patent/Trademark Analysis
- 5. Global Europe SLI Battery Market Analysis, Insights and Forecast, 2019-2031
- 5.1. Market Analysis, Insights and Forecast - by Type
- 5.1.1. Flooded Battery
- 5.1.2. VRLA Battery
- 5.1.3. EBF Battery
- 5.2. Market Analysis, Insights and Forecast - by End-User
- 5.2.1. Automotive
- 5.2.2. Others
- 5.3. Market Analysis, Insights and Forecast - by Region
- 5.3.1. Germany
- 5.3.2. France
- 5.3.3. United Kingdom
- 5.3.4. Italy
- 5.3.5. Spain
- 5.3.6. NORDIC
- 5.3.7. Russia
- 5.3.8. Turkey
- 5.3.9. Rest of Europe
- 5.1. Market Analysis, Insights and Forecast - by Type
- 6. Germany Europe SLI Battery Market Analysis, Insights and Forecast, 2019-2031
- 6.1. Market Analysis, Insights and Forecast - by Type
- 6.1.1. Flooded Battery
- 6.1.2. VRLA Battery
- 6.1.3. EBF Battery
- 6.2. Market Analysis, Insights and Forecast - by End-User
- 6.2.1. Automotive
- 6.2.2. Others
- 6.1. Market Analysis, Insights and Forecast - by Type
- 7. France Europe SLI Battery Market Analysis, Insights and Forecast, 2019-2031
- 7.1. Market Analysis, Insights and Forecast - by Type
- 7.1.1. Flooded Battery
- 7.1.2. VRLA Battery
- 7.1.3. EBF Battery
- 7.2. Market Analysis, Insights and Forecast - by End-User
- 7.2.1. Automotive
- 7.2.2. Others
- 7.1. Market Analysis, Insights and Forecast - by Type
- 8. United Kingdom Europe SLI Battery Market Analysis, Insights and Forecast, 2019-2031
- 8.1. Market Analysis, Insights and Forecast - by Type
- 8.1.1. Flooded Battery
- 8.1.2. VRLA Battery
- 8.1.3. EBF Battery
- 8.2. Market Analysis, Insights and Forecast - by End-User
- 8.2.1. Automotive
- 8.2.2. Others
- 8.1. Market Analysis, Insights and Forecast - by Type
- 9. Italy Europe SLI Battery Market Analysis, Insights and Forecast, 2019-2031
- 9.1. Market Analysis, Insights and Forecast - by Type
- 9.1.1. Flooded Battery
- 9.1.2. VRLA Battery
- 9.1.3. EBF Battery
- 9.2. Market Analysis, Insights and Forecast - by End-User
- 9.2.1. Automotive
- 9.2.2. Others
- 9.1. Market Analysis, Insights and Forecast - by Type
- 10. Spain Europe SLI Battery Market Analysis, Insights and Forecast, 2019-2031
- 10.1. Market Analysis, Insights and Forecast - by Type
- 10.1.1. Flooded Battery
- 10.1.2. VRLA Battery
- 10.1.3. EBF Battery
- 10.2. Market Analysis, Insights and Forecast - by End-User
- 10.2.1. Automotive
- 10.2.2. Others
- 10.1. Market Analysis, Insights and Forecast - by Type
- 11. NORDIC Europe SLI Battery Market Analysis, Insights and Forecast, 2019-2031
- 11.1. Market Analysis, Insights and Forecast - by Type
- 11.1.1. Flooded Battery
- 11.1.2. VRLA Battery
- 11.1.3. EBF Battery
- 11.2. Market Analysis, Insights and Forecast - by End-User
- 11.2.1. Automotive
- 11.2.2. Others
- 11.1. Market Analysis, Insights and Forecast - by Type
- 12. Russia Europe SLI Battery Market Analysis, Insights and Forecast, 2019-2031
- 12.1. Market Analysis, Insights and Forecast - by Type
- 12.1.1. Flooded Battery
- 12.1.2. VRLA Battery
- 12.1.3. EBF Battery
- 12.2. Market Analysis, Insights and Forecast - by End-User
- 12.2.1. Automotive
- 12.2.2. Others
- 12.1. Market Analysis, Insights and Forecast - by Type
- 13. Turkey Europe SLI Battery Market Analysis, Insights and Forecast, 2019-2031
- 13.1. Market Analysis, Insights and Forecast - by Type
- 13.1.1. Flooded Battery
- 13.1.2. VRLA Battery
- 13.1.3. EBF Battery
- 13.2. Market Analysis, Insights and Forecast - by End-User
- 13.2.1. Automotive
- 13.2.2. Others
- 13.1. Market Analysis, Insights and Forecast - by Type
- 14. Rest of Europe Europe SLI Battery Market Analysis, Insights and Forecast, 2019-2031
- 14.1. Market Analysis, Insights and Forecast - by Type
- 14.1.1. Flooded Battery
- 14.1.2. VRLA Battery
- 14.1.3. EBF Battery
- 14.2. Market Analysis, Insights and Forecast - by End-User
- 14.2.1. Automotive
- 14.2.2. Others
- 14.1. Market Analysis, Insights and Forecast - by Type
- 15. Competitive Analysis
- 15.1. Global Market Share Analysis 2024
- 15.2. Company Profiles
- 15.2.1 GS Yuasa International Ltd
- 15.2.1.1. Overview
- 15.2.1.2. Products
- 15.2.1.3. SWOT Analysis
- 15.2.1.4. Recent Developments
- 15.2.1.5. Financials (Based on Availability)
- 15.2.2 Exide Technologies
- 15.2.2.1. Overview
- 15.2.2.2. Products
- 15.2.2.3. SWOT Analysis
- 15.2.2.4. Recent Developments
- 15.2.2.5. Financials (Based on Availability)
- 15.2.3 Johnson Controls
- 15.2.3.1. Overview
- 15.2.3.2. Products
- 15.2.3.3. SWOT Analysis
- 15.2.3.4. Recent Developments
- 15.2.3.5. Financials (Based on Availability)
- 15.2.4 EnerSys
- 15.2.4.1. Overview
- 15.2.4.2. Products
- 15.2.4.3. SWOT Analysis
- 15.2.4.4. Recent Developments
- 15.2.4.5. Financials (Based on Availability)
- 15.2.5 Leoch International Technology Limited Inc
- 15.2.5.1. Overview
- 15.2.5.2. Products
- 15.2.5.3. SWOT Analysis
- 15.2.5.4. Recent Developments
- 15.2.5.5. Financials (Based on Availability)
- 15.2.6 East Penn Manufacturing Company
- 15.2.6.1. Overview
- 15.2.6.2. Products
- 15.2.6.3. SWOT Analysis
- 15.2.6.4. Recent Developments
- 15.2.6.5. Financials (Based on Availability)
- 15.2.7 C&D Technologies Inc
- 15.2.7.1. Overview
- 15.2.7.2. Products
- 15.2.7.3. SWOT Analysis
- 15.2.7.4. Recent Developments
- 15.2.7.5. Financials (Based on Availability)
- 15.2.8 Clarios International Inc
- 15.2.8.1. Overview
- 15.2.8.2. Products
- 15.2.8.3. SWOT Analysis
- 15.2.8.4. Recent Developments
- 15.2.8.5. Financials (Based on Availability)
- 15.2.9 Trojan Battery Company
- 15.2.9.1. Overview
- 15.2.9.2. Products
- 15.2.9.3. SWOT Analysis
- 15.2.9.4. Recent Developments
- 15.2.9.5. Financials (Based on Availability)
- 15.2.10 Crown Battery Manufacturing Company*List Not Exhaustive 6 4 List of Other Prominent Companies6 5 Market Ranking/Share (%) Analysi
- 15.2.10.1. Overview
- 15.2.10.2. Products
- 15.2.10.3. SWOT Analysis
- 15.2.10.4. Recent Developments
- 15.2.10.5. Financials (Based on Availability)
- 15.2.1 GS Yuasa International Ltd
List of Figures
- Figure 1: Global Europe SLI Battery Market Revenue Breakdown (Million, %) by Region 2024 & 2032
- Figure 2: Global Europe SLI Battery Market Volume Breakdown (Billion, %) by Region 2024 & 2032
- Figure 3: Germany Europe SLI Battery Market Revenue (Million), by Type 2024 & 2032
- Figure 4: Germany Europe SLI Battery Market Volume (Billion), by Type 2024 & 2032
- Figure 5: Germany Europe SLI Battery Market Revenue Share (%), by Type 2024 & 2032
- Figure 6: Germany Europe SLI Battery Market Volume Share (%), by Type 2024 & 2032
- Figure 7: Germany Europe SLI Battery Market Revenue (Million), by End-User 2024 & 2032
- Figure 8: Germany Europe SLI Battery Market Volume (Billion), by End-User 2024 & 2032
- Figure 9: Germany Europe SLI Battery Market Revenue Share (%), by End-User 2024 & 2032
- Figure 10: Germany Europe SLI Battery Market Volume Share (%), by End-User 2024 & 2032
- Figure 11: Germany Europe SLI Battery Market Revenue (Million), by Country 2024 & 2032
- Figure 12: Germany Europe SLI Battery Market Volume (Billion), by Country 2024 & 2032
- Figure 13: Germany Europe SLI Battery Market Revenue Share (%), by Country 2024 & 2032
- Figure 14: Germany Europe SLI Battery Market Volume Share (%), by Country 2024 & 2032
- Figure 15: France Europe SLI Battery Market Revenue (Million), by Type 2024 & 2032
- Figure 16: France Europe SLI Battery Market Volume (Billion), by Type 2024 & 2032
- Figure 17: France Europe SLI Battery Market Revenue Share (%), by Type 2024 & 2032
- Figure 18: France Europe SLI Battery Market Volume Share (%), by Type 2024 & 2032
- Figure 19: France Europe SLI Battery Market Revenue (Million), by End-User 2024 & 2032
- Figure 20: France Europe SLI Battery Market Volume (Billion), by End-User 2024 & 2032
- Figure 21: France Europe SLI Battery Market Revenue Share (%), by End-User 2024 & 2032
- Figure 22: France Europe SLI Battery Market Volume Share (%), by End-User 2024 & 2032
- Figure 23: France Europe SLI Battery Market Revenue (Million), by Country 2024 & 2032
- Figure 24: France Europe SLI Battery Market Volume (Billion), by Country 2024 & 2032
- Figure 25: France Europe SLI Battery Market Revenue Share (%), by Country 2024 & 2032
- Figure 26: France Europe SLI Battery Market Volume Share (%), by Country 2024 & 2032
- Figure 27: United Kingdom Europe SLI Battery Market Revenue (Million), by Type 2024 & 2032
- Figure 28: United Kingdom Europe SLI Battery Market Volume (Billion), by Type 2024 & 2032
- Figure 29: United Kingdom Europe SLI Battery Market Revenue Share (%), by Type 2024 & 2032
- Figure 30: United Kingdom Europe SLI Battery Market Volume Share (%), by Type 2024 & 2032
- Figure 31: United Kingdom Europe SLI Battery Market Revenue (Million), by End-User 2024 & 2032
- Figure 32: United Kingdom Europe SLI Battery Market Volume (Billion), by End-User 2024 & 2032
- Figure 33: United Kingdom Europe SLI Battery Market Revenue Share (%), by End-User 2024 & 2032
- Figure 34: United Kingdom Europe SLI Battery Market Volume Share (%), by End-User 2024 & 2032
- Figure 35: United Kingdom Europe SLI Battery Market Revenue (Million), by Country 2024 & 2032
- Figure 36: United Kingdom Europe SLI Battery Market Volume (Billion), by Country 2024 & 2032
- Figure 37: United Kingdom Europe SLI Battery Market Revenue Share (%), by Country 2024 & 2032
- Figure 38: United Kingdom Europe SLI Battery Market Volume Share (%), by Country 2024 & 2032
- Figure 39: Italy Europe SLI Battery Market Revenue (Million), by Type 2024 & 2032
- Figure 40: Italy Europe SLI Battery Market Volume (Billion), by Type 2024 & 2032
- Figure 41: Italy Europe SLI Battery Market Revenue Share (%), by Type 2024 & 2032
- Figure 42: Italy Europe SLI Battery Market Volume Share (%), by Type 2024 & 2032
- Figure 43: Italy Europe SLI Battery Market Revenue (Million), by End-User 2024 & 2032
- Figure 44: Italy Europe SLI Battery Market Volume (Billion), by End-User 2024 & 2032
- Figure 45: Italy Europe SLI Battery Market Revenue Share (%), by End-User 2024 & 2032
- Figure 46: Italy Europe SLI Battery Market Volume Share (%), by End-User 2024 & 2032
- Figure 47: Italy Europe SLI Battery Market Revenue (Million), by Country 2024 & 2032
- Figure 48: Italy Europe SLI Battery Market Volume (Billion), by Country 2024 & 2032
- Figure 49: Italy Europe SLI Battery Market Revenue Share (%), by Country 2024 & 2032
- Figure 50: Italy Europe SLI Battery Market Volume Share (%), by Country 2024 & 2032
- Figure 51: Spain Europe SLI Battery Market Revenue (Million), by Type 2024 & 2032
- Figure 52: Spain Europe SLI Battery Market Volume (Billion), by Type 2024 & 2032
- Figure 53: Spain Europe SLI Battery Market Revenue Share (%), by Type 2024 & 2032
- Figure 54: Spain Europe SLI Battery Market Volume Share (%), by Type 2024 & 2032
- Figure 55: Spain Europe SLI Battery Market Revenue (Million), by End-User 2024 & 2032
- Figure 56: Spain Europe SLI Battery Market Volume (Billion), by End-User 2024 & 2032
- Figure 57: Spain Europe SLI Battery Market Revenue Share (%), by End-User 2024 & 2032
- Figure 58: Spain Europe SLI Battery Market Volume Share (%), by End-User 2024 & 2032
- Figure 59: Spain Europe SLI Battery Market Revenue (Million), by Country 2024 & 2032
- Figure 60: Spain Europe SLI Battery Market Volume (Billion), by Country 2024 & 2032
- Figure 61: Spain Europe SLI Battery Market Revenue Share (%), by Country 2024 & 2032
- Figure 62: Spain Europe SLI Battery Market Volume Share (%), by Country 2024 & 2032
- Figure 63: NORDIC Europe SLI Battery Market Revenue (Million), by Type 2024 & 2032
- Figure 64: NORDIC Europe SLI Battery Market Volume (Billion), by Type 2024 & 2032
- Figure 65: NORDIC Europe SLI Battery Market Revenue Share (%), by Type 2024 & 2032
- Figure 66: NORDIC Europe SLI Battery Market Volume Share (%), by Type 2024 & 2032
- Figure 67: NORDIC Europe SLI Battery Market Revenue (Million), by End-User 2024 & 2032
- Figure 68: NORDIC Europe SLI Battery Market Volume (Billion), by End-User 2024 & 2032
- Figure 69: NORDIC Europe SLI Battery Market Revenue Share (%), by End-User 2024 & 2032
- Figure 70: NORDIC Europe SLI Battery Market Volume Share (%), by End-User 2024 & 2032
- Figure 71: NORDIC Europe SLI Battery Market Revenue (Million), by Country 2024 & 2032
- Figure 72: NORDIC Europe SLI Battery Market Volume (Billion), by Country 2024 & 2032
- Figure 73: NORDIC Europe SLI Battery Market Revenue Share (%), by Country 2024 & 2032
- Figure 74: NORDIC Europe SLI Battery Market Volume Share (%), by Country 2024 & 2032
- Figure 75: Russia Europe SLI Battery Market Revenue (Million), by Type 2024 & 2032
- Figure 76: Russia Europe SLI Battery Market Volume (Billion), by Type 2024 & 2032
- Figure 77: Russia Europe SLI Battery Market Revenue Share (%), by Type 2024 & 2032
- Figure 78: Russia Europe SLI Battery Market Volume Share (%), by Type 2024 & 2032
- Figure 79: Russia Europe SLI Battery Market Revenue (Million), by End-User 2024 & 2032
- Figure 80: Russia Europe SLI Battery Market Volume (Billion), by End-User 2024 & 2032
- Figure 81: Russia Europe SLI Battery Market Revenue Share (%), by End-User 2024 & 2032
- Figure 82: Russia Europe SLI Battery Market Volume Share (%), by End-User 2024 & 2032
- Figure 83: Russia Europe SLI Battery Market Revenue (Million), by Country 2024 & 2032
- Figure 84: Russia Europe SLI Battery Market Volume (Billion), by Country 2024 & 2032
- Figure 85: Russia Europe SLI Battery Market Revenue Share (%), by Country 2024 & 2032
- Figure 86: Russia Europe SLI Battery Market Volume Share (%), by Country 2024 & 2032
- Figure 87: Turkey Europe SLI Battery Market Revenue (Million), by Type 2024 & 2032
- Figure 88: Turkey Europe SLI Battery Market Volume (Billion), by Type 2024 & 2032
- Figure 89: Turkey Europe SLI Battery Market Revenue Share (%), by Type 2024 & 2032
- Figure 90: Turkey Europe SLI Battery Market Volume Share (%), by Type 2024 & 2032
- Figure 91: Turkey Europe SLI Battery Market Revenue (Million), by End-User 2024 & 2032
- Figure 92: Turkey Europe SLI Battery Market Volume (Billion), by End-User 2024 & 2032
- Figure 93: Turkey Europe SLI Battery Market Revenue Share (%), by End-User 2024 & 2032
- Figure 94: Turkey Europe SLI Battery Market Volume Share (%), by End-User 2024 & 2032
- Figure 95: Turkey Europe SLI Battery Market Revenue (Million), by Country 2024 & 2032
- Figure 96: Turkey Europe SLI Battery Market Volume (Billion), by Country 2024 & 2032
- Figure 97: Turkey Europe SLI Battery Market Revenue Share (%), by Country 2024 & 2032
- Figure 98: Turkey Europe SLI Battery Market Volume Share (%), by Country 2024 & 2032
- Figure 99: Rest of Europe Europe SLI Battery Market Revenue (Million), by Type 2024 & 2032
- Figure 100: Rest of Europe Europe SLI Battery Market Volume (Billion), by Type 2024 & 2032
- Figure 101: Rest of Europe Europe SLI Battery Market Revenue Share (%), by Type 2024 & 2032
- Figure 102: Rest of Europe Europe SLI Battery Market Volume Share (%), by Type 2024 & 2032
- Figure 103: Rest of Europe Europe SLI Battery Market Revenue (Million), by End-User 2024 & 2032
- Figure 104: Rest of Europe Europe SLI Battery Market Volume (Billion), by End-User 2024 & 2032
- Figure 105: Rest of Europe Europe SLI Battery Market Revenue Share (%), by End-User 2024 & 2032
- Figure 106: Rest of Europe Europe SLI Battery Market Volume Share (%), by End-User 2024 & 2032
- Figure 107: Rest of Europe Europe SLI Battery Market Revenue (Million), by Country 2024 & 2032
- Figure 108: Rest of Europe Europe SLI Battery Market Volume (Billion), by Country 2024 & 2032
- Figure 109: Rest of Europe Europe SLI Battery Market Revenue Share (%), by Country 2024 & 2032
- Figure 110: Rest of Europe Europe SLI Battery Market Volume Share (%), by Country 2024 & 2032
List of Tables
- Table 1: Global Europe SLI Battery Market Revenue Million Forecast, by Region 2019 & 2032
- Table 2: Global Europe SLI Battery Market Volume Billion Forecast, by Region 2019 & 2032
- Table 3: Global Europe SLI Battery Market Revenue Million Forecast, by Type 2019 & 2032
- Table 4: Global Europe SLI Battery Market Volume Billion Forecast, by Type 2019 & 2032
- Table 5: Global Europe SLI Battery Market Revenue Million Forecast, by End-User 2019 & 2032
- Table 6: Global Europe SLI Battery Market Volume Billion Forecast, by End-User 2019 & 2032
- Table 7: Global Europe SLI Battery Market Revenue Million Forecast, by Region 2019 & 2032
- Table 8: Global Europe SLI Battery Market Volume Billion Forecast, by Region 2019 & 2032
- Table 9: Global Europe SLI Battery Market Revenue Million Forecast, by Type 2019 & 2032
- Table 10: Global Europe SLI Battery Market Volume Billion Forecast, by Type 2019 & 2032
- Table 11: Global Europe SLI Battery Market Revenue Million Forecast, by End-User 2019 & 2032
- Table 12: Global Europe SLI Battery Market Volume Billion Forecast, by End-User 2019 & 2032
- Table 13: Global Europe SLI Battery Market Revenue Million Forecast, by Country 2019 & 2032
- Table 14: Global Europe SLI Battery Market Volume Billion Forecast, by Country 2019 & 2032
- Table 15: Global Europe SLI Battery Market Revenue Million Forecast, by Type 2019 & 2032
- Table 16: Global Europe SLI Battery Market Volume Billion Forecast, by Type 2019 & 2032
- Table 17: Global Europe SLI Battery Market Revenue Million Forecast, by End-User 2019 & 2032
- Table 18: Global Europe SLI Battery Market Volume Billion Forecast, by End-User 2019 & 2032
- Table 19: Global Europe SLI Battery Market Revenue Million Forecast, by Country 2019 & 2032
- Table 20: Global Europe SLI Battery Market Volume Billion Forecast, by Country 2019 & 2032
- Table 21: Global Europe SLI Battery Market Revenue Million Forecast, by Type 2019 & 2032
- Table 22: Global Europe SLI Battery Market Volume Billion Forecast, by Type 2019 & 2032
- Table 23: Global Europe SLI Battery Market Revenue Million Forecast, by End-User 2019 & 2032
- Table 24: Global Europe SLI Battery Market Volume Billion Forecast, by End-User 2019 & 2032
- Table 25: Global Europe SLI Battery Market Revenue Million Forecast, by Country 2019 & 2032
- Table 26: Global Europe SLI Battery Market Volume Billion Forecast, by Country 2019 & 2032
- Table 27: Global Europe SLI Battery Market Revenue Million Forecast, by Type 2019 & 2032
- Table 28: Global Europe SLI Battery Market Volume Billion Forecast, by Type 2019 & 2032
- Table 29: Global Europe SLI Battery Market Revenue Million Forecast, by End-User 2019 & 2032
- Table 30: Global Europe SLI Battery Market Volume Billion Forecast, by End-User 2019 & 2032
- Table 31: Global Europe SLI Battery Market Revenue Million Forecast, by Country 2019 & 2032
- Table 32: Global Europe SLI Battery Market Volume Billion Forecast, by Country 2019 & 2032
- Table 33: Global Europe SLI Battery Market Revenue Million Forecast, by Type 2019 & 2032
- Table 34: Global Europe SLI Battery Market Volume Billion Forecast, by Type 2019 & 2032
- Table 35: Global Europe SLI Battery Market Revenue Million Forecast, by End-User 2019 & 2032
- Table 36: Global Europe SLI Battery Market Volume Billion Forecast, by End-User 2019 & 2032
- Table 37: Global Europe SLI Battery Market Revenue Million Forecast, by Country 2019 & 2032
- Table 38: Global Europe SLI Battery Market Volume Billion Forecast, by Country 2019 & 2032
- Table 39: Global Europe SLI Battery Market Revenue Million Forecast, by Type 2019 & 2032
- Table 40: Global Europe SLI Battery Market Volume Billion Forecast, by Type 2019 & 2032
- Table 41: Global Europe SLI Battery Market Revenue Million Forecast, by End-User 2019 & 2032
- Table 42: Global Europe SLI Battery Market Volume Billion Forecast, by End-User 2019 & 2032
- Table 43: Global Europe SLI Battery Market Revenue Million Forecast, by Country 2019 & 2032
- Table 44: Global Europe SLI Battery Market Volume Billion Forecast, by Country 2019 & 2032
- Table 45: Global Europe SLI Battery Market Revenue Million Forecast, by Type 2019 & 2032
- Table 46: Global Europe SLI Battery Market Volume Billion Forecast, by Type 2019 & 2032
- Table 47: Global Europe SLI Battery Market Revenue Million Forecast, by End-User 2019 & 2032
- Table 48: Global Europe SLI Battery Market Volume Billion Forecast, by End-User 2019 & 2032
- Table 49: Global Europe SLI Battery Market Revenue Million Forecast, by Country 2019 & 2032
- Table 50: Global Europe SLI Battery Market Volume Billion Forecast, by Country 2019 & 2032
- Table 51: Global Europe SLI Battery Market Revenue Million Forecast, by Type 2019 & 2032
- Table 52: Global Europe SLI Battery Market Volume Billion Forecast, by Type 2019 & 2032
- Table 53: Global Europe SLI Battery Market Revenue Million Forecast, by End-User 2019 & 2032
- Table 54: Global Europe SLI Battery Market Volume Billion Forecast, by End-User 2019 & 2032
- Table 55: Global Europe SLI Battery Market Revenue Million Forecast, by Country 2019 & 2032
- Table 56: Global Europe SLI Battery Market Volume Billion Forecast, by Country 2019 & 2032
- Table 57: Global Europe SLI Battery Market Revenue Million Forecast, by Type 2019 & 2032
- Table 58: Global Europe SLI Battery Market Volume Billion Forecast, by Type 2019 & 2032
- Table 59: Global Europe SLI Battery Market Revenue Million Forecast, by End-User 2019 & 2032
- Table 60: Global Europe SLI Battery Market Volume Billion Forecast, by End-User 2019 & 2032
- Table 61: Global Europe SLI Battery Market Revenue Million Forecast, by Country 2019 & 2032
- Table 62: Global Europe SLI Battery Market Volume Billion Forecast, by Country 2019 & 2032
Frequently Asked Questions
1. What is the projected Compound Annual Growth Rate (CAGR) of the Europe SLI Battery Market?
The projected CAGR is approximately 4.08%.
2. Which companies are prominent players in the Europe SLI Battery Market?
Key companies in the market include GS Yuasa International Ltd, Exide Technologies, Johnson Controls, EnerSys, Leoch International Technology Limited Inc, East Penn Manufacturing Company, C&D Technologies Inc, Clarios International Inc, Trojan Battery Company, Crown Battery Manufacturing Company*List Not Exhaustive 6 4 List of Other Prominent Companies6 5 Market Ranking/Share (%) Analysi.
3. What are the main segments of the Europe SLI Battery Market?
The market segments include Type, End-User.
4. Can you provide details about the market size?
The market size is estimated to be USD 6.5 Million as of 2022.
5. What are some drivers contributing to market growth?
4.; Increasing Adoption of Motor Vehicles4.; Growing Demand for SLI Batteries from Industrial and Agricultural Applications.
6. What are the notable trends driving market growth?
Automotive End User Industry to Witness Significant Growth.
7. Are there any restraints impacting market growth?
4.; Increasing Adoption of Motor Vehicles4.; Growing Demand for SLI Batteries from Industrial and Agricultural Applications.
8. Can you provide examples of recent developments in the market?
In February 2024, Euro Energy Resources Limited will unveil its latest breakthroughs in Valve-regulated Lead Acid (VRLA) batteries, redefining power storage benchmarks. The company's VRLA lineup includes gel cell and absorbed glass mat (AGM) variants tailored for diverse applications, spanning from high-power vehicle needs for SLI applications to deep-cycle demands in renewable energy storage.
9. What pricing options are available for accessing the report?
Pricing options include single-user, multi-user, and enterprise licenses priced at USD 4750, USD 5250, and USD 8750 respectively.
10. Is the market size provided in terms of value or volume?
The market size is provided in terms of value, measured in Million and volume, measured in Billion.
11. Are there any specific market keywords associated with the report?
Yes, the market keyword associated with the report is "Europe SLI Battery Market," which aids in identifying and referencing the specific market segment covered.
12. How do I determine which pricing option suits my needs best?
The pricing options vary based on user requirements and access needs. Individual users may opt for single-user licenses, while businesses requiring broader access may choose multi-user or enterprise licenses for cost-effective access to the report.
13. Are there any additional resources or data provided in the Europe SLI Battery Market report?
While the report offers comprehensive insights, it's advisable to review the specific contents or supplementary materials provided to ascertain if additional resources or data are available.
14. How can I stay updated on further developments or reports in the Europe SLI Battery Market?
To stay informed about further developments, trends, and reports in the Europe SLI Battery Market, consider subscribing to industry newsletters, following relevant companies and organizations, or regularly checking reputable industry news sources and publications.
Methodology
Step 1 - Identification of Relevant Samples Size from Population Database


Step 2 - Approaches for Defining Global Market Size (Value, Volume* & Price*)

Note*: In applicable scenarios
Step 3 - Data Sources
Primary Research
- Web Analytics
- Survey Reports
- Research Institute
- Latest Research Reports
- Opinion Leaders
Secondary Research
- Annual Reports
- White Paper
- Latest Press Release
- Industry Association
- Paid Database
- Investor Presentations

Step 4 - Data Triangulation
Involves using different sources of information in order to increase the validity of a study
These sources are likely to be stakeholders in a program - participants, other researchers, program staff, other community members, and so on.
Then we put all data in single framework & apply various statistical tools to find out the dynamic on the market.
During the analysis stage, feedback from the stakeholder groups would be compared to determine areas of agreement as well as areas of divergence


