
Key Insights
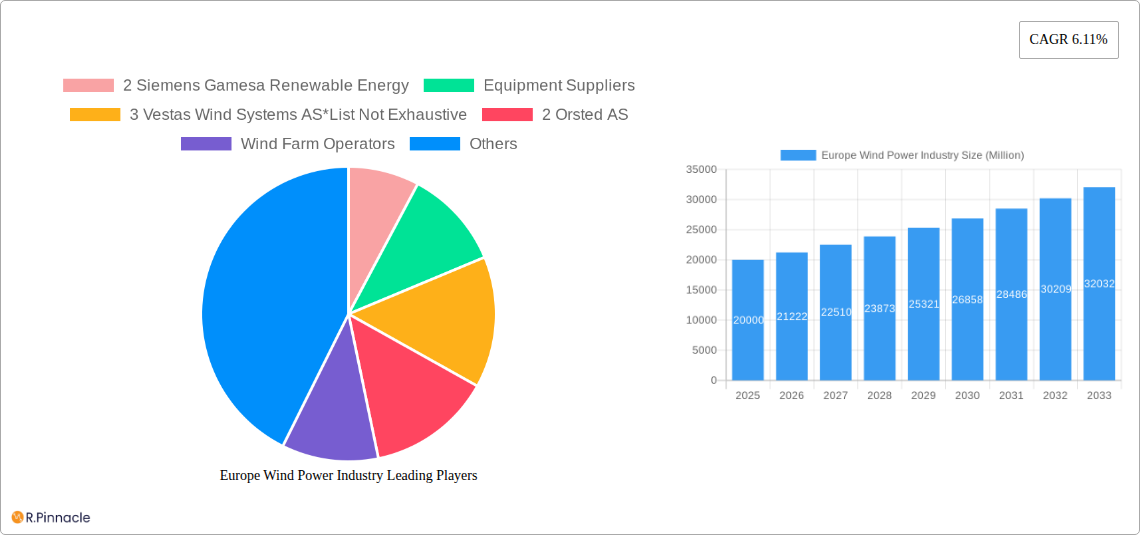
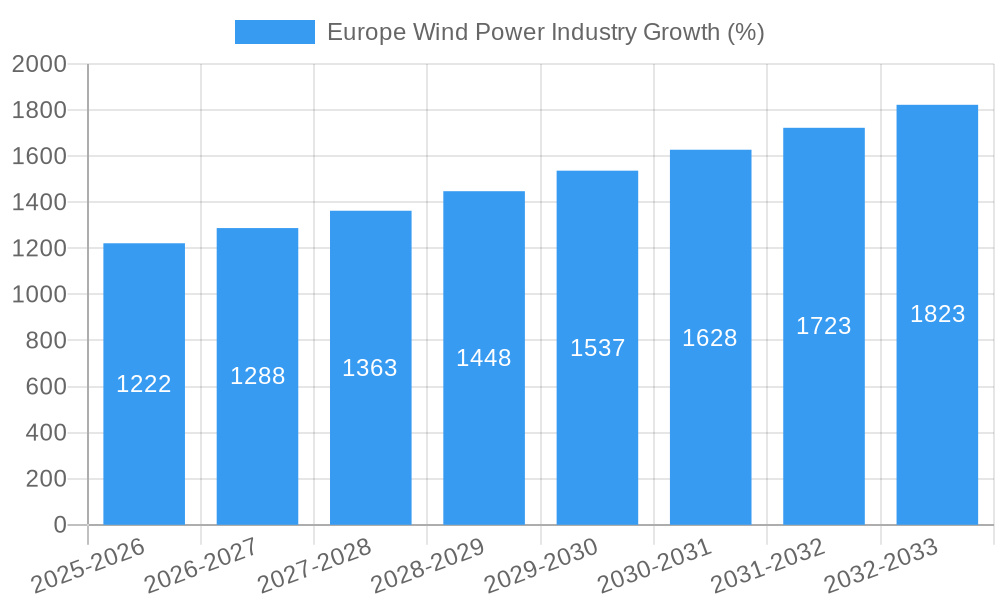
The European wind power industry is experiencing robust growth, driven by the EU's ambitious renewable energy targets and the increasing urgency to mitigate climate change. With a current CAGR of 6.11%, the market, valued at an estimated €XX million in 2025 (assuming a logical extrapolation from available data and considering similar market growth in other regions), is projected to expand significantly through 2033. Key drivers include supportive government policies like subsidies and tax incentives, falling wind turbine costs, technological advancements leading to higher efficiency and capacity factors, and growing public and corporate demand for clean energy. Furthermore, the offshore wind segment is poised for particularly rapid expansion, driven by substantial untapped potential in the North Sea and other coastal waters. Germany, the UK, France, and other Northern European countries are leading the charge in offshore wind development, attracting significant investments and creating numerous jobs.
However, the industry faces some challenges. Grid infrastructure limitations can hinder the integration of large-scale wind farms into the electricity grid. Permitting processes and environmental concerns related to offshore wind farm construction can cause delays and cost overruns. Furthermore, fluctuations in energy prices and the intermittent nature of wind power require the development of advanced energy storage solutions and smart grid technologies for efficient integration. Despite these constraints, the long-term outlook for the European wind power market remains exceptionally positive, fueled by unwavering policy support, technological innovation, and the rising need for sustainable energy solutions. Major players like Siemens Gamesa Renewable Energy, Vestas Wind Systems AS, Orsted AS, EDF SA, General Electric, E.ON SE, and Acciona Energia SA are actively involved in shaping this dynamic market, competing fiercely and continuously innovating to gain market share. The expansion of the wind power sector will create significant economic opportunities and further establish Europe as a global leader in renewable energy.
Europe Wind Power Industry Report: 2019-2033
This comprehensive report provides an in-depth analysis of the European wind power industry, covering market structure, dynamics, key players, and future outlook. With a study period spanning 2019-2033, a base year of 2025, and a forecast period of 2025-2033, this report offers invaluable insights for industry professionals, investors, and policymakers. The report leverages extensive data and analysis to project a xx Million market value by 2033, showcasing significant growth opportunities.
Europe Wind Power Industry Market Structure & Innovation Trends
This section analyzes the competitive landscape, innovation drivers, and regulatory influences shaping the European wind power market. We examine market concentration, revealing the dominance of key players like Siemens Gamesa Renewable Energy and Vestas Wind Systems AS, while also considering the influence of smaller, specialized firms. Market share data for 2024 will be presented, showing the percentage held by top players. Furthermore, the report details M&A activities, including deal values (e.g., xx Million for significant transactions during the historical period), highlighting strategic shifts in the industry. Regulatory frameworks impacting development and deployment will also be extensively examined. The impact of product substitutes (e.g., solar power) will also be discussed alongside end-user demographics and their changing energy needs.
- Market Concentration: Analysis of market share distribution amongst major players.
- Innovation Drivers: Exploration of technological advancements, R&D investments, and government incentives.
- Regulatory Framework: Detailed analysis of EU and national-level policies impacting the wind energy sector.
- M&A Activity: Review of significant mergers and acquisitions, with analysis of their impact on market dynamics.
Europe Wind Power Industry Market Dynamics & Trends
This section delves into the key factors driving market growth, technological disruptions, and evolving consumer preferences. We project a Compound Annual Growth Rate (CAGR) of xx% for the forecast period (2025-2033), supported by analysis of market penetration rates across different segments and countries. The competitive dynamics, including pricing strategies, technological advantages, and market share battles, are detailed and provide valuable market intelligence. The impact of global events, such as the energy crisis and push for renewable energy transition, will also be considered.
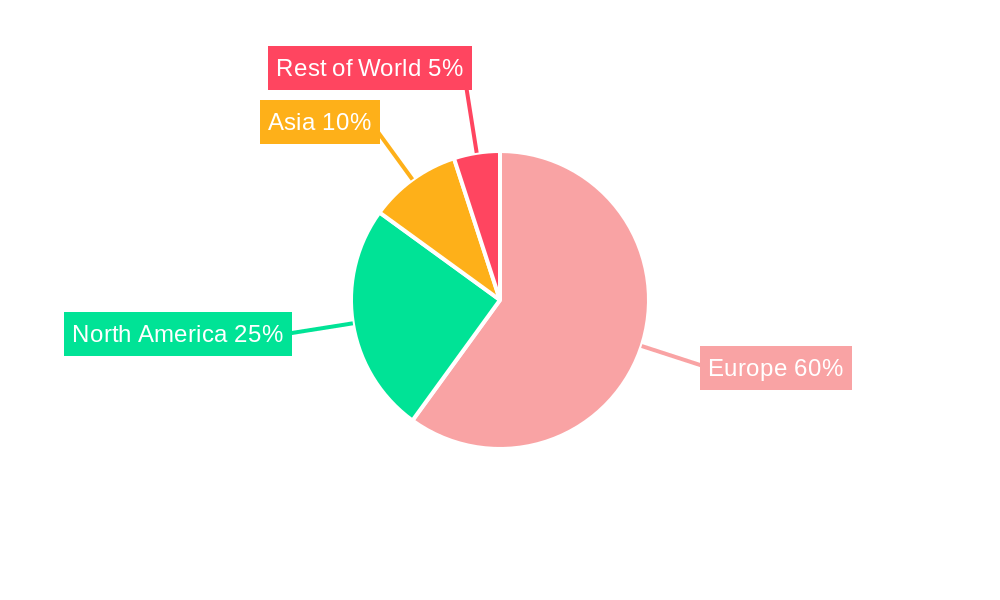
Dominant Regions & Segments in Europe Wind Power Industry
This section identifies the leading regions and segments within the European wind power market. A detailed analysis of both onshore and offshore wind power sectors is conducted to understand the drivers of their relative success. This includes economic policies supporting renewable energy projects, the development and cost of grid infrastructure, and favorable geographical conditions (e.g., consistent wind speeds).
Onshore Wind Power:
- Key Drivers: Government subsidies, land availability, and established grid infrastructure.
- Dominance Analysis: Identifying leading countries and their contributions to market share.
Offshore Wind Power:
- Key Drivers: High wind speeds, potential for large-scale projects, and increasing government support.
- Dominance Analysis: Identifying leading countries and their contributions to market share.
Europe Wind Power Industry Product Innovations
This section examines recent product developments and innovations, emphasizing technological advancements that enhance efficiency, reduce costs, and improve the performance of wind turbines and associated technologies. The analysis focuses on how these innovations provide competitive advantages and improve market fit.
Report Scope & Segmentation Analysis
This report segments the European wind power market by location (onshore and offshore). Each segment's growth projections, market size for 2025 and competitive dynamics are extensively analyzed. The report provides detailed information on the current and predicted sizes of the onshore and offshore segments, along with their respective growth trajectories over the forecast period.
- Onshore Wind Power: Market size, growth projections, and competitive landscape analysis.
- Offshore Wind Power: Market size, growth projections, and competitive landscape analysis.
Key Drivers of Europe Wind Power Industry Growth
Several factors fuel the expansion of the European wind power industry. These include supportive government policies (e.g., renewable energy targets and feed-in tariffs), decreasing technology costs (leading to increased affordability), and rising demand for clean energy sources. Technological advancements, particularly in turbine design and energy storage, also contribute significantly.
Challenges in the Europe Wind Power Industry Sector
Despite substantial growth potential, the European wind power industry faces challenges. Grid integration issues create bottlenecks for new project development. Supply chain disruptions caused by global events can impact the availability of critical components. Intense competition, both domestically and from international players, also presents a significant challenge. Furthermore, permitting and regulatory hurdles add to project development timelines. These challenges have a quantifiable impact on the cost and efficiency of wind power generation.
Emerging Opportunities in Europe Wind Power Industry
The European wind power market presents several opportunities. The expansion of offshore wind farms, particularly in deeper waters, offers significant untapped potential. Technological advancements, such as advanced energy storage solutions and smart grids, will create new market segments. Increased demand from corporations seeking carbon-neutral operations, as exemplified by Google's recent deal with Ørsted, represents a growing market segment.
Leading Players in the Europe Wind Power Industry Market
- Siemens Gamesa Renewable Energy
- Vestas Wind Systems AS
- Orsted AS
- EDF SA
- General Electric Company
- E.ON SE
- Acciona Energia SA
Key Developments in Europe Wind Power Industry
- November 2021: Google's 50 MW Corporate Power Purchase Agreement (CPPA) with Ørsted for offshore wind power in the German North Sea signifies growing corporate demand for renewable energy. This agreement contributes to Google's goal of carbon-free data centers by 2030.
- August 2022: EDF Renewables and Budimex's memorandum of understanding to jointly develop offshore wind farms in Poland signals further expansion of the offshore wind sector in Central Europe.
Future Outlook for Europe Wind Power Industry Market
The European wind power market is poised for significant growth driven by increasing policy support, technological advancements, and rising consumer demand for clean energy. The expansion into offshore wind, coupled with technological improvements to enhance efficiency and reduce costs, will be major growth accelerators. Strategic partnerships and collaborations among industry players will further drive market expansion and innovation.
Europe Wind Power Industry Segmentation
-
1. Location
- 1.1. Onshore
- 1.2. Offshore
Europe Wind Power Industry Segmentation By Geography
- 1. Germany
- 2. United Kingdom
- 3. France
- 4. Italy
- 5. Spain
- 6. Rest of Europe
Europe Wind Power Industry REPORT HIGHLIGHTS
| Aspects | Details |
|---|---|
| Study Period | 2019-2033 |
| Base Year | 2024 |
| Estimated Year | 2025 |
| Forecast Period | 2025-2033 |
| Historical Period | 2019-2024 |
| Growth Rate | CAGR of 6.11% from 2019-2033 |
| Segmentation |
|
Table of Contents
- 1. Introduction
- 1.1. Research Scope
- 1.2. Market Segmentation
- 1.3. Research Methodology
- 1.4. Definitions and Assumptions
- 2. Executive Summary
- 2.1. Introduction
- 3. Market Dynamics
- 3.1. Introduction
- 3.2. Market Drivers
- 3.2.1. 4.; Increasing Investments in Offshore Wind Power Projects4.; Supportive Government Policies
- 3.3. Market Restrains
- 3.3.1. 4.; Increasing Adopting of Alternative Clean Energy Sources (Ex
- 3.4. Market Trends
- 3.4.1. Offshore Segment to Witness Significant Growth in the Market
- 4. Market Factor Analysis
- 4.1. Porters Five Forces
- 4.2. Supply/Value Chain
- 4.3. PESTEL analysis
- 4.4. Market Entropy
- 4.5. Patent/Trademark Analysis
- 5. Europe Wind Power Industry Analysis, Insights and Forecast, 2019-2031
- 5.1. Market Analysis, Insights and Forecast - by Location
- 5.1.1. Onshore
- 5.1.2. Offshore
- 5.2. Market Analysis, Insights and Forecast - by Region
- 5.2.1. Germany
- 5.2.2. United Kingdom
- 5.2.3. France
- 5.2.4. Italy
- 5.2.5. Spain
- 5.2.6. Rest of Europe
- 5.1. Market Analysis, Insights and Forecast - by Location
- 6. Germany Europe Wind Power Industry Analysis, Insights and Forecast, 2019-2031
- 6.1. Market Analysis, Insights and Forecast - by Location
- 6.1.1. Onshore
- 6.1.2. Offshore
- 6.1. Market Analysis, Insights and Forecast - by Location
- 7. United Kingdom Europe Wind Power Industry Analysis, Insights and Forecast, 2019-2031
- 7.1. Market Analysis, Insights and Forecast - by Location
- 7.1.1. Onshore
- 7.1.2. Offshore
- 7.1. Market Analysis, Insights and Forecast - by Location
- 8. France Europe Wind Power Industry Analysis, Insights and Forecast, 2019-2031
- 8.1. Market Analysis, Insights and Forecast - by Location
- 8.1.1. Onshore
- 8.1.2. Offshore
- 8.1. Market Analysis, Insights and Forecast - by Location
- 9. Italy Europe Wind Power Industry Analysis, Insights and Forecast, 2019-2031
- 9.1. Market Analysis, Insights and Forecast - by Location
- 9.1.1. Onshore
- 9.1.2. Offshore
- 9.1. Market Analysis, Insights and Forecast - by Location
- 10. Spain Europe Wind Power Industry Analysis, Insights and Forecast, 2019-2031
- 10.1. Market Analysis, Insights and Forecast - by Location
- 10.1.1. Onshore
- 10.1.2. Offshore
- 10.1. Market Analysis, Insights and Forecast - by Location
- 11. Rest of Europe Europe Wind Power Industry Analysis, Insights and Forecast, 2019-2031
- 11.1. Market Analysis, Insights and Forecast - by Location
- 11.1.1. Onshore
- 11.1.2. Offshore
- 11.1. Market Analysis, Insights and Forecast - by Location
- 12. Germany Europe Wind Power Industry Analysis, Insights and Forecast, 2019-2031
- 13. France Europe Wind Power Industry Analysis, Insights and Forecast, 2019-2031
- 14. Italy Europe Wind Power Industry Analysis, Insights and Forecast, 2019-2031
- 15. United Kingdom Europe Wind Power Industry Analysis, Insights and Forecast, 2019-2031
- 16. Netherlands Europe Wind Power Industry Analysis, Insights and Forecast, 2019-2031
- 17. Sweden Europe Wind Power Industry Analysis, Insights and Forecast, 2019-2031
- 18. Rest of Europe Europe Wind Power Industry Analysis, Insights and Forecast, 2019-2031
- 19. Competitive Analysis
- 19.1. Market Share Analysis 2024
- 19.2. Company Profiles
- 19.2.1 2 Siemens Gamesa Renewable Energy
- 19.2.1.1. Overview
- 19.2.1.2. Products
- 19.2.1.3. SWOT Analysis
- 19.2.1.4. Recent Developments
- 19.2.1.5. Financials (Based on Availability)
- 19.2.2 Equipment Suppliers
- 19.2.2.1. Overview
- 19.2.2.2. Products
- 19.2.2.3. SWOT Analysis
- 19.2.2.4. Recent Developments
- 19.2.2.5. Financials (Based on Availability)
- 19.2.3 3 Vestas Wind Systems AS*List Not Exhaustive
- 19.2.3.1. Overview
- 19.2.3.2. Products
- 19.2.3.3. SWOT Analysis
- 19.2.3.4. Recent Developments
- 19.2.3.5. Financials (Based on Availability)
- 19.2.4 2 Orsted AS
- 19.2.4.1. Overview
- 19.2.4.2. Products
- 19.2.4.3. SWOT Analysis
- 19.2.4.4. Recent Developments
- 19.2.4.5. Financials (Based on Availability)
- 19.2.5 Wind Farm Operators
- 19.2.5.1. Overview
- 19.2.5.2. Products
- 19.2.5.3. SWOT Analysis
- 19.2.5.4. Recent Developments
- 19.2.5.5. Financials (Based on Availability)
- 19.2.6 3 EDF SA
- 19.2.6.1. Overview
- 19.2.6.2. Products
- 19.2.6.3. SWOT Analysis
- 19.2.6.4. Recent Developments
- 19.2.6.5. Financials (Based on Availability)
- 19.2.7 1 General Electric Company
- 19.2.7.1. Overview
- 19.2.7.2. Products
- 19.2.7.3. SWOT Analysis
- 19.2.7.4. Recent Developments
- 19.2.7.5. Financials (Based on Availability)
- 19.2.8 4 E ON SE
- 19.2.8.1. Overview
- 19.2.8.2. Products
- 19.2.8.3. SWOT Analysis
- 19.2.8.4. Recent Developments
- 19.2.8.5. Financials (Based on Availability)
- 19.2.9 1 Acciona Energia SA
- 19.2.9.1. Overview
- 19.2.9.2. Products
- 19.2.9.3. SWOT Analysis
- 19.2.9.4. Recent Developments
- 19.2.9.5. Financials (Based on Availability)
- 19.2.1 2 Siemens Gamesa Renewable Energy
List of Figures
- Figure 1: Europe Wind Power Industry Revenue Breakdown (Million, %) by Product 2024 & 2032
- Figure 2: Europe Wind Power Industry Share (%) by Company 2024
List of Tables
- Table 1: Europe Wind Power Industry Revenue Million Forecast, by Region 2019 & 2032
- Table 2: Europe Wind Power Industry Volume Thousand Forecast, by Region 2019 & 2032
- Table 3: Europe Wind Power Industry Revenue Million Forecast, by Location 2019 & 2032
- Table 4: Europe Wind Power Industry Volume Thousand Forecast, by Location 2019 & 2032
- Table 5: Europe Wind Power Industry Revenue Million Forecast, by Region 2019 & 2032
- Table 6: Europe Wind Power Industry Volume Thousand Forecast, by Region 2019 & 2032
- Table 7: Europe Wind Power Industry Revenue Million Forecast, by Country 2019 & 2032
- Table 8: Europe Wind Power Industry Volume Thousand Forecast, by Country 2019 & 2032
- Table 9: Germany Europe Wind Power Industry Revenue (Million) Forecast, by Application 2019 & 2032
- Table 10: Germany Europe Wind Power Industry Volume (Thousand) Forecast, by Application 2019 & 2032
- Table 11: France Europe Wind Power Industry Revenue (Million) Forecast, by Application 2019 & 2032
- Table 12: France Europe Wind Power Industry Volume (Thousand) Forecast, by Application 2019 & 2032
- Table 13: Italy Europe Wind Power Industry Revenue (Million) Forecast, by Application 2019 & 2032
- Table 14: Italy Europe Wind Power Industry Volume (Thousand) Forecast, by Application 2019 & 2032
- Table 15: United Kingdom Europe Wind Power Industry Revenue (Million) Forecast, by Application 2019 & 2032
- Table 16: United Kingdom Europe Wind Power Industry Volume (Thousand) Forecast, by Application 2019 & 2032
- Table 17: Netherlands Europe Wind Power Industry Revenue (Million) Forecast, by Application 2019 & 2032
- Table 18: Netherlands Europe Wind Power Industry Volume (Thousand) Forecast, by Application 2019 & 2032
- Table 19: Sweden Europe Wind Power Industry Revenue (Million) Forecast, by Application 2019 & 2032
- Table 20: Sweden Europe Wind Power Industry Volume (Thousand) Forecast, by Application 2019 & 2032
- Table 21: Rest of Europe Europe Wind Power Industry Revenue (Million) Forecast, by Application 2019 & 2032
- Table 22: Rest of Europe Europe Wind Power Industry Volume (Thousand) Forecast, by Application 2019 & 2032
- Table 23: Europe Wind Power Industry Revenue Million Forecast, by Location 2019 & 2032
- Table 24: Europe Wind Power Industry Volume Thousand Forecast, by Location 2019 & 2032
- Table 25: Europe Wind Power Industry Revenue Million Forecast, by Country 2019 & 2032
- Table 26: Europe Wind Power Industry Volume Thousand Forecast, by Country 2019 & 2032
- Table 27: Europe Wind Power Industry Revenue Million Forecast, by Location 2019 & 2032
- Table 28: Europe Wind Power Industry Volume Thousand Forecast, by Location 2019 & 2032
- Table 29: Europe Wind Power Industry Revenue Million Forecast, by Country 2019 & 2032
- Table 30: Europe Wind Power Industry Volume Thousand Forecast, by Country 2019 & 2032
- Table 31: Europe Wind Power Industry Revenue Million Forecast, by Location 2019 & 2032
- Table 32: Europe Wind Power Industry Volume Thousand Forecast, by Location 2019 & 2032
- Table 33: Europe Wind Power Industry Revenue Million Forecast, by Country 2019 & 2032
- Table 34: Europe Wind Power Industry Volume Thousand Forecast, by Country 2019 & 2032
- Table 35: Europe Wind Power Industry Revenue Million Forecast, by Location 2019 & 2032
- Table 36: Europe Wind Power Industry Volume Thousand Forecast, by Location 2019 & 2032
- Table 37: Europe Wind Power Industry Revenue Million Forecast, by Country 2019 & 2032
- Table 38: Europe Wind Power Industry Volume Thousand Forecast, by Country 2019 & 2032
- Table 39: Europe Wind Power Industry Revenue Million Forecast, by Location 2019 & 2032
- Table 40: Europe Wind Power Industry Volume Thousand Forecast, by Location 2019 & 2032
- Table 41: Europe Wind Power Industry Revenue Million Forecast, by Country 2019 & 2032
- Table 42: Europe Wind Power Industry Volume Thousand Forecast, by Country 2019 & 2032
- Table 43: Europe Wind Power Industry Revenue Million Forecast, by Location 2019 & 2032
- Table 44: Europe Wind Power Industry Volume Thousand Forecast, by Location 2019 & 2032
- Table 45: Europe Wind Power Industry Revenue Million Forecast, by Country 2019 & 2032
- Table 46: Europe Wind Power Industry Volume Thousand Forecast, by Country 2019 & 2032
Frequently Asked Questions
1. What is the projected Compound Annual Growth Rate (CAGR) of the Europe Wind Power Industry?
The projected CAGR is approximately 6.11%.
2. Which companies are prominent players in the Europe Wind Power Industry?
Key companies in the market include 2 Siemens Gamesa Renewable Energy, Equipment Suppliers, 3 Vestas Wind Systems AS*List Not Exhaustive, 2 Orsted AS, Wind Farm Operators, 3 EDF SA, 1 General Electric Company, 4 E ON SE, 1 Acciona Energia SA.
3. What are the main segments of the Europe Wind Power Industry?
The market segments include Location.
4. Can you provide details about the market size?
The market size is estimated to be USD XX Million as of 2022.
5. What are some drivers contributing to market growth?
4.; Increasing Investments in Offshore Wind Power Projects4.; Supportive Government Policies.
6. What are the notable trends driving market growth?
Offshore Segment to Witness Significant Growth in the Market.
7. Are there any restraints impacting market growth?
4.; Increasing Adopting of Alternative Clean Energy Sources (Ex: Solar. Hydro).
8. Can you provide examples of recent developments in the market?
November 2021: Google signed up for 50 MW of wind power to be delivered from an offshore wind farm built by Danish energy giant Ørsted in the German North Sea. The 12-year Corporate Power Purchase Agreement (CPPA) will contribute to Google's commitment to operating all data centers with carbon-free energy by 2030.
9. What pricing options are available for accessing the report?
Pricing options include single-user, multi-user, and enterprise licenses priced at USD 4750, USD 5250, and USD 8750 respectively.
10. Is the market size provided in terms of value or volume?
The market size is provided in terms of value, measured in Million and volume, measured in Thousand.
11. Are there any specific market keywords associated with the report?
Yes, the market keyword associated with the report is "Europe Wind Power Industry," which aids in identifying and referencing the specific market segment covered.
12. How do I determine which pricing option suits my needs best?
The pricing options vary based on user requirements and access needs. Individual users may opt for single-user licenses, while businesses requiring broader access may choose multi-user or enterprise licenses for cost-effective access to the report.
13. Are there any additional resources or data provided in the Europe Wind Power Industry report?
While the report offers comprehensive insights, it's advisable to review the specific contents or supplementary materials provided to ascertain if additional resources or data are available.
14. How can I stay updated on further developments or reports in the Europe Wind Power Industry?
To stay informed about further developments, trends, and reports in the Europe Wind Power Industry, consider subscribing to industry newsletters, following relevant companies and organizations, or regularly checking reputable industry news sources and publications.
Methodology
Step 1 - Identification of Relevant Samples Size from Population Database


Step 2 - Approaches for Defining Global Market Size (Value, Volume* & Price*)

Note*: In applicable scenarios
Step 3 - Data Sources
Primary Research
- Web Analytics
- Survey Reports
- Research Institute
- Latest Research Reports
- Opinion Leaders
Secondary Research
- Annual Reports
- White Paper
- Latest Press Release
- Industry Association
- Paid Database
- Investor Presentations

Step 4 - Data Triangulation
Involves using different sources of information in order to increase the validity of a study
These sources are likely to be stakeholders in a program - participants, other researchers, program staff, other community members, and so on.
Then we put all data in single framework & apply various statistical tools to find out the dynamic on the market.
During the analysis stage, feedback from the stakeholder groups would be compared to determine areas of agreement as well as areas of divergence


