

Key Insights
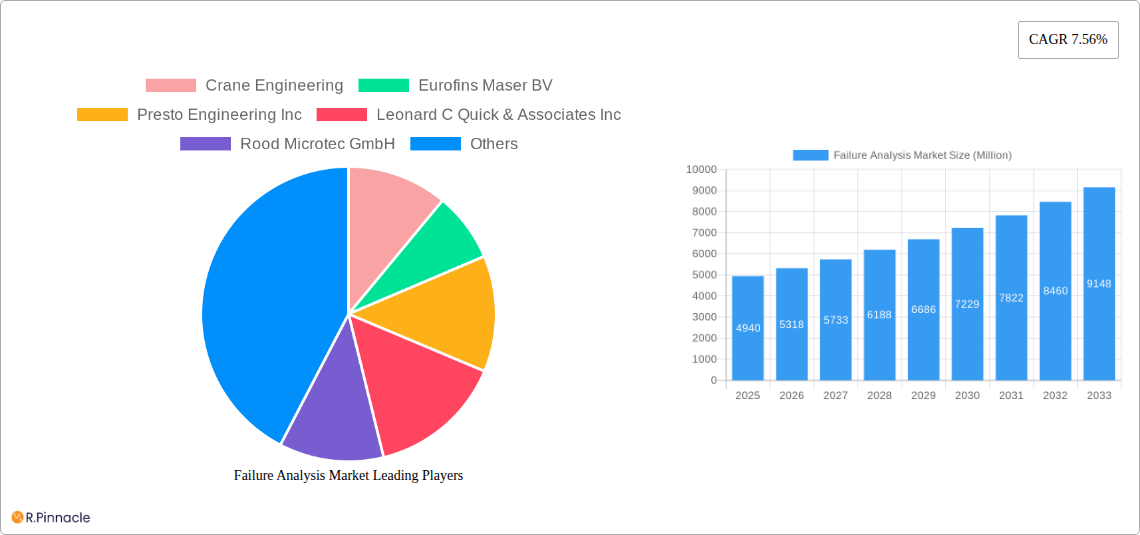
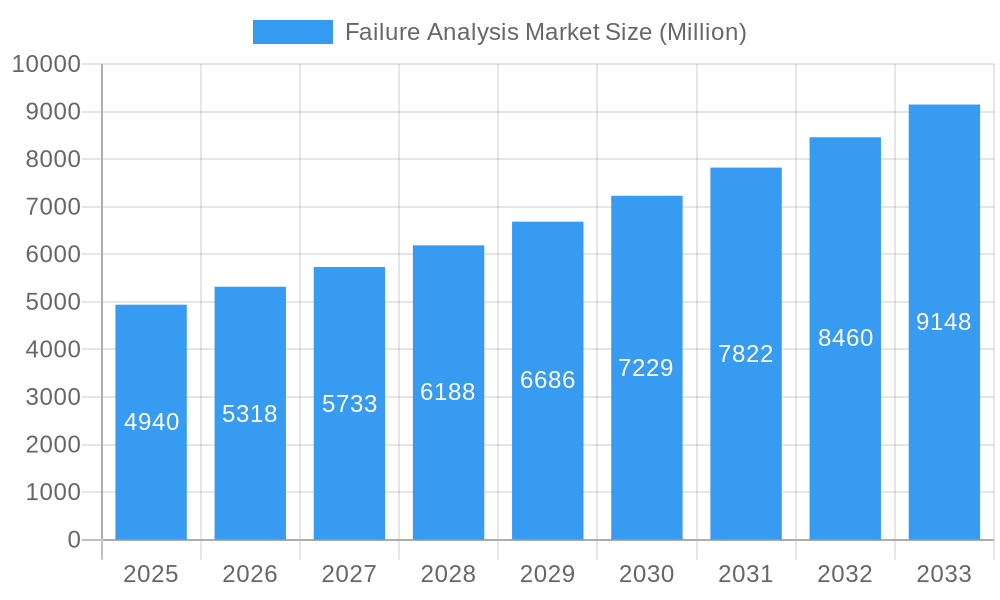
The Failure Analysis market, valued at $4.94 billion in 2025, is projected to experience robust growth, driven by increasing demand for advanced materials across diverse sectors. The Compound Annual Growth Rate (CAGR) of 7.56% from 2025 to 2033 indicates a significant expansion of the market. Key drivers include the rising need for quality control and product reliability in industries like automotive, electronics and semiconductors, and oil and gas. The increasing complexity of electronic components and the demand for miniaturization necessitate sophisticated failure analysis techniques to ensure product performance and safety. Technological advancements in areas like Scanning Electron Microscopy (SEM), Focused Ion Beam (FIB), and advanced spectroscopic techniques are further fueling market growth. While specific regional breakdowns are missing, it's reasonable to assume North America and Europe will hold significant market shares initially, given their established manufacturing bases and technology adoption rates. Asia is anticipated to witness the fastest growth, driven by expanding manufacturing activities and investments in technological infrastructure. Growth may be slightly constrained by high equipment costs and the need for specialized expertise, however, the overall market outlook remains positive due to the critical role failure analysis plays in enhancing product quality and reducing production losses across a wide range of industries.
Failure Analysis Market Market Size (In Billion)
The segmentation of the Failure Analysis market reveals diverse opportunities. The equipment segment, encompassing SEM, TEM, FIB, and dual-beam systems, shows significant potential due to the continuous development of more advanced and higher-resolution instruments. Similarly, the end-user vertical segment indicates significant opportunities within the automotive, electronics, and oil & gas sectors, where product reliability and safety are paramount. Technological advancements in Secondary Ion Mass Spectrometry (SIMS), Energy Dispersive X-ray Spectroscopy (EDX), and other techniques are crucial for improving analysis capabilities and driving market growth. The competitive landscape includes a mix of established players and specialized service providers, highlighting both the consolidated and fragmented nature of this market. Overall, the failure analysis market is poised for continued expansion, driven by technological innovation, increasing product complexity, and the imperative to ensure product quality and safety across various industry verticals.
Failure Analysis Market Company Market Share
Failure Analysis Market: A Comprehensive Report (2019-2033)
This comprehensive report provides an in-depth analysis of the Failure Analysis Market, offering invaluable insights for industry professionals, investors, and strategic decision-makers. With a detailed study period spanning from 2019 to 2033 (base year 2025, forecast period 2025-2033), this report leverages robust data and expert analysis to present a clear picture of current market dynamics and future growth projections. The market is segmented by equipment, end-user vertical, and technology, providing granular detail to facilitate informed strategic planning. The report values are expressed in Millions.
Failure Analysis Market Structure & Innovation Trends
The Failure Analysis market exhibits a moderately consolidated structure, with key players holding significant market share. The top 10 companies, including Crane Engineering, Eurofins Maser BV, Presto Engineering Inc, Leonard C Quick & Associates Inc, Rood Microtec GmbH, McDowell Owens Engineering Inc, NanoScope Services Ltd, Exponent Inc, CoreTest Technologies, and Eurofins EAG Laboratories, collectively account for approximately xx% of the global market share in 2025. Market concentration is influenced by factors such as technological expertise, established client bases, and strategic acquisitions.
Innovation in the Failure Analysis market is driven by advancements in microscopy techniques (SEM, TEM, FIB), spectroscopy (SIMS, EDX), and other analytical methods. Regulatory frameworks, particularly concerning environmental compliance and product safety, play a vital role in shaping market trends. Product substitutes, such as less expensive testing methods, pose a competitive challenge, while the increasing complexity of modern materials and manufacturing processes fuels demand for sophisticated failure analysis services.
M&A activity has been significant, with deal values exceeding xx Million in the past five years. These acquisitions have primarily aimed at expanding geographical reach, gaining access to new technologies, and strengthening market share. For example, the acquisition of [Company A] by [Company B] in [Year] significantly altered market dynamics in [Specific Region/Segment]. The increasing demand for faster turnaround time and more sophisticated analysis also influences mergers and acquisitions.
- Market Concentration: xx% by top 10 players in 2025
- M&A Deal Value (2019-2024): Over xx Million
- Key Innovation Drivers: Advanced microscopy, spectroscopy, and analytical methods
- Regulatory Influence: Environmental compliance and product safety standards
Failure Analysis Market Dynamics & Trends
The Failure Analysis market is experiencing robust growth, driven by the increasing complexity of manufactured products, rising demand for quality control and assurance, and a growing need to understand material failures across diverse industries. The market is projected to exhibit a CAGR of xx% from 2025 to 2033. This growth is fueled by several factors including the increasing adoption of advanced materials in various industries, stringent product quality regulations, and an increasing emphasis on proactive failure prevention. Technological disruptions, particularly the advent of AI and machine learning in data analysis, are enhancing the efficiency and accuracy of failure analysis techniques. This is leading to improved prediction models and faster turnaround times for root cause identification.
Consumer preferences are shifting towards faster and more cost-effective failure analysis solutions, increasing demand for efficient and reliable testing services. This demand, alongside continuous technological advancements, is further driving market expansion.
Competitive dynamics are characterized by both established players and emerging companies vying for market share. The competition is largely based on technological expertise, customer service, turnaround times, and pricing strategies. Market penetration is highest in the Electronics and Semiconductor sectors, followed by the Automotive and Aerospace sectors.
Dominant Regions & Segments in Failure Analysis Market
The North American region currently holds a dominant position in the Failure Analysis market, driven by strong demand from the automotive, electronics, and aerospace industries. Europe and Asia-Pacific follow closely behind, showing strong growth potential.
Key Drivers by Region:
- North America: Strong regulatory environment, high adoption of advanced technologies, and large industrial base.
- Europe: Well-established manufacturing sector, and focus on materials science research.
- Asia-Pacific: Rapid industrialization, increasing manufacturing output, and rising investment in advanced technologies.
Dominant Segments:
- By Equipment: Scanning Electron Microscope (SEM) holds the largest market share due to its versatility and widespread adoption. The Dual Beam System segment is experiencing the fastest growth owing to its ability to perform both imaging and material modification.
- By End-user Vertical: The Electronics and Semiconductors industry is the largest segment, followed by Automotive. The defense industry is seeing significant growth due to the demanding requirements of military and aerospace applications.
- By Technology: Energy Dispersive X-ray Spectroscopy (EDX) dominates due to its wide applicability and cost-effectiveness. Focused Ion Beam (FIB) technology is demonstrating significant growth potential due to its high precision and ability to perform complex material modifications.
Failure Analysis Market Product Innovations
Recent product innovations include the development of automated failure analysis systems, advanced software for data analysis, and the integration of AI and machine learning for faster and more accurate results. These advancements improve efficiency, reduce costs, and enable the analysis of increasingly complex materials and components. The market is seeing a growing trend towards miniaturized and portable equipment suitable for on-site failure analysis, facilitating quick response and reduction in downtime. Such innovations cater to the growing demand for real-time solutions and improved accuracy.
Report Scope & Segmentation Analysis
This report comprehensively segments the Failure Analysis Market across three key dimensions: Equipment, End-user Vertical, and Technology.
By Equipment: Scanning Electron Microscope (SEM), Focused Ion Beam (FIB) System, Transmission Electron Microscope (TEM), Dual Beam System, and Other Equipment. SEM currently holds the largest market share with xx Million, projected to grow to xx Million by 2033. FIB systems are expected to showcase the highest growth rate during the forecast period.
By End-user Vertical: Automotive, Oil and Gas, Defense, Construction, Manufacturing, Electronics and Semiconductors, and Other End-user Verticals. The Electronics and Semiconductors segment represents the largest market share, with xx Million in 2025.
By Technology: Secondary ION Mass Spectrometry (SIMS), Energy Dispersive X-ray Spectroscopy (EDX), Chemical Mechanical Planarization (CMP), Scanning Probe Microscopy, Focused Ion Beam (FIB), Relative Ion Etching (RIE), and Other Technologies. EDX holds the largest market share, and FIB is projected to experience the fastest growth.
Key Drivers of Failure Analysis Market Growth
Several factors fuel the growth of the Failure Analysis market. These include:
- Increasing complexity of products: Modern products are increasingly sophisticated, necessitating advanced analysis techniques.
- Stringent quality control regulations: Governments and industries are implementing stricter regulations, boosting demand for failure analysis.
- Technological advancements: Improvements in microscopy, spectroscopy, and data analysis techniques enhance the accuracy and efficiency of failure analysis.
- Growth of high-growth industries: The expansion of sectors like electronics, semiconductors, and renewable energy increases the need for failure analysis.
Challenges in the Failure Analysis Market Sector
Despite significant growth potential, the Failure Analysis market faces several challenges. These include:
- High cost of equipment and services: The advanced technology required can lead to high costs for both equipment purchase and testing services, limiting market accessibility for smaller enterprises.
- Shortage of skilled professionals: The specialized expertise needed to operate and interpret results limits the availability of qualified technicians, thereby slowing market development.
- Competitive pressures: Established players and emerging competitors lead to fierce competition, influencing pricing strategies and requiring continuous innovation.
Emerging Opportunities in Failure Analysis Market
The Failure Analysis market presents significant opportunities for growth and innovation:
- Integration of AI and machine learning: Automation through AI/ML increases efficiency and accuracy, attracting new market entrants.
- Development of portable and on-site testing equipment: Convenient testing reduces downtime and streamlines workflows.
- Expansion into emerging markets: Growth in developing economies fuels opportunities for new service providers.
- Focus on predictive maintenance: Proactive analysis using failure prediction models minimizes downtime and maintenance costs.
Leading Players in the Failure Analysis Market Market
- Crane Engineering
- Eurofins Maser BV
- Presto Engineering Inc
- Leonard C Quick & Associates Inc
- Rood Microtec GmbH
- McDowell Owens Engineering Inc
- NanoScope Services Ltd
- Exponent Inc
- CoreTest Technologies
- Eurofins EAG Laboratories
- Materials Testing
- TUV SUD
Key Developments in Failure Analysis Market Industry
- June 2024: The Atlanta water main break highlighted the need for advanced infrastructure analysis and materials testing, potentially boosting demand for failure analysis services within the construction and municipal sectors.
- April 2024: The 14ACMOS project demonstrates the increasing demand for highly precise failure analysis techniques in the advanced semiconductor manufacturing industry, driving innovation in equipment and services.
Future Outlook for Failure Analysis Market Market
The Failure Analysis market is poised for continued growth, driven by ongoing technological advancements, increasing demand from diverse industries, and the need for sophisticated quality control and assurance. Strategic opportunities exist in the development of innovative solutions, expansion into new markets, and the adoption of advanced data analytics for predictive maintenance. The market is expected to continue to consolidate with mergers and acquisitions, with larger players seeking to expand their market share and service offerings.
Failure Analysis Market Segmentation
-
1. Technology
- 1.1. Secondary ION Mass Spectrometry (SIMS)
- 1.2. Energy Dispersive X-ray Spectroscopy (EDX)
- 1.3. Chemical Mechanical Planarization (CMP)
- 1.4. Scanning Probe Microscopy
- 1.5. Focused Ion Beam (FIB)
- 1.6. Relative Ion Etching (RIE)
- 1.7. Other Technologies
-
2. Equipment
- 2.1. Scanning Electron Microscope (SEM)
- 2.2. Focused Ion Beam (FIB) System
- 2.3. Transmission Electron Microscope (TEM)
- 2.4. Dual Beam System
- 2.5. Other Equipment
-
3. End-user Vertical
- 3.1. Automotive
- 3.2. Oil and Gas
- 3.3. Defense
- 3.4. Construction
- 3.5. Manufacturing
- 3.6. Electronics and Semiconductors
- 3.7. Other End-user Verticals
Failure Analysis Market Segmentation By Geography
- 1. North America
- 2. Europe
- 3. Asia
- 4. Australia and New Zealand
- 5. Latin America
- 6. Middle East and Africa
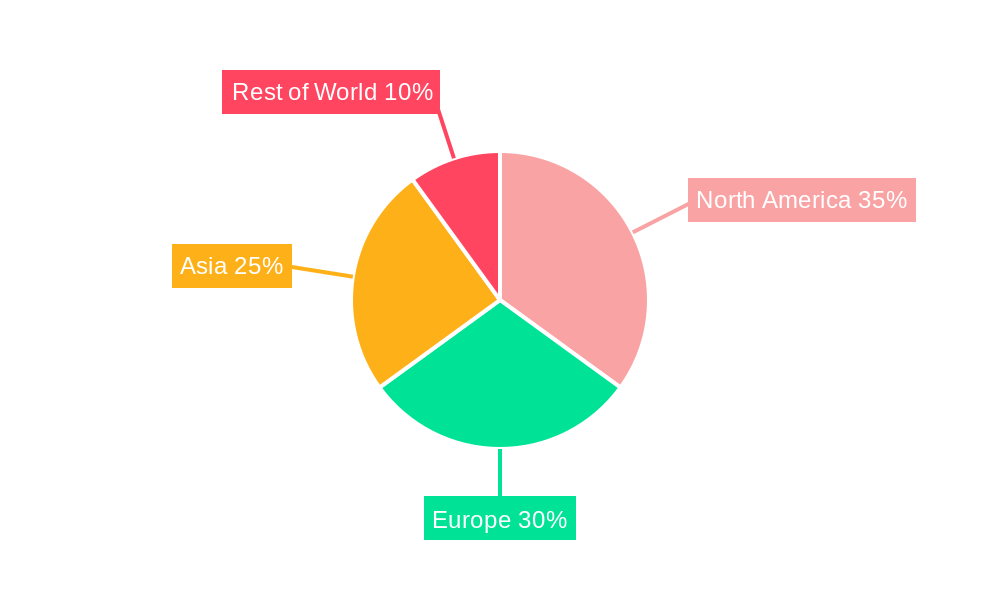
Failure Analysis Market Regional Market Share
Geographic Coverage of Failure Analysis Market
Failure Analysis Market REPORT HIGHLIGHTS
| Aspects | Details |
|---|---|
| Study Period | 2020-2034 |
| Base Year | 2025 |
| Estimated Year | 2026 |
| Forecast Period | 2026-2034 |
| Historical Period | 2020-2025 |
| Growth Rate | CAGR of 7.56% from 2020-2034 |
| Segmentation |
|
Table of Contents
- 1. Introduction
- 1.1. Research Scope
- 1.2. Market Segmentation
- 1.3. Research Objective
- 1.4. Definitions and Assumptions
- 2. Executive Summary
- 2.1. Market Snapshot
- 3. Market Dynamics
- 3.1. Market Drivers
- 3.2. Market Restrains
- 3.3. Market Trends
- 3.4. Market Opportunities
- 4. Market Factor Analysis
- 4.1. Porters Five Forces
- 4.1.1. Bargaining Power of Suppliers
- 4.1.2. Bargaining Power of Buyers
- 4.1.3. Threat of New Entrants
- 4.1.4. Threat of Substitutes
- 4.1.5. Competitive Rivalry
- 4.2. PESTEL analysis
- 4.3. BCG Analysis
- 4.3.1. Stars (High Growth, High Market Share)
- 4.3.2. Cash Cows (Low Growth, High Market Share)
- 4.3.3. Question Mark (High Growth, Low Market Share)
- 4.3.4. Dogs (Low Growth, Low Market Share)
- 4.4. Ansoff Matrix Analysis
- 4.5. Supply Chain Analysis
- 4.6. Regulatory Landscape
- 4.7. Current Market Potential and Opportunity Assessment (TAM–SAM–SOM Framework)
- 4.8. PRI Analyst Note
- 4.1. Porters Five Forces
- 5. Market Analysis, Insights and Forecast 2021-2033
- 5.1. Market Analysis, Insights and Forecast - by Technology
- 5.1.1. Secondary ION Mass Spectrometry (SIMS)
- 5.1.2. Energy Dispersive X-ray Spectroscopy (EDX)
- 5.1.3. Chemical Mechanical Planarization (CMP)
- 5.1.4. Scanning Probe Microscopy
- 5.1.5. Focused Ion Beam (FIB)
- 5.1.6. Relative Ion Etching (RIE)
- 5.1.7. Other Technologies
- 5.2. Market Analysis, Insights and Forecast - by Equipment
- 5.2.1. Scanning Electron Microscope (SEM)
- 5.2.2. Focused Ion Beam (FIB) System
- 5.2.3. Transmission Electron Microscope (TEM)
- 5.2.4. Dual Beam System
- 5.2.5. Other Equipment
- 5.3. Market Analysis, Insights and Forecast - by End-user Vertical
- 5.3.1. Automotive
- 5.3.2. Oil and Gas
- 5.3.3. Defense
- 5.3.4. Construction
- 5.3.5. Manufacturing
- 5.3.6. Electronics and Semiconductors
- 5.3.7. Other End-user Verticals
- 5.4. Market Analysis, Insights and Forecast - by Region
- 5.4.1. North America
- 5.4.2. Europe
- 5.4.3. Asia
- 5.4.4. Australia and New Zealand
- 5.4.5. Latin America
- 5.4.6. Middle East and Africa
- 5.1. Market Analysis, Insights and Forecast - by Technology
- 6. Global Failure Analysis Market Analysis, Insights and Forecast, 2021-2033
- 6.1. Market Analysis, Insights and Forecast - by Technology
- 6.1.1. Secondary ION Mass Spectrometry (SIMS)
- 6.1.2. Energy Dispersive X-ray Spectroscopy (EDX)
- 6.1.3. Chemical Mechanical Planarization (CMP)
- 6.1.4. Scanning Probe Microscopy
- 6.1.5. Focused Ion Beam (FIB)
- 6.1.6. Relative Ion Etching (RIE)
- 6.1.7. Other Technologies
- 6.2. Market Analysis, Insights and Forecast - by Equipment
- 6.2.1. Scanning Electron Microscope (SEM)
- 6.2.2. Focused Ion Beam (FIB) System
- 6.2.3. Transmission Electron Microscope (TEM)
- 6.2.4. Dual Beam System
- 6.2.5. Other Equipment
- 6.3. Market Analysis, Insights and Forecast - by End-user Vertical
- 6.3.1. Automotive
- 6.3.2. Oil and Gas
- 6.3.3. Defense
- 6.3.4. Construction
- 6.3.5. Manufacturing
- 6.3.6. Electronics and Semiconductors
- 6.3.7. Other End-user Verticals
- 6.1. Market Analysis, Insights and Forecast - by Technology
- 7. North America Failure Analysis Market Analysis, Insights and Forecast, 2020-2032
- 7.1. Market Analysis, Insights and Forecast - by Technology
- 7.1.1. Secondary ION Mass Spectrometry (SIMS)
- 7.1.2. Energy Dispersive X-ray Spectroscopy (EDX)
- 7.1.3. Chemical Mechanical Planarization (CMP)
- 7.1.4. Scanning Probe Microscopy
- 7.1.5. Focused Ion Beam (FIB)
- 7.1.6. Relative Ion Etching (RIE)
- 7.1.7. Other Technologies
- 7.2. Market Analysis, Insights and Forecast - by Equipment
- 7.2.1. Scanning Electron Microscope (SEM)
- 7.2.2. Focused Ion Beam (FIB) System
- 7.2.3. Transmission Electron Microscope (TEM)
- 7.2.4. Dual Beam System
- 7.2.5. Other Equipment
- 7.3. Market Analysis, Insights and Forecast - by End-user Vertical
- 7.3.1. Automotive
- 7.3.2. Oil and Gas
- 7.3.3. Defense
- 7.3.4. Construction
- 7.3.5. Manufacturing
- 7.3.6. Electronics and Semiconductors
- 7.3.7. Other End-user Verticals
- 7.1. Market Analysis, Insights and Forecast - by Technology
- 8. Europe Failure Analysis Market Analysis, Insights and Forecast, 2020-2032
- 8.1. Market Analysis, Insights and Forecast - by Technology
- 8.1.1. Secondary ION Mass Spectrometry (SIMS)
- 8.1.2. Energy Dispersive X-ray Spectroscopy (EDX)
- 8.1.3. Chemical Mechanical Planarization (CMP)
- 8.1.4. Scanning Probe Microscopy
- 8.1.5. Focused Ion Beam (FIB)
- 8.1.6. Relative Ion Etching (RIE)
- 8.1.7. Other Technologies
- 8.2. Market Analysis, Insights and Forecast - by Equipment
- 8.2.1. Scanning Electron Microscope (SEM)
- 8.2.2. Focused Ion Beam (FIB) System
- 8.2.3. Transmission Electron Microscope (TEM)
- 8.2.4. Dual Beam System
- 8.2.5. Other Equipment
- 8.3. Market Analysis, Insights and Forecast - by End-user Vertical
- 8.3.1. Automotive
- 8.3.2. Oil and Gas
- 8.3.3. Defense
- 8.3.4. Construction
- 8.3.5. Manufacturing
- 8.3.6. Electronics and Semiconductors
- 8.3.7. Other End-user Verticals
- 8.1. Market Analysis, Insights and Forecast - by Technology
- 9. Asia Failure Analysis Market Analysis, Insights and Forecast, 2020-2032
- 9.1. Market Analysis, Insights and Forecast - by Technology
- 9.1.1. Secondary ION Mass Spectrometry (SIMS)
- 9.1.2. Energy Dispersive X-ray Spectroscopy (EDX)
- 9.1.3. Chemical Mechanical Planarization (CMP)
- 9.1.4. Scanning Probe Microscopy
- 9.1.5. Focused Ion Beam (FIB)
- 9.1.6. Relative Ion Etching (RIE)
- 9.1.7. Other Technologies
- 9.2. Market Analysis, Insights and Forecast - by Equipment
- 9.2.1. Scanning Electron Microscope (SEM)
- 9.2.2. Focused Ion Beam (FIB) System
- 9.2.3. Transmission Electron Microscope (TEM)
- 9.2.4. Dual Beam System
- 9.2.5. Other Equipment
- 9.3. Market Analysis, Insights and Forecast - by End-user Vertical
- 9.3.1. Automotive
- 9.3.2. Oil and Gas
- 9.3.3. Defense
- 9.3.4. Construction
- 9.3.5. Manufacturing
- 9.3.6. Electronics and Semiconductors
- 9.3.7. Other End-user Verticals
- 9.1. Market Analysis, Insights and Forecast - by Technology
- 10. Australia and New Zealand Failure Analysis Market Analysis, Insights and Forecast, 2020-2032
- 10.1. Market Analysis, Insights and Forecast - by Technology
- 10.1.1. Secondary ION Mass Spectrometry (SIMS)
- 10.1.2. Energy Dispersive X-ray Spectroscopy (EDX)
- 10.1.3. Chemical Mechanical Planarization (CMP)
- 10.1.4. Scanning Probe Microscopy
- 10.1.5. Focused Ion Beam (FIB)
- 10.1.6. Relative Ion Etching (RIE)
- 10.1.7. Other Technologies
- 10.2. Market Analysis, Insights and Forecast - by Equipment
- 10.2.1. Scanning Electron Microscope (SEM)
- 10.2.2. Focused Ion Beam (FIB) System
- 10.2.3. Transmission Electron Microscope (TEM)
- 10.2.4. Dual Beam System
- 10.2.5. Other Equipment
- 10.3. Market Analysis, Insights and Forecast - by End-user Vertical
- 10.3.1. Automotive
- 10.3.2. Oil and Gas
- 10.3.3. Defense
- 10.3.4. Construction
- 10.3.5. Manufacturing
- 10.3.6. Electronics and Semiconductors
- 10.3.7. Other End-user Verticals
- 10.1. Market Analysis, Insights and Forecast - by Technology
- 11. Latin America Failure Analysis Market Analysis, Insights and Forecast, 2020-2032
- 11.1. Market Analysis, Insights and Forecast - by Technology
- 11.1.1. Secondary ION Mass Spectrometry (SIMS)
- 11.1.2. Energy Dispersive X-ray Spectroscopy (EDX)
- 11.1.3. Chemical Mechanical Planarization (CMP)
- 11.1.4. Scanning Probe Microscopy
- 11.1.5. Focused Ion Beam (FIB)
- 11.1.6. Relative Ion Etching (RIE)
- 11.1.7. Other Technologies
- 11.2. Market Analysis, Insights and Forecast - by Equipment
- 11.2.1. Scanning Electron Microscope (SEM)
- 11.2.2. Focused Ion Beam (FIB) System
- 11.2.3. Transmission Electron Microscope (TEM)
- 11.2.4. Dual Beam System
- 11.2.5. Other Equipment
- 11.3. Market Analysis, Insights and Forecast - by End-user Vertical
- 11.3.1. Automotive
- 11.3.2. Oil and Gas
- 11.3.3. Defense
- 11.3.4. Construction
- 11.3.5. Manufacturing
- 11.3.6. Electronics and Semiconductors
- 11.3.7. Other End-user Verticals
- 11.1. Market Analysis, Insights and Forecast - by Technology
- 12. Middle East and Africa Failure Analysis Market Analysis, Insights and Forecast, 2020-2032
- 12.1. Market Analysis, Insights and Forecast - by Technology
- 12.1.1. Secondary ION Mass Spectrometry (SIMS)
- 12.1.2. Energy Dispersive X-ray Spectroscopy (EDX)
- 12.1.3. Chemical Mechanical Planarization (CMP)
- 12.1.4. Scanning Probe Microscopy
- 12.1.5. Focused Ion Beam (FIB)
- 12.1.6. Relative Ion Etching (RIE)
- 12.1.7. Other Technologies
- 12.2. Market Analysis, Insights and Forecast - by Equipment
- 12.2.1. Scanning Electron Microscope (SEM)
- 12.2.2. Focused Ion Beam (FIB) System
- 12.2.3. Transmission Electron Microscope (TEM)
- 12.2.4. Dual Beam System
- 12.2.5. Other Equipment
- 12.3. Market Analysis, Insights and Forecast - by End-user Vertical
- 12.3.1. Automotive
- 12.3.2. Oil and Gas
- 12.3.3. Defense
- 12.3.4. Construction
- 12.3.5. Manufacturing
- 12.3.6. Electronics and Semiconductors
- 12.3.7. Other End-user Verticals
- 12.1. Market Analysis, Insights and Forecast - by Technology
- 13. Competitive Analysis
- 13.1. Company Profiles
- 13.1.1 Crane Engineering
- 13.1.1.1. Company Overview
- 13.1.1.2. Products
- 13.1.1.3. Company Financials
- 13.1.1.4. SWOT Analysis
- 13.1.2 Eurofins Maser BV
- 13.1.2.1. Company Overview
- 13.1.2.2. Products
- 13.1.2.3. Company Financials
- 13.1.2.4. SWOT Analysis
- 13.1.3 Presto Engineering Inc
- 13.1.3.1. Company Overview
- 13.1.3.2. Products
- 13.1.3.3. Company Financials
- 13.1.3.4. SWOT Analysis
- 13.1.4 Leonard C Quick & Associates Inc
- 13.1.4.1. Company Overview
- 13.1.4.2. Products
- 13.1.4.3. Company Financials
- 13.1.4.4. SWOT Analysis
- 13.1.5 Rood Microtec GmbH
- 13.1.5.1. Company Overview
- 13.1.5.2. Products
- 13.1.5.3. Company Financials
- 13.1.5.4. SWOT Analysis
- 13.1.6 McDowell Owens Engineering Inc
- 13.1.6.1. Company Overview
- 13.1.6.2. Products
- 13.1.6.3. Company Financials
- 13.1.6.4. SWOT Analysis
- 13.1.7 NanoScope Services Ltd
- 13.1.7.1. Company Overview
- 13.1.7.2. Products
- 13.1.7.3. Company Financials
- 13.1.7.4. SWOT Analysis
- 13.1.8 Exponent Inc
- 13.1.8.1. Company Overview
- 13.1.8.2. Products
- 13.1.8.3. Company Financials
- 13.1.8.4. SWOT Analysis
- 13.1.9 CoreTest Technologies
- 13.1.9.1. Company Overview
- 13.1.9.2. Products
- 13.1.9.3. Company Financials
- 13.1.9.4. SWOT Analysis
- 13.1.10 Eurofins EAG Laboratories
- 13.1.10.1. Company Overview
- 13.1.10.2. Products
- 13.1.10.3. Company Financials
- 13.1.10.4. SWOT Analysis
- 13.1.11 Materials Testing
- 13.1.11.1. Company Overview
- 13.1.11.2. Products
- 13.1.11.3. Company Financials
- 13.1.11.4. SWOT Analysis
- 13.1.12 TUV SUD
- 13.1.12.1. Company Overview
- 13.1.12.2. Products
- 13.1.12.3. Company Financials
- 13.1.12.4. SWOT Analysis
- 13.1.1 Crane Engineering
- 13.2. Market Entropy
- 13.2.1 Company's Key Areas Served
- 13.2.2 Recent Developments
- 13.3. Company Market Share Analysis 2025
- 13.3.1 Top 5 Companies Market Share Analysis
- 13.3.2 Top 3 Companies Market Share Analysis
- 13.4. List of Potential Customers
- 14. Research Methodology
List of Figures
- Figure 1: Global Failure Analysis Market Revenue Breakdown (Million, %) by Region 2025 & 2033
- Figure 2: North America Failure Analysis Market Revenue (Million), by Technology 2025 & 2033
- Figure 3: North America Failure Analysis Market Revenue Share (%), by Technology 2025 & 2033
- Figure 4: North America Failure Analysis Market Revenue (Million), by Equipment 2025 & 2033
- Figure 5: North America Failure Analysis Market Revenue Share (%), by Equipment 2025 & 2033
- Figure 6: North America Failure Analysis Market Revenue (Million), by End-user Vertical 2025 & 2033
- Figure 7: North America Failure Analysis Market Revenue Share (%), by End-user Vertical 2025 & 2033
- Figure 8: North America Failure Analysis Market Revenue (Million), by Country 2025 & 2033
- Figure 9: North America Failure Analysis Market Revenue Share (%), by Country 2025 & 2033
- Figure 10: Europe Failure Analysis Market Revenue (Million), by Technology 2025 & 2033
- Figure 11: Europe Failure Analysis Market Revenue Share (%), by Technology 2025 & 2033
- Figure 12: Europe Failure Analysis Market Revenue (Million), by Equipment 2025 & 2033
- Figure 13: Europe Failure Analysis Market Revenue Share (%), by Equipment 2025 & 2033
- Figure 14: Europe Failure Analysis Market Revenue (Million), by End-user Vertical 2025 & 2033
- Figure 15: Europe Failure Analysis Market Revenue Share (%), by End-user Vertical 2025 & 2033
- Figure 16: Europe Failure Analysis Market Revenue (Million), by Country 2025 & 2033
- Figure 17: Europe Failure Analysis Market Revenue Share (%), by Country 2025 & 2033
- Figure 18: Asia Failure Analysis Market Revenue (Million), by Technology 2025 & 2033
- Figure 19: Asia Failure Analysis Market Revenue Share (%), by Technology 2025 & 2033
- Figure 20: Asia Failure Analysis Market Revenue (Million), by Equipment 2025 & 2033
- Figure 21: Asia Failure Analysis Market Revenue Share (%), by Equipment 2025 & 2033
- Figure 22: Asia Failure Analysis Market Revenue (Million), by End-user Vertical 2025 & 2033
- Figure 23: Asia Failure Analysis Market Revenue Share (%), by End-user Vertical 2025 & 2033
- Figure 24: Asia Failure Analysis Market Revenue (Million), by Country 2025 & 2033
- Figure 25: Asia Failure Analysis Market Revenue Share (%), by Country 2025 & 2033
- Figure 26: Australia and New Zealand Failure Analysis Market Revenue (Million), by Technology 2025 & 2033
- Figure 27: Australia and New Zealand Failure Analysis Market Revenue Share (%), by Technology 2025 & 2033
- Figure 28: Australia and New Zealand Failure Analysis Market Revenue (Million), by Equipment 2025 & 2033
- Figure 29: Australia and New Zealand Failure Analysis Market Revenue Share (%), by Equipment 2025 & 2033
- Figure 30: Australia and New Zealand Failure Analysis Market Revenue (Million), by End-user Vertical 2025 & 2033
- Figure 31: Australia and New Zealand Failure Analysis Market Revenue Share (%), by End-user Vertical 2025 & 2033
- Figure 32: Australia and New Zealand Failure Analysis Market Revenue (Million), by Country 2025 & 2033
- Figure 33: Australia and New Zealand Failure Analysis Market Revenue Share (%), by Country 2025 & 2033
- Figure 34: Latin America Failure Analysis Market Revenue (Million), by Technology 2025 & 2033
- Figure 35: Latin America Failure Analysis Market Revenue Share (%), by Technology 2025 & 2033
- Figure 36: Latin America Failure Analysis Market Revenue (Million), by Equipment 2025 & 2033
- Figure 37: Latin America Failure Analysis Market Revenue Share (%), by Equipment 2025 & 2033
- Figure 38: Latin America Failure Analysis Market Revenue (Million), by End-user Vertical 2025 & 2033
- Figure 39: Latin America Failure Analysis Market Revenue Share (%), by End-user Vertical 2025 & 2033
- Figure 40: Latin America Failure Analysis Market Revenue (Million), by Country 2025 & 2033
- Figure 41: Latin America Failure Analysis Market Revenue Share (%), by Country 2025 & 2033
- Figure 42: Middle East and Africa Failure Analysis Market Revenue (Million), by Technology 2025 & 2033
- Figure 43: Middle East and Africa Failure Analysis Market Revenue Share (%), by Technology 2025 & 2033
- Figure 44: Middle East and Africa Failure Analysis Market Revenue (Million), by Equipment 2025 & 2033
- Figure 45: Middle East and Africa Failure Analysis Market Revenue Share (%), by Equipment 2025 & 2033
- Figure 46: Middle East and Africa Failure Analysis Market Revenue (Million), by End-user Vertical 2025 & 2033
- Figure 47: Middle East and Africa Failure Analysis Market Revenue Share (%), by End-user Vertical 2025 & 2033
- Figure 48: Middle East and Africa Failure Analysis Market Revenue (Million), by Country 2025 & 2033
- Figure 49: Middle East and Africa Failure Analysis Market Revenue Share (%), by Country 2025 & 2033
List of Tables
- Table 1: Global Failure Analysis Market Revenue Million Forecast, by Technology 2020 & 2033
- Table 2: Global Failure Analysis Market Revenue Million Forecast, by Equipment 2020 & 2033
- Table 3: Global Failure Analysis Market Revenue Million Forecast, by End-user Vertical 2020 & 2033
- Table 4: Global Failure Analysis Market Revenue Million Forecast, by Region 2020 & 2033
- Table 5: Global Failure Analysis Market Revenue Million Forecast, by Technology 2020 & 2033
- Table 6: Global Failure Analysis Market Revenue Million Forecast, by Equipment 2020 & 2033
- Table 7: Global Failure Analysis Market Revenue Million Forecast, by End-user Vertical 2020 & 2033
- Table 8: Global Failure Analysis Market Revenue Million Forecast, by Country 2020 & 2033
- Table 9: Global Failure Analysis Market Revenue Million Forecast, by Technology 2020 & 2033
- Table 10: Global Failure Analysis Market Revenue Million Forecast, by Equipment 2020 & 2033
- Table 11: Global Failure Analysis Market Revenue Million Forecast, by End-user Vertical 2020 & 2033
- Table 12: Global Failure Analysis Market Revenue Million Forecast, by Country 2020 & 2033
- Table 13: Global Failure Analysis Market Revenue Million Forecast, by Technology 2020 & 2033
- Table 14: Global Failure Analysis Market Revenue Million Forecast, by Equipment 2020 & 2033
- Table 15: Global Failure Analysis Market Revenue Million Forecast, by End-user Vertical 2020 & 2033
- Table 16: Global Failure Analysis Market Revenue Million Forecast, by Country 2020 & 2033
- Table 17: Global Failure Analysis Market Revenue Million Forecast, by Technology 2020 & 2033
- Table 18: Global Failure Analysis Market Revenue Million Forecast, by Equipment 2020 & 2033
- Table 19: Global Failure Analysis Market Revenue Million Forecast, by End-user Vertical 2020 & 2033
- Table 20: Global Failure Analysis Market Revenue Million Forecast, by Country 2020 & 2033
- Table 21: Global Failure Analysis Market Revenue Million Forecast, by Technology 2020 & 2033
- Table 22: Global Failure Analysis Market Revenue Million Forecast, by Equipment 2020 & 2033
- Table 23: Global Failure Analysis Market Revenue Million Forecast, by End-user Vertical 2020 & 2033
- Table 24: Global Failure Analysis Market Revenue Million Forecast, by Country 2020 & 2033
- Table 25: Global Failure Analysis Market Revenue Million Forecast, by Technology 2020 & 2033
- Table 26: Global Failure Analysis Market Revenue Million Forecast, by Equipment 2020 & 2033
- Table 27: Global Failure Analysis Market Revenue Million Forecast, by End-user Vertical 2020 & 2033
- Table 28: Global Failure Analysis Market Revenue Million Forecast, by Country 2020 & 2033
Frequently Asked Questions
1. What is the projected Compound Annual Growth Rate (CAGR) of the Failure Analysis Market?
The projected CAGR is approximately 7.56%.
2. Which companies are prominent players in the Failure Analysis Market?
Key companies in the market include Crane Engineering, Eurofins Maser BV, Presto Engineering Inc, Leonard C Quick & Associates Inc, Rood Microtec GmbH, McDowell Owens Engineering Inc, NanoScope Services Ltd, Exponent Inc, CoreTest Technologies, Eurofins EAG Laboratories, Materials Testing, TUV SUD.
3. What are the main segments of the Failure Analysis Market?
The market segments include Technology, Equipment, End-user Vertical.
4. Can you provide details about the market size?
The market size is estimated to be USD 4.94 Million as of 2022.
5. What are some drivers contributing to market growth?
Ageing Infrastructure and Increasing Need for Maintenance; Technological Advancements Drive the Market Growth; Innovation in Materials. Design. and Production Methods.
6. What are the notable trends driving market growth?
Growth in the Construction Sector Boosting the Demand for Furniture Products.
7. Are there any restraints impacting market growth?
High Equipment Cost Challenge the Market.
8. Can you provide examples of recent developments in the market?
June 2024 - The Atlanta government announced a State of Emergency due to a water main break affecting businesses, schools, and hospitals in the midtown and downtown areas. This incident highlights the broader issue of aging infrastructure across North America. With over 2,600 miles of pipes, some of which are more than 100 years old, Atlanta faces major challenges in maintaining and upgrading its water network.
9. What pricing options are available for accessing the report?
Pricing options include single-user, multi-user, and enterprise licenses priced at USD 4750, USD 5250, and USD 8750 respectively.
10. Is the market size provided in terms of value or volume?
The market size is provided in terms of value, measured in Million.
11. Are there any specific market keywords associated with the report?
Yes, the market keyword associated with the report is "Failure Analysis Market," which aids in identifying and referencing the specific market segment covered.
12. How do I determine which pricing option suits my needs best?
The pricing options vary based on user requirements and access needs. Individual users may opt for single-user licenses, while businesses requiring broader access may choose multi-user or enterprise licenses for cost-effective access to the report.
13. Are there any additional resources or data provided in the Failure Analysis Market report?
While the report offers comprehensive insights, it's advisable to review the specific contents or supplementary materials provided to ascertain if additional resources or data are available.
14. How can I stay updated on further developments or reports in the Failure Analysis Market?
To stay informed about further developments, trends, and reports in the Failure Analysis Market, consider subscribing to industry newsletters, following relevant companies and organizations, or regularly checking reputable industry news sources and publications.
Methodology
Step 1 - Identification of Relevant Samples Size from Population Database


Step 2 - Approaches for Defining Global Market Size (Value, Volume* & Price*)

Note*: In applicable scenarios
Step 3 - Data Sources
Primary Research
- Web Analytics
- Survey Reports
- Research Institute
- Latest Research Reports
- Opinion Leaders
Secondary Research
- Annual Reports
- White Paper
- Latest Press Release
- Industry Association
- Paid Database
- Investor Presentations

Step 4 - Data Triangulation
Involves using different sources of information in order to increase the validity of a study
These sources are likely to be stakeholders in a program - participants, other researchers, program staff, other community members, and so on.
Then we put all data in single framework & apply various statistical tools to find out the dynamic on the market.
During the analysis stage, feedback from the stakeholder groups would be compared to determine areas of agreement as well as areas of divergence