
Key Insights
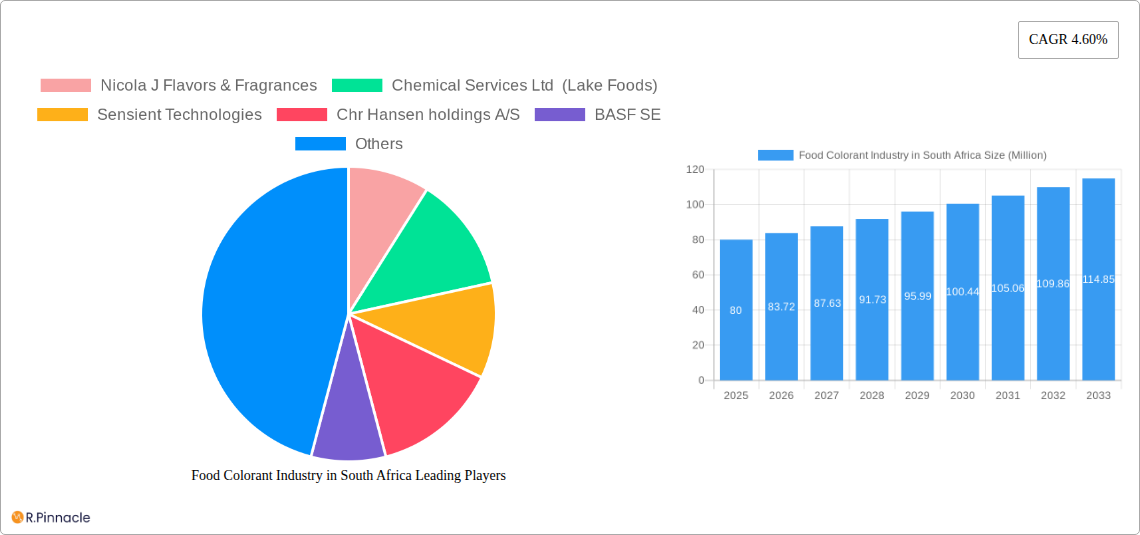
The South African food colorant market, valued at approximately ZAR 1.5 billion (USD 80 million) in 2025, is projected to experience steady growth, driven by the expanding food processing and beverage sectors. The rising demand for processed foods, particularly within the bakery, confectionery, and dairy industries, fuels the need for vibrant and appealing products. Increased consumer preference for natural food colorants, coupled with stricter regulations on synthetic alternatives, is reshaping the market landscape. This trend is creating opportunities for manufacturers specializing in natural colorants derived from sources like fruits, vegetables, and spices. While a shortage of skilled labor and fluctuating raw material prices may pose challenges, the market's resilience is underpinned by its close ties to the broader African economy and a growing middle class with increasing disposable income. Furthermore, the increasing popularity of convenience foods and ready-to-eat meals, which rely heavily on food colorants, is a significant factor driving market expansion. Companies like Nicola J Flavors & Fragrances and Chemical Services Ltd (Lake Foods) are likely playing key roles in supplying this market, competing with larger international players like Sensient Technologies and Chr. Hansen. The forecast period of 2025-2033 anticipates a continued positive trajectory, albeit at a moderate pace, as the market continues to adapt to evolving consumer preferences and regulatory changes.
The segmental analysis reveals a likely dominance of synthetic food colorants due to their cost-effectiveness and ease of use. However, the natural food colorants segment is anticipated to show robust growth, fueled by increasing health consciousness among consumers. Within applications, the bakery and confectionery sectors are expected to be major consumers of food colorants, driven by demand for visually appealing products. The ongoing trend towards healthier food choices will likely push further innovation within the natural colorant segment, creating opportunities for product diversification and premium pricing. This dynamic necessitates a strategic approach for players in the South African food colorant market, focusing on product innovation, supply chain resilience, and alignment with evolving consumer and regulatory trends. Strategic partnerships and investments in research and development will likely become crucial factors for success in this evolving market.
Food Colorant Industry in South Africa: A Comprehensive Market Report (2019-2033)
This comprehensive report provides an in-depth analysis of the South African food colorant industry, offering crucial insights for businesses, investors, and industry professionals. The study period spans from 2019 to 2033, with 2025 serving as the base and estimated year. The forecast period is 2025-2033, and the historical period covers 2019-2024. This report leverages extensive data analysis to uncover key trends, challenges, and opportunities shaping this dynamic market. Expect detailed segment breakdowns by product type (synthetic and natural food colorants) and application (bakery, dairy & frozen products, confectionery, meat, poultry & seafood products, beverages, and others). Market sizes are presented in Millions.
Food Colorant Industry in South Africa Market Structure & Innovation Trends
This section analyzes the competitive landscape, including market concentration, innovation drivers, regulatory frameworks, and M&A activities within the South African food colorant market. The report delves into the dynamics of key players like Nicola J Flavors & Fragrances, Chemical Services Ltd (Lake Foods), Sensient Technologies, Chr. Hansen Holding A/S, BASF SE, Quantum Colors S, and EDCOL, assessing their respective market shares and contributions to overall innovation. The analysis incorporates an examination of market concentration, revealing the degree of competition and dominance within the industry. It also explores the influence of regulatory frameworks and their impact on innovation, product development, and market access. Furthermore, the report assesses the impact of M&A activities, including deal values (xx Million) and their influence on market consolidation and competitive dynamics. The analysis encompasses an evaluation of product substitutes and their potential to disrupt the market, along with an examination of end-user demographics and their evolving preferences for food colorants. This comprehensive analysis provides a robust understanding of the industry’s structure and innovation trends, assisting stakeholders in making informed decisions.
Food Colorant Industry in South Africa Market Dynamics & Trends
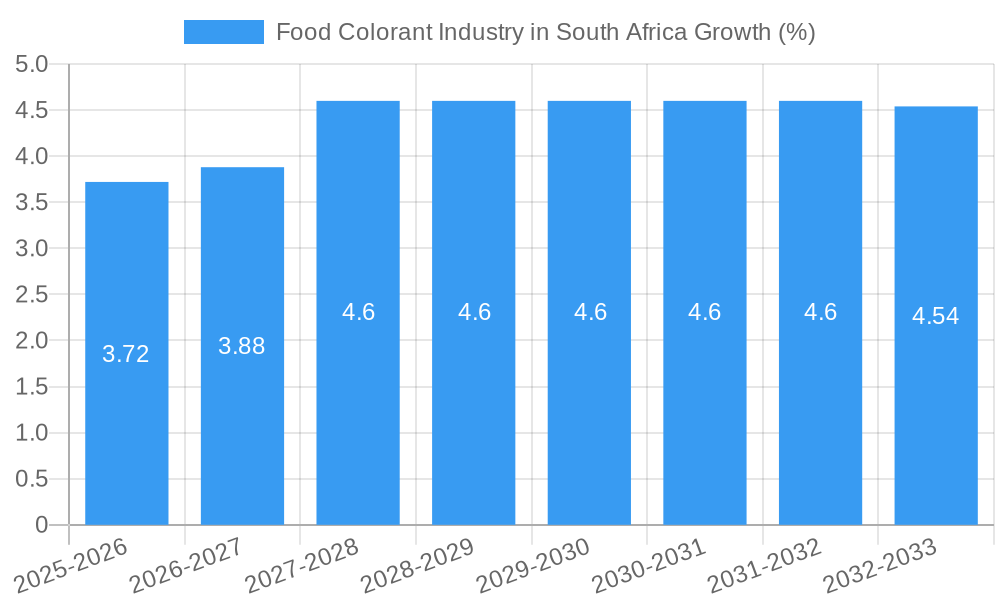
This section explores the market's growth trajectory, analyzing key drivers, disruptive technologies, evolving consumer preferences, and competitive dynamics. The report presents a detailed analysis of market growth, estimating a CAGR of xx% during the forecast period (2025-2033), with a market penetration rate of xx% in 2025, driven by factors such as increasing demand from the food and beverage industry, changing consumer preferences for natural food colorants, and technological advancements in colorant production. The section further examines the impact of technological disruptions such as the rise of precision fermentation technologies and nanotechnology on the market. A detailed competitive analysis assesses the strategies employed by key players, including pricing strategies, product differentiation, and expansion strategies, as well as the impact of these strategies on market share. The analysis also incorporates the influence of macroeconomic factors, regulatory changes, and consumer trends on the overall market dynamics.
Dominant Regions & Segments in Food Colorant Industry in South Africa
This section identifies the leading regions and segments within the South African food colorant market. The dominance analysis considers both product type (synthetic vs. natural food colorants) and application (bakery, dairy & frozen products, confectionery, meat, poultry & seafood, beverages, and others).
Key Drivers for Dominant Segments:
- Synthetic Food Colorants: Cost-effectiveness, consistent color, and wide availability.
- Natural Food Colorants: Growing consumer preference for natural and clean-label products.
- Bakery: Large-scale consumption of bakery products across South Africa.
- Dairy & Frozen Products: Increasing demand for visually appealing products and extended shelf life.
- Confectionery: High demand for vibrant colors in sweets and chocolates.
This section delves into the specific factors contributing to the dominance of particular regions and segments, providing a granular analysis of market share distribution and future growth projections. The report analyzes the impact of economic policies, infrastructure development, and consumer behavior on segment growth.
Food Colorant Industry in South Africa Product Innovations
Recent product developments include the introduction of new shades of natural colorants and the improvement of existing synthetic colorants’ stability and performance. Companies are also focusing on developing clean-label colorants and those sourced sustainably. These innovations respond to consumer demand for natural ingredients and sustainable practices, offering competitive advantages in the market. The use of biotechnology and nanotechnology is being explored to enhance colorant properties and expand applications.
Report Scope & Segmentation Analysis
This report segments the South African food colorant market by product type (Synthetic Food Colorants and Natural Food Colorants) and application (Bakery, Dairy & Frozen products, Confectionery, Meat poultry & Sea Food products, Beverages, Others). Each segment's growth projections, market size (in Millions), and competitive dynamics are analyzed in detail. For example, the synthetic food colorants segment is expected to have a market size of xx Million in 2025, while the natural food colorants segment is projected to reach xx Million. The analysis includes the competitive landscape within each segment, highlighting key players and their market strategies.
Key Drivers of Food Colorant Industry in South Africa Growth
Growth in the South African food colorant market is driven by factors such as increasing demand for processed foods, the growing popularity of convenience foods, and the rising disposable incomes of consumers. Further impetus comes from the expanding food and beverage sector, and the proliferation of new product launches across various categories. Government regulations regarding food safety and labeling also influence market dynamics, with a push towards natural and sustainable ingredients stimulating growth in the natural food colorant segment.
Challenges in the Food Colorant Industry in South Africa Sector
The South African food colorant industry faces challenges including fluctuating raw material prices, stringent regulatory compliance requirements, and intense competition from both domestic and international players. Supply chain disruptions and the need for continuous innovation to meet evolving consumer demands add to the complexities of the sector. These challenges can impact profitability and market share, requiring businesses to adopt adaptive strategies for sustained growth. The cost of complying with stringent regulations is a significant burden for smaller companies.
Emerging Opportunities in Food Colorant Industry in South Africa
Emerging opportunities in the South African food colorant market include the rising demand for clean-label products, the increasing popularity of functional foods, and the growing consumer awareness of health and wellness. This creates opportunities for companies to develop and market colorants with added health benefits or those derived from sustainable and ethical sources. The increasing demand for natural and organic food products is a significant growth driver for this segment. Technological advancements, including novel extraction methods and synthetic biology, will contribute to innovation within the industry.
Leading Players in the Food Colorant Industry in South Africa Market
- Nicola J Flavors & Fragrances
- Chemical Services Ltd (Lake Foods)
- Sensient Technologies (Sensient Technologies)
- Chr. Hansen Holding A/S (Chr. Hansen Holding A/S)
- BASF SE (BASF SE)
- Quantum Colors S
- EDCOL
Key Developments in Food Colorant Industry in South Africa Industry
- 2022 Q3: Sensient Technologies launched a new range of natural food colorants derived from fruit and vegetable extracts.
- 2023 Q1: BASF SE announced a significant investment in expanding its manufacturing facility in South Africa.
- 2024 Q2: A merger between two smaller food colorant companies resulted in increased market consolidation. (Further details are available in the full report).
(Note: Further key developments with specific dates are detailed in the full report.)
Future Outlook for Food Colorant Industry in South Africa Market
The future of the South African food colorant market is promising, driven by sustained growth in the food and beverage sector, increasing consumer demand for diverse food products, and ongoing innovation in colorant technology. The market will experience continued growth, with the natural colorants segment leading the way. Strategic partnerships and collaborations will be vital to navigating market challenges and maintaining a competitive edge. Companies investing in research and development of sustainable and health-conscious solutions will secure a stronger market position.
Food Colorant Industry in South Africa Segmentation
-
1. Product Type
- 1.1. Synthetic Food colorants
- 1.2. Natural Food Colorants
-
2. Application
- 2.1. Bakery
- 2.2. Dairy & Frozen products
- 2.3. Confectionery
- 2.4. Meat poultry & Sea Food products
- 2.5. Beverages
- 2.6. Others
Food Colorant Industry in South Africa Segmentation By Geography
-
1. North America
- 1.1. United States
- 1.2. Canada
- 1.3. Mexico
-
2. South America
- 2.1. Brazil
- 2.2. Argentina
- 2.3. Rest of South America
-
3. Europe
- 3.1. United Kingdom
- 3.2. Germany
- 3.3. France
- 3.4. Italy
- 3.5. Spain
- 3.6. Russia
- 3.7. Benelux
- 3.8. Nordics
- 3.9. Rest of Europe
-
4. Middle East & Africa
- 4.1. Turkey
- 4.2. Israel
- 4.3. GCC
- 4.4. North Africa
- 4.5. South Africa
- 4.6. Rest of Middle East & Africa
-
5. Asia Pacific
- 5.1. China
- 5.2. India
- 5.3. Japan
- 5.4. South Korea
- 5.5. ASEAN
- 5.6. Oceania
- 5.7. Rest of Asia Pacific
Food Colorant Industry in South Africa REPORT HIGHLIGHTS
| Aspects | Details |
|---|---|
| Study Period | 2019-2033 |
| Base Year | 2024 |
| Estimated Year | 2025 |
| Forecast Period | 2025-2033 |
| Historical Period | 2019-2024 |
| Growth Rate | CAGR of 4.60% from 2019-2033 |
| Segmentation |
|
Table of Contents
- 1. Introduction
- 1.1. Research Scope
- 1.2. Market Segmentation
- 1.3. Research Methodology
- 1.4. Definitions and Assumptions
- 2. Executive Summary
- 2.1. Introduction
- 3. Market Dynamics
- 3.1. Introduction
- 3.2. Market Drivers
- 3.2.1. Rising Health Consciousness among consumer
- 3.3. Market Restrains
- 3.3.1. High Cost of natural Ingredients
- 3.4. Market Trends
- 3.4.1. Growing Emergence of Natural Color
- 4. Market Factor Analysis
- 4.1. Porters Five Forces
- 4.2. Supply/Value Chain
- 4.3. PESTEL analysis
- 4.4. Market Entropy
- 4.5. Patent/Trademark Analysis
- 5. Global Food Colorant Industry in South Africa Analysis, Insights and Forecast, 2019-2031
- 5.1. Market Analysis, Insights and Forecast - by Product Type
- 5.1.1. Synthetic Food colorants
- 5.1.2. Natural Food Colorants
- 5.2. Market Analysis, Insights and Forecast - by Application
- 5.2.1. Bakery
- 5.2.2. Dairy & Frozen products
- 5.2.3. Confectionery
- 5.2.4. Meat poultry & Sea Food products
- 5.2.5. Beverages
- 5.2.6. Others
- 5.3. Market Analysis, Insights and Forecast - by Region
- 5.3.1. North America
- 5.3.2. South America
- 5.3.3. Europe
- 5.3.4. Middle East & Africa
- 5.3.5. Asia Pacific
- 5.1. Market Analysis, Insights and Forecast - by Product Type
- 6. North America Food Colorant Industry in South Africa Analysis, Insights and Forecast, 2019-2031
- 6.1. Market Analysis, Insights and Forecast - by Product Type
- 6.1.1. Synthetic Food colorants
- 6.1.2. Natural Food Colorants
- 6.2. Market Analysis, Insights and Forecast - by Application
- 6.2.1. Bakery
- 6.2.2. Dairy & Frozen products
- 6.2.3. Confectionery
- 6.2.4. Meat poultry & Sea Food products
- 6.2.5. Beverages
- 6.2.6. Others
- 6.1. Market Analysis, Insights and Forecast - by Product Type
- 7. South America Food Colorant Industry in South Africa Analysis, Insights and Forecast, 2019-2031
- 7.1. Market Analysis, Insights and Forecast - by Product Type
- 7.1.1. Synthetic Food colorants
- 7.1.2. Natural Food Colorants
- 7.2. Market Analysis, Insights and Forecast - by Application
- 7.2.1. Bakery
- 7.2.2. Dairy & Frozen products
- 7.2.3. Confectionery
- 7.2.4. Meat poultry & Sea Food products
- 7.2.5. Beverages
- 7.2.6. Others
- 7.1. Market Analysis, Insights and Forecast - by Product Type
- 8. Europe Food Colorant Industry in South Africa Analysis, Insights and Forecast, 2019-2031
- 8.1. Market Analysis, Insights and Forecast - by Product Type
- 8.1.1. Synthetic Food colorants
- 8.1.2. Natural Food Colorants
- 8.2. Market Analysis, Insights and Forecast - by Application
- 8.2.1. Bakery
- 8.2.2. Dairy & Frozen products
- 8.2.3. Confectionery
- 8.2.4. Meat poultry & Sea Food products
- 8.2.5. Beverages
- 8.2.6. Others
- 8.1. Market Analysis, Insights and Forecast - by Product Type
- 9. Middle East & Africa Food Colorant Industry in South Africa Analysis, Insights and Forecast, 2019-2031
- 9.1. Market Analysis, Insights and Forecast - by Product Type
- 9.1.1. Synthetic Food colorants
- 9.1.2. Natural Food Colorants
- 9.2. Market Analysis, Insights and Forecast - by Application
- 9.2.1. Bakery
- 9.2.2. Dairy & Frozen products
- 9.2.3. Confectionery
- 9.2.4. Meat poultry & Sea Food products
- 9.2.5. Beverages
- 9.2.6. Others
- 9.1. Market Analysis, Insights and Forecast - by Product Type
- 10. Asia Pacific Food Colorant Industry in South Africa Analysis, Insights and Forecast, 2019-2031
- 10.1. Market Analysis, Insights and Forecast - by Product Type
- 10.1.1. Synthetic Food colorants
- 10.1.2. Natural Food Colorants
- 10.2. Market Analysis, Insights and Forecast - by Application
- 10.2.1. Bakery
- 10.2.2. Dairy & Frozen products
- 10.2.3. Confectionery
- 10.2.4. Meat poultry & Sea Food products
- 10.2.5. Beverages
- 10.2.6. Others
- 10.1. Market Analysis, Insights and Forecast - by Product Type
- 11. South Africa Food Colorant Industry in South Africa Analysis, Insights and Forecast, 2019-2031
- 12. Sudan Food Colorant Industry in South Africa Analysis, Insights and Forecast, 2019-2031
- 13. Uganda Food Colorant Industry in South Africa Analysis, Insights and Forecast, 2019-2031
- 14. Tanzania Food Colorant Industry in South Africa Analysis, Insights and Forecast, 2019-2031
- 15. Kenya Food Colorant Industry in South Africa Analysis, Insights and Forecast, 2019-2031
- 16. Rest of Africa Food Colorant Industry in South Africa Analysis, Insights and Forecast, 2019-2031
- 17. Competitive Analysis
- 17.1. Global Market Share Analysis 2024
- 17.2. Company Profiles
- 17.2.1 Nicola J Flavors & Fragrances
- 17.2.1.1. Overview
- 17.2.1.2. Products
- 17.2.1.3. SWOT Analysis
- 17.2.1.4. Recent Developments
- 17.2.1.5. Financials (Based on Availability)
- 17.2.2 Chemical Services Ltd (Lake Foods)
- 17.2.2.1. Overview
- 17.2.2.2. Products
- 17.2.2.3. SWOT Analysis
- 17.2.2.4. Recent Developments
- 17.2.2.5. Financials (Based on Availability)
- 17.2.3 Sensient Technologies
- 17.2.3.1. Overview
- 17.2.3.2. Products
- 17.2.3.3. SWOT Analysis
- 17.2.3.4. Recent Developments
- 17.2.3.5. Financials (Based on Availability)
- 17.2.4 Chr Hansen holdings A/S
- 17.2.4.1. Overview
- 17.2.4.2. Products
- 17.2.4.3. SWOT Analysis
- 17.2.4.4. Recent Developments
- 17.2.4.5. Financials (Based on Availability)
- 17.2.5 BASF SE
- 17.2.5.1. Overview
- 17.2.5.2. Products
- 17.2.5.3. SWOT Analysis
- 17.2.5.4. Recent Developments
- 17.2.5.5. Financials (Based on Availability)
- 17.2.6 Quantum Colors S
- 17.2.6.1. Overview
- 17.2.6.2. Products
- 17.2.6.3. SWOT Analysis
- 17.2.6.4. Recent Developments
- 17.2.6.5. Financials (Based on Availability)
- 17.2.7 EDCOL
- 17.2.7.1. Overview
- 17.2.7.2. Products
- 17.2.7.3. SWOT Analysis
- 17.2.7.4. Recent Developments
- 17.2.7.5. Financials (Based on Availability)
- 17.2.1 Nicola J Flavors & Fragrances
List of Figures
- Figure 1: Global Food Colorant Industry in South Africa Revenue Breakdown (Million, %) by Region 2024 & 2032
- Figure 2: Africa Food Colorant Industry in South Africa Revenue (Million), by Country 2024 & 2032
- Figure 3: Africa Food Colorant Industry in South Africa Revenue Share (%), by Country 2024 & 2032
- Figure 4: North America Food Colorant Industry in South Africa Revenue (Million), by Product Type 2024 & 2032
- Figure 5: North America Food Colorant Industry in South Africa Revenue Share (%), by Product Type 2024 & 2032
- Figure 6: North America Food Colorant Industry in South Africa Revenue (Million), by Application 2024 & 2032
- Figure 7: North America Food Colorant Industry in South Africa Revenue Share (%), by Application 2024 & 2032
- Figure 8: North America Food Colorant Industry in South Africa Revenue (Million), by Country 2024 & 2032
- Figure 9: North America Food Colorant Industry in South Africa Revenue Share (%), by Country 2024 & 2032
- Figure 10: South America Food Colorant Industry in South Africa Revenue (Million), by Product Type 2024 & 2032
- Figure 11: South America Food Colorant Industry in South Africa Revenue Share (%), by Product Type 2024 & 2032
- Figure 12: South America Food Colorant Industry in South Africa Revenue (Million), by Application 2024 & 2032
- Figure 13: South America Food Colorant Industry in South Africa Revenue Share (%), by Application 2024 & 2032
- Figure 14: South America Food Colorant Industry in South Africa Revenue (Million), by Country 2024 & 2032
- Figure 15: South America Food Colorant Industry in South Africa Revenue Share (%), by Country 2024 & 2032
- Figure 16: Europe Food Colorant Industry in South Africa Revenue (Million), by Product Type 2024 & 2032
- Figure 17: Europe Food Colorant Industry in South Africa Revenue Share (%), by Product Type 2024 & 2032
- Figure 18: Europe Food Colorant Industry in South Africa Revenue (Million), by Application 2024 & 2032
- Figure 19: Europe Food Colorant Industry in South Africa Revenue Share (%), by Application 2024 & 2032
- Figure 20: Europe Food Colorant Industry in South Africa Revenue (Million), by Country 2024 & 2032
- Figure 21: Europe Food Colorant Industry in South Africa Revenue Share (%), by Country 2024 & 2032
- Figure 22: Middle East & Africa Food Colorant Industry in South Africa Revenue (Million), by Product Type 2024 & 2032
- Figure 23: Middle East & Africa Food Colorant Industry in South Africa Revenue Share (%), by Product Type 2024 & 2032
- Figure 24: Middle East & Africa Food Colorant Industry in South Africa Revenue (Million), by Application 2024 & 2032
- Figure 25: Middle East & Africa Food Colorant Industry in South Africa Revenue Share (%), by Application 2024 & 2032
- Figure 26: Middle East & Africa Food Colorant Industry in South Africa Revenue (Million), by Country 2024 & 2032
- Figure 27: Middle East & Africa Food Colorant Industry in South Africa Revenue Share (%), by Country 2024 & 2032
- Figure 28: Asia Pacific Food Colorant Industry in South Africa Revenue (Million), by Product Type 2024 & 2032
- Figure 29: Asia Pacific Food Colorant Industry in South Africa Revenue Share (%), by Product Type 2024 & 2032
- Figure 30: Asia Pacific Food Colorant Industry in South Africa Revenue (Million), by Application 2024 & 2032
- Figure 31: Asia Pacific Food Colorant Industry in South Africa Revenue Share (%), by Application 2024 & 2032
- Figure 32: Asia Pacific Food Colorant Industry in South Africa Revenue (Million), by Country 2024 & 2032
- Figure 33: Asia Pacific Food Colorant Industry in South Africa Revenue Share (%), by Country 2024 & 2032
List of Tables
- Table 1: Global Food Colorant Industry in South Africa Revenue Million Forecast, by Region 2019 & 2032
- Table 2: Global Food Colorant Industry in South Africa Revenue Million Forecast, by Product Type 2019 & 2032
- Table 3: Global Food Colorant Industry in South Africa Revenue Million Forecast, by Application 2019 & 2032
- Table 4: Global Food Colorant Industry in South Africa Revenue Million Forecast, by Region 2019 & 2032
- Table 5: Global Food Colorant Industry in South Africa Revenue Million Forecast, by Country 2019 & 2032
- Table 6: South Africa Food Colorant Industry in South Africa Revenue (Million) Forecast, by Application 2019 & 2032
- Table 7: Sudan Food Colorant Industry in South Africa Revenue (Million) Forecast, by Application 2019 & 2032
- Table 8: Uganda Food Colorant Industry in South Africa Revenue (Million) Forecast, by Application 2019 & 2032
- Table 9: Tanzania Food Colorant Industry in South Africa Revenue (Million) Forecast, by Application 2019 & 2032
- Table 10: Kenya Food Colorant Industry in South Africa Revenue (Million) Forecast, by Application 2019 & 2032
- Table 11: Rest of Africa Food Colorant Industry in South Africa Revenue (Million) Forecast, by Application 2019 & 2032
- Table 12: Global Food Colorant Industry in South Africa Revenue Million Forecast, by Product Type 2019 & 2032
- Table 13: Global Food Colorant Industry in South Africa Revenue Million Forecast, by Application 2019 & 2032
- Table 14: Global Food Colorant Industry in South Africa Revenue Million Forecast, by Country 2019 & 2032
- Table 15: United States Food Colorant Industry in South Africa Revenue (Million) Forecast, by Application 2019 & 2032
- Table 16: Canada Food Colorant Industry in South Africa Revenue (Million) Forecast, by Application 2019 & 2032
- Table 17: Mexico Food Colorant Industry in South Africa Revenue (Million) Forecast, by Application 2019 & 2032
- Table 18: Global Food Colorant Industry in South Africa Revenue Million Forecast, by Product Type 2019 & 2032
- Table 19: Global Food Colorant Industry in South Africa Revenue Million Forecast, by Application 2019 & 2032
- Table 20: Global Food Colorant Industry in South Africa Revenue Million Forecast, by Country 2019 & 2032
- Table 21: Brazil Food Colorant Industry in South Africa Revenue (Million) Forecast, by Application 2019 & 2032
- Table 22: Argentina Food Colorant Industry in South Africa Revenue (Million) Forecast, by Application 2019 & 2032
- Table 23: Rest of South America Food Colorant Industry in South Africa Revenue (Million) Forecast, by Application 2019 & 2032
- Table 24: Global Food Colorant Industry in South Africa Revenue Million Forecast, by Product Type 2019 & 2032
- Table 25: Global Food Colorant Industry in South Africa Revenue Million Forecast, by Application 2019 & 2032
- Table 26: Global Food Colorant Industry in South Africa Revenue Million Forecast, by Country 2019 & 2032
- Table 27: United Kingdom Food Colorant Industry in South Africa Revenue (Million) Forecast, by Application 2019 & 2032
- Table 28: Germany Food Colorant Industry in South Africa Revenue (Million) Forecast, by Application 2019 & 2032
- Table 29: France Food Colorant Industry in South Africa Revenue (Million) Forecast, by Application 2019 & 2032
- Table 30: Italy Food Colorant Industry in South Africa Revenue (Million) Forecast, by Application 2019 & 2032
- Table 31: Spain Food Colorant Industry in South Africa Revenue (Million) Forecast, by Application 2019 & 2032
- Table 32: Russia Food Colorant Industry in South Africa Revenue (Million) Forecast, by Application 2019 & 2032
- Table 33: Benelux Food Colorant Industry in South Africa Revenue (Million) Forecast, by Application 2019 & 2032
- Table 34: Nordics Food Colorant Industry in South Africa Revenue (Million) Forecast, by Application 2019 & 2032
- Table 35: Rest of Europe Food Colorant Industry in South Africa Revenue (Million) Forecast, by Application 2019 & 2032
- Table 36: Global Food Colorant Industry in South Africa Revenue Million Forecast, by Product Type 2019 & 2032
- Table 37: Global Food Colorant Industry in South Africa Revenue Million Forecast, by Application 2019 & 2032
- Table 38: Global Food Colorant Industry in South Africa Revenue Million Forecast, by Country 2019 & 2032
- Table 39: Turkey Food Colorant Industry in South Africa Revenue (Million) Forecast, by Application 2019 & 2032
- Table 40: Israel Food Colorant Industry in South Africa Revenue (Million) Forecast, by Application 2019 & 2032
- Table 41: GCC Food Colorant Industry in South Africa Revenue (Million) Forecast, by Application 2019 & 2032
- Table 42: North Africa Food Colorant Industry in South Africa Revenue (Million) Forecast, by Application 2019 & 2032
- Table 43: South Africa Food Colorant Industry in South Africa Revenue (Million) Forecast, by Application 2019 & 2032
- Table 44: Rest of Middle East & Africa Food Colorant Industry in South Africa Revenue (Million) Forecast, by Application 2019 & 2032
- Table 45: Global Food Colorant Industry in South Africa Revenue Million Forecast, by Product Type 2019 & 2032
- Table 46: Global Food Colorant Industry in South Africa Revenue Million Forecast, by Application 2019 & 2032
- Table 47: Global Food Colorant Industry in South Africa Revenue Million Forecast, by Country 2019 & 2032
- Table 48: China Food Colorant Industry in South Africa Revenue (Million) Forecast, by Application 2019 & 2032
- Table 49: India Food Colorant Industry in South Africa Revenue (Million) Forecast, by Application 2019 & 2032
- Table 50: Japan Food Colorant Industry in South Africa Revenue (Million) Forecast, by Application 2019 & 2032
- Table 51: South Korea Food Colorant Industry in South Africa Revenue (Million) Forecast, by Application 2019 & 2032
- Table 52: ASEAN Food Colorant Industry in South Africa Revenue (Million) Forecast, by Application 2019 & 2032
- Table 53: Oceania Food Colorant Industry in South Africa Revenue (Million) Forecast, by Application 2019 & 2032
- Table 54: Rest of Asia Pacific Food Colorant Industry in South Africa Revenue (Million) Forecast, by Application 2019 & 2032
Frequently Asked Questions
1. What is the projected Compound Annual Growth Rate (CAGR) of the Food Colorant Industry in South Africa?
The projected CAGR is approximately 4.60%.
2. Which companies are prominent players in the Food Colorant Industry in South Africa?
Key companies in the market include Nicola J Flavors & Fragrances, Chemical Services Ltd (Lake Foods), Sensient Technologies, Chr Hansen holdings A/S, BASF SE, Quantum Colors S, EDCOL.
3. What are the main segments of the Food Colorant Industry in South Africa?
The market segments include Product Type, Application.
4. Can you provide details about the market size?
The market size is estimated to be USD XX Million as of 2022.
5. What are some drivers contributing to market growth?
Rising Health Consciousness among consumer.
6. What are the notable trends driving market growth?
Growing Emergence of Natural Color.
7. Are there any restraints impacting market growth?
High Cost of natural Ingredients.
8. Can you provide examples of recent developments in the market?
N/A
9. What pricing options are available for accessing the report?
Pricing options include single-user, multi-user, and enterprise licenses priced at USD 3800, USD 4500, and USD 5800 respectively.
10. Is the market size provided in terms of value or volume?
The market size is provided in terms of value, measured in Million.
11. Are there any specific market keywords associated with the report?
Yes, the market keyword associated with the report is "Food Colorant Industry in South Africa," which aids in identifying and referencing the specific market segment covered.
12. How do I determine which pricing option suits my needs best?
The pricing options vary based on user requirements and access needs. Individual users may opt for single-user licenses, while businesses requiring broader access may choose multi-user or enterprise licenses for cost-effective access to the report.
13. Are there any additional resources or data provided in the Food Colorant Industry in South Africa report?
While the report offers comprehensive insights, it's advisable to review the specific contents or supplementary materials provided to ascertain if additional resources or data are available.
14. How can I stay updated on further developments or reports in the Food Colorant Industry in South Africa?
To stay informed about further developments, trends, and reports in the Food Colorant Industry in South Africa, consider subscribing to industry newsletters, following relevant companies and organizations, or regularly checking reputable industry news sources and publications.
Methodology
Step 1 - Identification of Relevant Samples Size from Population Database


Step 2 - Approaches for Defining Global Market Size (Value, Volume* & Price*)

Note*: In applicable scenarios
Step 3 - Data Sources
Primary Research
- Web Analytics
- Survey Reports
- Research Institute
- Latest Research Reports
- Opinion Leaders
Secondary Research
- Annual Reports
- White Paper
- Latest Press Release
- Industry Association
- Paid Database
- Investor Presentations

Step 4 - Data Triangulation
Involves using different sources of information in order to increase the validity of a study
These sources are likely to be stakeholders in a program - participants, other researchers, program staff, other community members, and so on.
Then we put all data in single framework & apply various statistical tools to find out the dynamic on the market.
During the analysis stage, feedback from the stakeholder groups would be compared to determine areas of agreement as well as areas of divergence


