
Key Insights
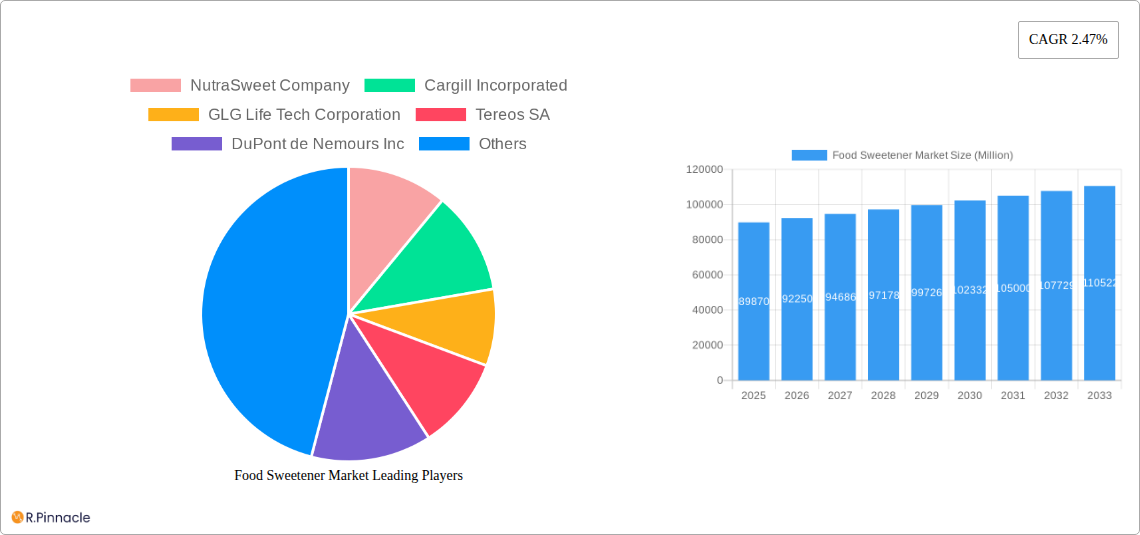
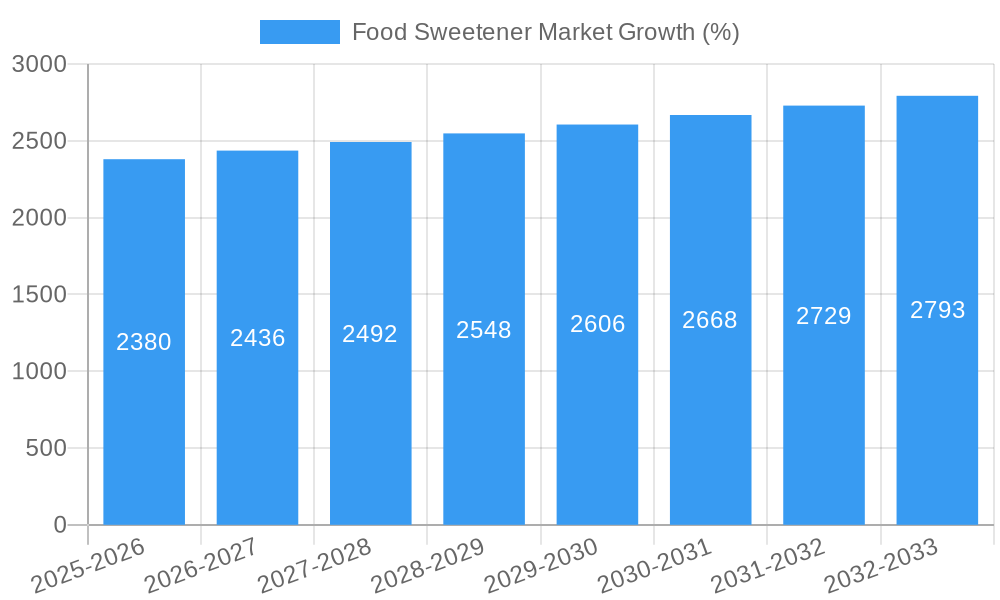
The global food sweetener market, valued at $89.87 billion in 2025, is projected to experience steady growth, driven by increasing demand for convenient and processed foods, a growing global population with a preference for sweet tastes, and the expanding use of sweeteners in various food and beverage applications. The market's Compound Annual Growth Rate (CAGR) of 2.47% from 2025 to 2033 indicates a consistent, albeit moderate, expansion. Key segments driving this growth include high-intensity sweeteners (HIS) within the starch sweeteners and sugar alcohols category, largely fueled by health-conscious consumers seeking reduced-calorie options. The bakery and confectionery sector remains a dominant application area, followed by dairy and desserts, beverages, and savory applications such as meat products and sauces. Competition is fierce, with major players like NutraSweet, Cargill, and Ingredion vying for market share through innovation, product diversification, and strategic acquisitions. While the market faces potential restraints such as fluctuating raw material prices and increasing health concerns surrounding artificial sweeteners, the overall outlook remains positive, driven by continuous product development and exploration of novel sweetener options.
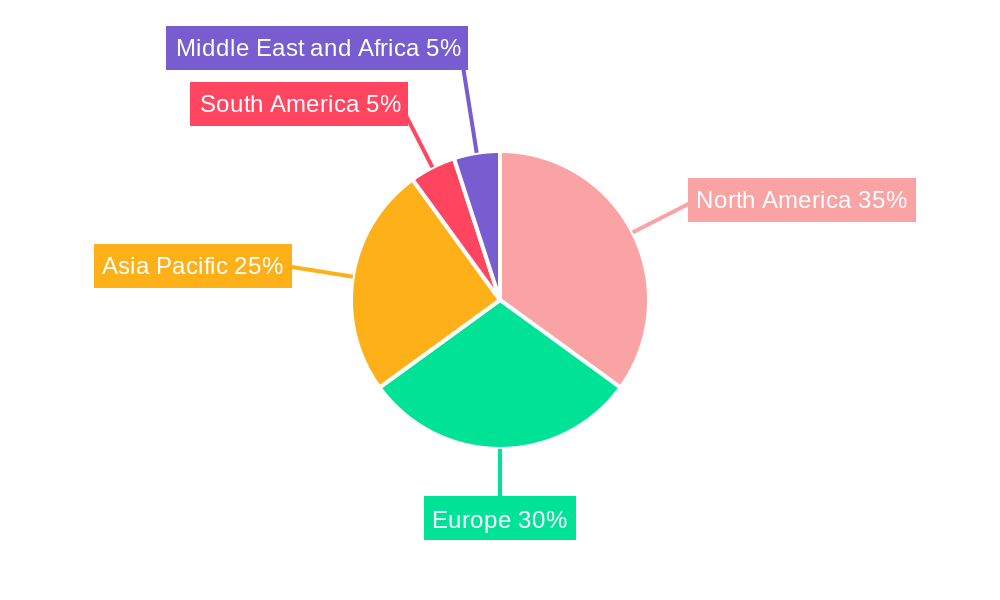
The regional landscape reveals a diverse market distribution. North America and Europe are currently established markets with significant consumption, while Asia-Pacific demonstrates significant potential for future growth given its large and rapidly expanding population and rising disposable incomes. South America and the Middle East and Africa also present promising, albeit less mature, opportunities for market expansion. This growth will be influenced by factors such as economic development, changing consumer preferences, and government regulations regarding food additives and labeling. The success of companies in this market will hinge on their ability to cater to specific regional tastes and preferences, adapting their products and marketing strategies accordingly. Furthermore, a focus on sustainability and transparency throughout the supply chain is becoming increasingly crucial for maintaining consumer trust and long-term market success.
Food Sweetener Market Report: A Comprehensive Analysis (2019-2033)
This comprehensive report provides an in-depth analysis of the global Food Sweetener Market, offering invaluable insights for industry professionals, investors, and strategic decision-makers. Covering the period from 2019 to 2033, with a base year of 2025, this report meticulously examines market dynamics, key players, emerging trends, and future growth prospects. The market is projected to reach xx Million by 2033, exhibiting a CAGR of xx% during the forecast period (2025-2033).
Food Sweetener Market Structure & Innovation Trends
This section analyzes the competitive landscape of the food sweetener market, encompassing market concentration, innovation drivers, regulatory frameworks, product substitutes, end-user demographics, and mergers & acquisitions (M&A) activities. The market is moderately concentrated, with key players holding significant market share. For example, Cargill Incorporated and Tate & Lyle PLC individually hold approximately xx% and xx% of the market share respectively (2024 estimates). Innovation is primarily driven by consumer demand for healthier, low-calorie options, leading to the development of high-intensity sweeteners (HIS) and sugar substitutes. Stringent regulatory frameworks concerning labeling and health claims significantly influence market dynamics. Product substitutes, such as natural sweeteners like stevia and monk fruit, are gaining traction, posing a challenge to traditional sweeteners. The M&A landscape is characterized by strategic acquisitions aimed at expanding product portfolios and market reach. Total M&A deal value in the sector reached approximately xx Million in 2024.
- Market Concentration: Moderately concentrated with key players holding significant shares.
- Innovation Drivers: Health consciousness, demand for low-calorie options.
- Regulatory Frameworks: Stringent regulations impacting labeling and health claims.
- Product Substitutes: Growing popularity of natural sweeteners.
- End-User Demographics: Shifting consumer preferences towards healthier lifestyles.
- M&A Activities: Strategic acquisitions driving market consolidation.
Food Sweetener Market Dynamics & Trends
The food sweetener market is experiencing significant transformations driven by several factors. The increasing prevalence of diet-conscious consumers fuels demand for low-calorie and zero-calorie sweeteners. Technological advancements in sweetener production and formulation are also playing a pivotal role. The rising incidence of diabetes and obesity globally is further boosting the demand for sugar substitutes. Competitive dynamics are intense, with existing players continuously innovating and new entrants emerging with unique sweetener offerings. Market penetration of high-intensity sweeteners is rapidly increasing, projected to reach xx% by 2033. The market is expected to grow at a CAGR of xx% from 2025 to 2033. Consumer preferences are shifting towards natural and sustainably sourced sweeteners, creating opportunities for companies focusing on these aspects.
Dominant Regions & Segments in Food Sweetener Market
The North American region currently dominates the global food sweetener market, driven by high per capita consumption of processed foods and beverages. Within product types, sucrose (common sugar) maintains a significant market share, although the demand for starch sweeteners and high-intensity sweeteners is growing rapidly. The bakery and confectionery segment constitutes a major application area, followed by the beverages sector.
- Leading Region: North America
- Leading Product Type: Sucrose (Common Sugar), but HIS is growing fastest.
- Leading Application: Bakery and Confectionery
- Key Drivers (North America): High processed food consumption, strong food and beverage industry.
- Key Drivers (Asia-Pacific): Growing population, increasing disposable incomes, rising health awareness (driving HIS segment).
Food Sweetener Market Product Innovations
Recent innovations focus on developing healthier, more sustainable, and functional sweeteners. This includes the introduction of novel high-intensity sweeteners with improved taste profiles and functionalities, such as Brazzein launched by Sweegen in 2022. Furthermore, there's a growing emphasis on natural and plant-based sweeteners, responding to increasing consumer demand for clean-label products. Technological advancements in extraction and processing techniques are enhancing the efficiency and cost-effectiveness of sweetener production.
Report Scope & Segmentation Analysis
This report segments the food sweetener market by product type (Sucrose (Common Sugar), Starch Sweeteners and Sugar Alcohols, High-intensity Sweeteners (HIS)) and application (Bakery and Confectionery, Dairy and Desserts, Beverages, Meat and Meat Products, Soups, Sauces, and Dressings, Other Applications). Each segment's growth projections, market size, and competitive dynamics are analyzed. For instance, the HIS segment is projected to witness the fastest growth due to its health benefits and versatility. The bakery and confectionary segment dominates in terms of application.
Key Drivers of Food Sweetener Market Growth
Several factors contribute to the growth of the food sweetener market. The growing demand for processed foods and beverages is a significant driver. Health concerns, leading to increased consumption of sugar substitutes and low-calorie options, also fuel market growth. Technological advancements in sweetener production and formulation enhance product quality and efficiency, further stimulating the market. Favorable economic conditions in developing economies contribute to increased demand for processed foods containing sweeteners.
Challenges in the Food Sweetener Market Sector
The food sweetener market faces challenges, including stringent regulations regarding food additives and labeling, creating compliance hurdles for manufacturers. Supply chain disruptions can impact sweetener availability and pricing. Intense competition among existing players and the emergence of new entrants put pressure on margins. Fluctuations in raw material prices also pose a considerable challenge.
Emerging Opportunities in Food Sweetener Market
Emerging opportunities lie in the development and commercialization of novel, sustainable, and natural sweeteners. Growing consumer awareness of health and wellness creates a demand for healthier alternatives to traditional sugar. Expanding into emerging markets with high growth potential presents substantial opportunities for market players. Innovation in sweetener applications beyond traditional food and beverage sectors offers additional avenues for growth.
Leading Players in the Food Sweetener Market Market
- NutraSweet Company
- Cargill Incorporated
- GLG Life Tech Corporation
- Tereos SA
- DuPont de Nemours Inc
- Archer Daniels Midland Company
- Ajinomoto Co Inc
- Tate & Lyle PLC
- Foodchem International Corporation
- Ingredion Incorporated
Key Developments in Food Sweetener Market Industry
- September 2022: Cargill opened a new corn wet mill in Pandaan, Indonesia, expanding its capacity to meet growing demand in Asia.
- 2022: Sweegen launched Brazzein, a zero-calorie, high-intensity sweetener, signifying innovation in the HIS segment.
- July 2021: Layn Natural Ingredients announced a USD 148 billion investment to expand its stevia leaf extract production capacity, showcasing the growing market for natural sweeteners.
Future Outlook for Food Sweetener Market Market
The future of the food sweetener market is promising, driven by sustained growth in the processed food and beverage industry. The increasing demand for healthier and more sustainable sweeteners will continue to shape market trends. Innovation in sweetener technology and the exploration of new applications will play a key role in driving future growth. Strategic partnerships and acquisitions will further consolidate market positions. The market is poised for robust expansion in the coming years.
Food Sweetener Market Segmentation
-
1. Product Type
- 1.1. Sucrose (Common Sugar)
-
1.2. Starch Sweeteners and Sugar Alcohols
- 1.2.1. Dextrose
- 1.2.2. High Fructose Corn Syrup (HFCS)
- 1.2.3. Maltodextrin
- 1.2.4. Sorbitol
- 1.2.5. Xylitol
- 1.2.6. Other Starch Sweeteners and Sugar Alcohols
-
1.3. High-intensity Sweeteners (HIS)
- 1.3.1. Sucralose
- 1.3.2. Aspartame
- 1.3.3. Saccharin
- 1.3.4. Neotame
- 1.3.5. Stevia
- 1.3.6. Cyclamate
- 1.3.7. Ascesulfame Potassium (Ace-K)
- 1.3.8. Other High-intensity Sweeteners
-
2. Application
- 2.1. Bakery and Confectionery
- 2.2. Dairy and Desserts
- 2.3. Beverages
- 2.4. Meat and Meat Products
- 2.5. Soups, Sauces, and Dressings
- 2.6. Other Applications
Food Sweetener Market Segmentation By Geography
-
1. North America
- 1.1. United States
- 1.2. Canada
- 1.3. Mexico
- 1.4. Rest of North America
-
2. Europe
- 2.1. United Kingdom
- 2.2. Germany
- 2.3. France
- 2.4. Spain
- 2.5. Italy
- 2.6. Russia
- 2.7. Rest of Europe
-
3. Asia Pacific
- 3.1. China
- 3.2. Japan
- 3.3. India
- 3.4. Australia
- 3.5. Rest of Asia Pacific
-
4. South America
- 4.1. Brazil
- 4.2. Argentina
- 4.3. Rest of South America
-
5. Middle East and Africa
- 5.1. South Africa
- 5.2. Saudi Arabia
- 5.3. Rest of Middle East and Africa
Food Sweetener Market REPORT HIGHLIGHTS
| Aspects | Details |
|---|---|
| Study Period | 2019-2033 |
| Base Year | 2024 |
| Estimated Year | 2025 |
| Forecast Period | 2025-2033 |
| Historical Period | 2019-2024 |
| Growth Rate | CAGR of 2.47% from 2019-2033 |
| Segmentation |
|
Table of Contents
- 1. Introduction
- 1.1. Research Scope
- 1.2. Market Segmentation
- 1.3. Research Methodology
- 1.4. Definitions and Assumptions
- 2. Executive Summary
- 2.1. Introduction
- 3. Market Dynamics
- 3.1. Introduction
- 3.2. Market Drivers
- 3.2.1. Rising Application in Dietary Supplements
- 3.3. Market Restrains
- 3.3.1. Increasing prevalence of hydroglycemia
- 3.4. Market Trends
- 3.4.1. Shift Toward Convenience and Processed Food Consumption
- 4. Market Factor Analysis
- 4.1. Porters Five Forces
- 4.2. Supply/Value Chain
- 4.3. PESTEL analysis
- 4.4. Market Entropy
- 4.5. Patent/Trademark Analysis
- 5. Global Food Sweetener Market Analysis, Insights and Forecast, 2019-2031
- 5.1. Market Analysis, Insights and Forecast - by Product Type
- 5.1.1. Sucrose (Common Sugar)
- 5.1.2. Starch Sweeteners and Sugar Alcohols
- 5.1.2.1. Dextrose
- 5.1.2.2. High Fructose Corn Syrup (HFCS)
- 5.1.2.3. Maltodextrin
- 5.1.2.4. Sorbitol
- 5.1.2.5. Xylitol
- 5.1.2.6. Other Starch Sweeteners and Sugar Alcohols
- 5.1.3. High-intensity Sweeteners (HIS)
- 5.1.3.1. Sucralose
- 5.1.3.2. Aspartame
- 5.1.3.3. Saccharin
- 5.1.3.4. Neotame
- 5.1.3.5. Stevia
- 5.1.3.6. Cyclamate
- 5.1.3.7. Ascesulfame Potassium (Ace-K)
- 5.1.3.8. Other High-intensity Sweeteners
- 5.2. Market Analysis, Insights and Forecast - by Application
- 5.2.1. Bakery and Confectionery
- 5.2.2. Dairy and Desserts
- 5.2.3. Beverages
- 5.2.4. Meat and Meat Products
- 5.2.5. Soups, Sauces, and Dressings
- 5.2.6. Other Applications
- 5.3. Market Analysis, Insights and Forecast - by Region
- 5.3.1. North America
- 5.3.2. Europe
- 5.3.3. Asia Pacific
- 5.3.4. South America
- 5.3.5. Middle East and Africa
- 5.1. Market Analysis, Insights and Forecast - by Product Type
- 6. North America Food Sweetener Market Analysis, Insights and Forecast, 2019-2031
- 6.1. Market Analysis, Insights and Forecast - by Product Type
- 6.1.1. Sucrose (Common Sugar)
- 6.1.2. Starch Sweeteners and Sugar Alcohols
- 6.1.2.1. Dextrose
- 6.1.2.2. High Fructose Corn Syrup (HFCS)
- 6.1.2.3. Maltodextrin
- 6.1.2.4. Sorbitol
- 6.1.2.5. Xylitol
- 6.1.2.6. Other Starch Sweeteners and Sugar Alcohols
- 6.1.3. High-intensity Sweeteners (HIS)
- 6.1.3.1. Sucralose
- 6.1.3.2. Aspartame
- 6.1.3.3. Saccharin
- 6.1.3.4. Neotame
- 6.1.3.5. Stevia
- 6.1.3.6. Cyclamate
- 6.1.3.7. Ascesulfame Potassium (Ace-K)
- 6.1.3.8. Other High-intensity Sweeteners
- 6.2. Market Analysis, Insights and Forecast - by Application
- 6.2.1. Bakery and Confectionery
- 6.2.2. Dairy and Desserts
- 6.2.3. Beverages
- 6.2.4. Meat and Meat Products
- 6.2.5. Soups, Sauces, and Dressings
- 6.2.6. Other Applications
- 6.1. Market Analysis, Insights and Forecast - by Product Type
- 7. Europe Food Sweetener Market Analysis, Insights and Forecast, 2019-2031
- 7.1. Market Analysis, Insights and Forecast - by Product Type
- 7.1.1. Sucrose (Common Sugar)
- 7.1.2. Starch Sweeteners and Sugar Alcohols
- 7.1.2.1. Dextrose
- 7.1.2.2. High Fructose Corn Syrup (HFCS)
- 7.1.2.3. Maltodextrin
- 7.1.2.4. Sorbitol
- 7.1.2.5. Xylitol
- 7.1.2.6. Other Starch Sweeteners and Sugar Alcohols
- 7.1.3. High-intensity Sweeteners (HIS)
- 7.1.3.1. Sucralose
- 7.1.3.2. Aspartame
- 7.1.3.3. Saccharin
- 7.1.3.4. Neotame
- 7.1.3.5. Stevia
- 7.1.3.6. Cyclamate
- 7.1.3.7. Ascesulfame Potassium (Ace-K)
- 7.1.3.8. Other High-intensity Sweeteners
- 7.2. Market Analysis, Insights and Forecast - by Application
- 7.2.1. Bakery and Confectionery
- 7.2.2. Dairy and Desserts
- 7.2.3. Beverages
- 7.2.4. Meat and Meat Products
- 7.2.5. Soups, Sauces, and Dressings
- 7.2.6. Other Applications
- 7.1. Market Analysis, Insights and Forecast - by Product Type
- 8. Asia Pacific Food Sweetener Market Analysis, Insights and Forecast, 2019-2031
- 8.1. Market Analysis, Insights and Forecast - by Product Type
- 8.1.1. Sucrose (Common Sugar)
- 8.1.2. Starch Sweeteners and Sugar Alcohols
- 8.1.2.1. Dextrose
- 8.1.2.2. High Fructose Corn Syrup (HFCS)
- 8.1.2.3. Maltodextrin
- 8.1.2.4. Sorbitol
- 8.1.2.5. Xylitol
- 8.1.2.6. Other Starch Sweeteners and Sugar Alcohols
- 8.1.3. High-intensity Sweeteners (HIS)
- 8.1.3.1. Sucralose
- 8.1.3.2. Aspartame
- 8.1.3.3. Saccharin
- 8.1.3.4. Neotame
- 8.1.3.5. Stevia
- 8.1.3.6. Cyclamate
- 8.1.3.7. Ascesulfame Potassium (Ace-K)
- 8.1.3.8. Other High-intensity Sweeteners
- 8.2. Market Analysis, Insights and Forecast - by Application
- 8.2.1. Bakery and Confectionery
- 8.2.2. Dairy and Desserts
- 8.2.3. Beverages
- 8.2.4. Meat and Meat Products
- 8.2.5. Soups, Sauces, and Dressings
- 8.2.6. Other Applications
- 8.1. Market Analysis, Insights and Forecast - by Product Type
- 9. South America Food Sweetener Market Analysis, Insights and Forecast, 2019-2031
- 9.1. Market Analysis, Insights and Forecast - by Product Type
- 9.1.1. Sucrose (Common Sugar)
- 9.1.2. Starch Sweeteners and Sugar Alcohols
- 9.1.2.1. Dextrose
- 9.1.2.2. High Fructose Corn Syrup (HFCS)
- 9.1.2.3. Maltodextrin
- 9.1.2.4. Sorbitol
- 9.1.2.5. Xylitol
- 9.1.2.6. Other Starch Sweeteners and Sugar Alcohols
- 9.1.3. High-intensity Sweeteners (HIS)
- 9.1.3.1. Sucralose
- 9.1.3.2. Aspartame
- 9.1.3.3. Saccharin
- 9.1.3.4. Neotame
- 9.1.3.5. Stevia
- 9.1.3.6. Cyclamate
- 9.1.3.7. Ascesulfame Potassium (Ace-K)
- 9.1.3.8. Other High-intensity Sweeteners
- 9.2. Market Analysis, Insights and Forecast - by Application
- 9.2.1. Bakery and Confectionery
- 9.2.2. Dairy and Desserts
- 9.2.3. Beverages
- 9.2.4. Meat and Meat Products
- 9.2.5. Soups, Sauces, and Dressings
- 9.2.6. Other Applications
- 9.1. Market Analysis, Insights and Forecast - by Product Type
- 10. Middle East and Africa Food Sweetener Market Analysis, Insights and Forecast, 2019-2031
- 10.1. Market Analysis, Insights and Forecast - by Product Type
- 10.1.1. Sucrose (Common Sugar)
- 10.1.2. Starch Sweeteners and Sugar Alcohols
- 10.1.2.1. Dextrose
- 10.1.2.2. High Fructose Corn Syrup (HFCS)
- 10.1.2.3. Maltodextrin
- 10.1.2.4. Sorbitol
- 10.1.2.5. Xylitol
- 10.1.2.6. Other Starch Sweeteners and Sugar Alcohols
- 10.1.3. High-intensity Sweeteners (HIS)
- 10.1.3.1. Sucralose
- 10.1.3.2. Aspartame
- 10.1.3.3. Saccharin
- 10.1.3.4. Neotame
- 10.1.3.5. Stevia
- 10.1.3.6. Cyclamate
- 10.1.3.7. Ascesulfame Potassium (Ace-K)
- 10.1.3.8. Other High-intensity Sweeteners
- 10.2. Market Analysis, Insights and Forecast - by Application
- 10.2.1. Bakery and Confectionery
- 10.2.2. Dairy and Desserts
- 10.2.3. Beverages
- 10.2.4. Meat and Meat Products
- 10.2.5. Soups, Sauces, and Dressings
- 10.2.6. Other Applications
- 10.1. Market Analysis, Insights and Forecast - by Product Type
- 11. North America Food Sweetener Market Analysis, Insights and Forecast, 2019-2031
- 11.1. Market Analysis, Insights and Forecast - By Country/Sub-region
- 11.1.1 United States
- 11.1.2 Canada
- 11.1.3 Mexico
- 11.1.4 Rest of North America
- 12. Europe Food Sweetener Market Analysis, Insights and Forecast, 2019-2031
- 12.1. Market Analysis, Insights and Forecast - By Country/Sub-region
- 12.1.1 United Kingdom
- 12.1.2 Germany
- 12.1.3 France
- 12.1.4 Spain
- 12.1.5 Italy
- 12.1.6 Russia
- 12.1.7 Rest of Europe
- 13. Asia Pacific Food Sweetener Market Analysis, Insights and Forecast, 2019-2031
- 13.1. Market Analysis, Insights and Forecast - By Country/Sub-region
- 13.1.1 China
- 13.1.2 Japan
- 13.1.3 India
- 13.1.4 Australia
- 13.1.5 Rest of Asia Pacific
- 14. South America Food Sweetener Market Analysis, Insights and Forecast, 2019-2031
- 14.1. Market Analysis, Insights and Forecast - By Country/Sub-region
- 14.1.1 Brazil
- 14.1.2 Argentina
- 14.1.3 Rest of South America
- 15. Middle East and Africa Food Sweetener Market Analysis, Insights and Forecast, 2019-2031
- 15.1. Market Analysis, Insights and Forecast - By Country/Sub-region
- 15.1.1 South Africa
- 15.1.2 Saudi Arabia
- 15.1.3 Rest of Middle East and Africa
- 16. Competitive Analysis
- 16.1. Global Market Share Analysis 2024
- 16.2. Company Profiles
- 16.2.1 NutraSweet Company
- 16.2.1.1. Overview
- 16.2.1.2. Products
- 16.2.1.3. SWOT Analysis
- 16.2.1.4. Recent Developments
- 16.2.1.5. Financials (Based on Availability)
- 16.2.2 Cargill Incorporated
- 16.2.2.1. Overview
- 16.2.2.2. Products
- 16.2.2.3. SWOT Analysis
- 16.2.2.4. Recent Developments
- 16.2.2.5. Financials (Based on Availability)
- 16.2.3 GLG Life Tech Corporation
- 16.2.3.1. Overview
- 16.2.3.2. Products
- 16.2.3.3. SWOT Analysis
- 16.2.3.4. Recent Developments
- 16.2.3.5. Financials (Based on Availability)
- 16.2.4 Tereos SA
- 16.2.4.1. Overview
- 16.2.4.2. Products
- 16.2.4.3. SWOT Analysis
- 16.2.4.4. Recent Developments
- 16.2.4.5. Financials (Based on Availability)
- 16.2.5 DuPont de Nemours Inc
- 16.2.5.1. Overview
- 16.2.5.2. Products
- 16.2.5.3. SWOT Analysis
- 16.2.5.4. Recent Developments
- 16.2.5.5. Financials (Based on Availability)
- 16.2.6 Archer Daniels Midland Company
- 16.2.6.1. Overview
- 16.2.6.2. Products
- 16.2.6.3. SWOT Analysis
- 16.2.6.4. Recent Developments
- 16.2.6.5. Financials (Based on Availability)
- 16.2.7 Ajinomoto Co Inc
- 16.2.7.1. Overview
- 16.2.7.2. Products
- 16.2.7.3. SWOT Analysis
- 16.2.7.4. Recent Developments
- 16.2.7.5. Financials (Based on Availability)
- 16.2.8 Tate & Lyle PLC
- 16.2.8.1. Overview
- 16.2.8.2. Products
- 16.2.8.3. SWOT Analysis
- 16.2.8.4. Recent Developments
- 16.2.8.5. Financials (Based on Availability)
- 16.2.9 Foodchem International Corporation*List Not Exhaustive
- 16.2.9.1. Overview
- 16.2.9.2. Products
- 16.2.9.3. SWOT Analysis
- 16.2.9.4. Recent Developments
- 16.2.9.5. Financials (Based on Availability)
- 16.2.10 Ingredion Incorporated
- 16.2.10.1. Overview
- 16.2.10.2. Products
- 16.2.10.3. SWOT Analysis
- 16.2.10.4. Recent Developments
- 16.2.10.5. Financials (Based on Availability)
- 16.2.1 NutraSweet Company
List of Figures
- Figure 1: Global Food Sweetener Market Revenue Breakdown (Million, %) by Region 2024 & 2032
- Figure 2: Global Food Sweetener Market Volume Breakdown (K Tons, %) by Region 2024 & 2032
- Figure 3: North America Food Sweetener Market Revenue (Million), by Country 2024 & 2032
- Figure 4: North America Food Sweetener Market Volume (K Tons), by Country 2024 & 2032
- Figure 5: North America Food Sweetener Market Revenue Share (%), by Country 2024 & 2032
- Figure 6: North America Food Sweetener Market Volume Share (%), by Country 2024 & 2032
- Figure 7: Europe Food Sweetener Market Revenue (Million), by Country 2024 & 2032
- Figure 8: Europe Food Sweetener Market Volume (K Tons), by Country 2024 & 2032
- Figure 9: Europe Food Sweetener Market Revenue Share (%), by Country 2024 & 2032
- Figure 10: Europe Food Sweetener Market Volume Share (%), by Country 2024 & 2032
- Figure 11: Asia Pacific Food Sweetener Market Revenue (Million), by Country 2024 & 2032
- Figure 12: Asia Pacific Food Sweetener Market Volume (K Tons), by Country 2024 & 2032
- Figure 13: Asia Pacific Food Sweetener Market Revenue Share (%), by Country 2024 & 2032
- Figure 14: Asia Pacific Food Sweetener Market Volume Share (%), by Country 2024 & 2032
- Figure 15: South America Food Sweetener Market Revenue (Million), by Country 2024 & 2032
- Figure 16: South America Food Sweetener Market Volume (K Tons), by Country 2024 & 2032
- Figure 17: South America Food Sweetener Market Revenue Share (%), by Country 2024 & 2032
- Figure 18: South America Food Sweetener Market Volume Share (%), by Country 2024 & 2032
- Figure 19: Middle East and Africa Food Sweetener Market Revenue (Million), by Country 2024 & 2032
- Figure 20: Middle East and Africa Food Sweetener Market Volume (K Tons), by Country 2024 & 2032
- Figure 21: Middle East and Africa Food Sweetener Market Revenue Share (%), by Country 2024 & 2032
- Figure 22: Middle East and Africa Food Sweetener Market Volume Share (%), by Country 2024 & 2032
- Figure 23: North America Food Sweetener Market Revenue (Million), by Product Type 2024 & 2032
- Figure 24: North America Food Sweetener Market Volume (K Tons), by Product Type 2024 & 2032
- Figure 25: North America Food Sweetener Market Revenue Share (%), by Product Type 2024 & 2032
- Figure 26: North America Food Sweetener Market Volume Share (%), by Product Type 2024 & 2032
- Figure 27: North America Food Sweetener Market Revenue (Million), by Application 2024 & 2032
- Figure 28: North America Food Sweetener Market Volume (K Tons), by Application 2024 & 2032
- Figure 29: North America Food Sweetener Market Revenue Share (%), by Application 2024 & 2032
- Figure 30: North America Food Sweetener Market Volume Share (%), by Application 2024 & 2032
- Figure 31: North America Food Sweetener Market Revenue (Million), by Country 2024 & 2032
- Figure 32: North America Food Sweetener Market Volume (K Tons), by Country 2024 & 2032
- Figure 33: North America Food Sweetener Market Revenue Share (%), by Country 2024 & 2032
- Figure 34: North America Food Sweetener Market Volume Share (%), by Country 2024 & 2032
- Figure 35: Europe Food Sweetener Market Revenue (Million), by Product Type 2024 & 2032
- Figure 36: Europe Food Sweetener Market Volume (K Tons), by Product Type 2024 & 2032
- Figure 37: Europe Food Sweetener Market Revenue Share (%), by Product Type 2024 & 2032
- Figure 38: Europe Food Sweetener Market Volume Share (%), by Product Type 2024 & 2032
- Figure 39: Europe Food Sweetener Market Revenue (Million), by Application 2024 & 2032
- Figure 40: Europe Food Sweetener Market Volume (K Tons), by Application 2024 & 2032
- Figure 41: Europe Food Sweetener Market Revenue Share (%), by Application 2024 & 2032
- Figure 42: Europe Food Sweetener Market Volume Share (%), by Application 2024 & 2032
- Figure 43: Europe Food Sweetener Market Revenue (Million), by Country 2024 & 2032
- Figure 44: Europe Food Sweetener Market Volume (K Tons), by Country 2024 & 2032
- Figure 45: Europe Food Sweetener Market Revenue Share (%), by Country 2024 & 2032
- Figure 46: Europe Food Sweetener Market Volume Share (%), by Country 2024 & 2032
- Figure 47: Asia Pacific Food Sweetener Market Revenue (Million), by Product Type 2024 & 2032
- Figure 48: Asia Pacific Food Sweetener Market Volume (K Tons), by Product Type 2024 & 2032
- Figure 49: Asia Pacific Food Sweetener Market Revenue Share (%), by Product Type 2024 & 2032
- Figure 50: Asia Pacific Food Sweetener Market Volume Share (%), by Product Type 2024 & 2032
- Figure 51: Asia Pacific Food Sweetener Market Revenue (Million), by Application 2024 & 2032
- Figure 52: Asia Pacific Food Sweetener Market Volume (K Tons), by Application 2024 & 2032
- Figure 53: Asia Pacific Food Sweetener Market Revenue Share (%), by Application 2024 & 2032
- Figure 54: Asia Pacific Food Sweetener Market Volume Share (%), by Application 2024 & 2032
- Figure 55: Asia Pacific Food Sweetener Market Revenue (Million), by Country 2024 & 2032
- Figure 56: Asia Pacific Food Sweetener Market Volume (K Tons), by Country 2024 & 2032
- Figure 57: Asia Pacific Food Sweetener Market Revenue Share (%), by Country 2024 & 2032
- Figure 58: Asia Pacific Food Sweetener Market Volume Share (%), by Country 2024 & 2032
- Figure 59: South America Food Sweetener Market Revenue (Million), by Product Type 2024 & 2032
- Figure 60: South America Food Sweetener Market Volume (K Tons), by Product Type 2024 & 2032
- Figure 61: South America Food Sweetener Market Revenue Share (%), by Product Type 2024 & 2032
- Figure 62: South America Food Sweetener Market Volume Share (%), by Product Type 2024 & 2032
- Figure 63: South America Food Sweetener Market Revenue (Million), by Application 2024 & 2032
- Figure 64: South America Food Sweetener Market Volume (K Tons), by Application 2024 & 2032
- Figure 65: South America Food Sweetener Market Revenue Share (%), by Application 2024 & 2032
- Figure 66: South America Food Sweetener Market Volume Share (%), by Application 2024 & 2032
- Figure 67: South America Food Sweetener Market Revenue (Million), by Country 2024 & 2032
- Figure 68: South America Food Sweetener Market Volume (K Tons), by Country 2024 & 2032
- Figure 69: South America Food Sweetener Market Revenue Share (%), by Country 2024 & 2032
- Figure 70: South America Food Sweetener Market Volume Share (%), by Country 2024 & 2032
- Figure 71: Middle East and Africa Food Sweetener Market Revenue (Million), by Product Type 2024 & 2032
- Figure 72: Middle East and Africa Food Sweetener Market Volume (K Tons), by Product Type 2024 & 2032
- Figure 73: Middle East and Africa Food Sweetener Market Revenue Share (%), by Product Type 2024 & 2032
- Figure 74: Middle East and Africa Food Sweetener Market Volume Share (%), by Product Type 2024 & 2032
- Figure 75: Middle East and Africa Food Sweetener Market Revenue (Million), by Application 2024 & 2032
- Figure 76: Middle East and Africa Food Sweetener Market Volume (K Tons), by Application 2024 & 2032
- Figure 77: Middle East and Africa Food Sweetener Market Revenue Share (%), by Application 2024 & 2032
- Figure 78: Middle East and Africa Food Sweetener Market Volume Share (%), by Application 2024 & 2032
- Figure 79: Middle East and Africa Food Sweetener Market Revenue (Million), by Country 2024 & 2032
- Figure 80: Middle East and Africa Food Sweetener Market Volume (K Tons), by Country 2024 & 2032
- Figure 81: Middle East and Africa Food Sweetener Market Revenue Share (%), by Country 2024 & 2032
- Figure 82: Middle East and Africa Food Sweetener Market Volume Share (%), by Country 2024 & 2032
List of Tables
- Table 1: Global Food Sweetener Market Revenue Million Forecast, by Region 2019 & 2032
- Table 2: Global Food Sweetener Market Volume K Tons Forecast, by Region 2019 & 2032
- Table 3: Global Food Sweetener Market Revenue Million Forecast, by Product Type 2019 & 2032
- Table 4: Global Food Sweetener Market Volume K Tons Forecast, by Product Type 2019 & 2032
- Table 5: Global Food Sweetener Market Revenue Million Forecast, by Application 2019 & 2032
- Table 6: Global Food Sweetener Market Volume K Tons Forecast, by Application 2019 & 2032
- Table 7: Global Food Sweetener Market Revenue Million Forecast, by Region 2019 & 2032
- Table 8: Global Food Sweetener Market Volume K Tons Forecast, by Region 2019 & 2032
- Table 9: Global Food Sweetener Market Revenue Million Forecast, by Country 2019 & 2032
- Table 10: Global Food Sweetener Market Volume K Tons Forecast, by Country 2019 & 2032
- Table 11: United States Food Sweetener Market Revenue (Million) Forecast, by Application 2019 & 2032
- Table 12: United States Food Sweetener Market Volume (K Tons) Forecast, by Application 2019 & 2032
- Table 13: Canada Food Sweetener Market Revenue (Million) Forecast, by Application 2019 & 2032
- Table 14: Canada Food Sweetener Market Volume (K Tons) Forecast, by Application 2019 & 2032
- Table 15: Mexico Food Sweetener Market Revenue (Million) Forecast, by Application 2019 & 2032
- Table 16: Mexico Food Sweetener Market Volume (K Tons) Forecast, by Application 2019 & 2032
- Table 17: Rest of North America Food Sweetener Market Revenue (Million) Forecast, by Application 2019 & 2032
- Table 18: Rest of North America Food Sweetener Market Volume (K Tons) Forecast, by Application 2019 & 2032
- Table 19: Global Food Sweetener Market Revenue Million Forecast, by Country 2019 & 2032
- Table 20: Global Food Sweetener Market Volume K Tons Forecast, by Country 2019 & 2032
- Table 21: United Kingdom Food Sweetener Market Revenue (Million) Forecast, by Application 2019 & 2032
- Table 22: United Kingdom Food Sweetener Market Volume (K Tons) Forecast, by Application 2019 & 2032
- Table 23: Germany Food Sweetener Market Revenue (Million) Forecast, by Application 2019 & 2032
- Table 24: Germany Food Sweetener Market Volume (K Tons) Forecast, by Application 2019 & 2032
- Table 25: France Food Sweetener Market Revenue (Million) Forecast, by Application 2019 & 2032
- Table 26: France Food Sweetener Market Volume (K Tons) Forecast, by Application 2019 & 2032
- Table 27: Spain Food Sweetener Market Revenue (Million) Forecast, by Application 2019 & 2032
- Table 28: Spain Food Sweetener Market Volume (K Tons) Forecast, by Application 2019 & 2032
- Table 29: Italy Food Sweetener Market Revenue (Million) Forecast, by Application 2019 & 2032
- Table 30: Italy Food Sweetener Market Volume (K Tons) Forecast, by Application 2019 & 2032
- Table 31: Russia Food Sweetener Market Revenue (Million) Forecast, by Application 2019 & 2032
- Table 32: Russia Food Sweetener Market Volume (K Tons) Forecast, by Application 2019 & 2032
- Table 33: Rest of Europe Food Sweetener Market Revenue (Million) Forecast, by Application 2019 & 2032
- Table 34: Rest of Europe Food Sweetener Market Volume (K Tons) Forecast, by Application 2019 & 2032
- Table 35: Global Food Sweetener Market Revenue Million Forecast, by Country 2019 & 2032
- Table 36: Global Food Sweetener Market Volume K Tons Forecast, by Country 2019 & 2032
- Table 37: China Food Sweetener Market Revenue (Million) Forecast, by Application 2019 & 2032
- Table 38: China Food Sweetener Market Volume (K Tons) Forecast, by Application 2019 & 2032
- Table 39: Japan Food Sweetener Market Revenue (Million) Forecast, by Application 2019 & 2032
- Table 40: Japan Food Sweetener Market Volume (K Tons) Forecast, by Application 2019 & 2032
- Table 41: India Food Sweetener Market Revenue (Million) Forecast, by Application 2019 & 2032
- Table 42: India Food Sweetener Market Volume (K Tons) Forecast, by Application 2019 & 2032
- Table 43: Australia Food Sweetener Market Revenue (Million) Forecast, by Application 2019 & 2032
- Table 44: Australia Food Sweetener Market Volume (K Tons) Forecast, by Application 2019 & 2032
- Table 45: Rest of Asia Pacific Food Sweetener Market Revenue (Million) Forecast, by Application 2019 & 2032
- Table 46: Rest of Asia Pacific Food Sweetener Market Volume (K Tons) Forecast, by Application 2019 & 2032
- Table 47: Global Food Sweetener Market Revenue Million Forecast, by Country 2019 & 2032
- Table 48: Global Food Sweetener Market Volume K Tons Forecast, by Country 2019 & 2032
- Table 49: Brazil Food Sweetener Market Revenue (Million) Forecast, by Application 2019 & 2032
- Table 50: Brazil Food Sweetener Market Volume (K Tons) Forecast, by Application 2019 & 2032
- Table 51: Argentina Food Sweetener Market Revenue (Million) Forecast, by Application 2019 & 2032
- Table 52: Argentina Food Sweetener Market Volume (K Tons) Forecast, by Application 2019 & 2032
- Table 53: Rest of South America Food Sweetener Market Revenue (Million) Forecast, by Application 2019 & 2032
- Table 54: Rest of South America Food Sweetener Market Volume (K Tons) Forecast, by Application 2019 & 2032
- Table 55: Global Food Sweetener Market Revenue Million Forecast, by Country 2019 & 2032
- Table 56: Global Food Sweetener Market Volume K Tons Forecast, by Country 2019 & 2032
- Table 57: South Africa Food Sweetener Market Revenue (Million) Forecast, by Application 2019 & 2032
- Table 58: South Africa Food Sweetener Market Volume (K Tons) Forecast, by Application 2019 & 2032
- Table 59: Saudi Arabia Food Sweetener Market Revenue (Million) Forecast, by Application 2019 & 2032
- Table 60: Saudi Arabia Food Sweetener Market Volume (K Tons) Forecast, by Application 2019 & 2032
- Table 61: Rest of Middle East and Africa Food Sweetener Market Revenue (Million) Forecast, by Application 2019 & 2032
- Table 62: Rest of Middle East and Africa Food Sweetener Market Volume (K Tons) Forecast, by Application 2019 & 2032
- Table 63: Global Food Sweetener Market Revenue Million Forecast, by Product Type 2019 & 2032
- Table 64: Global Food Sweetener Market Volume K Tons Forecast, by Product Type 2019 & 2032
- Table 65: Global Food Sweetener Market Revenue Million Forecast, by Application 2019 & 2032
- Table 66: Global Food Sweetener Market Volume K Tons Forecast, by Application 2019 & 2032
- Table 67: Global Food Sweetener Market Revenue Million Forecast, by Country 2019 & 2032
- Table 68: Global Food Sweetener Market Volume K Tons Forecast, by Country 2019 & 2032
- Table 69: United States Food Sweetener Market Revenue (Million) Forecast, by Application 2019 & 2032
- Table 70: United States Food Sweetener Market Volume (K Tons) Forecast, by Application 2019 & 2032
- Table 71: Canada Food Sweetener Market Revenue (Million) Forecast, by Application 2019 & 2032
- Table 72: Canada Food Sweetener Market Volume (K Tons) Forecast, by Application 2019 & 2032
- Table 73: Mexico Food Sweetener Market Revenue (Million) Forecast, by Application 2019 & 2032
- Table 74: Mexico Food Sweetener Market Volume (K Tons) Forecast, by Application 2019 & 2032
- Table 75: Rest of North America Food Sweetener Market Revenue (Million) Forecast, by Application 2019 & 2032
- Table 76: Rest of North America Food Sweetener Market Volume (K Tons) Forecast, by Application 2019 & 2032
- Table 77: Global Food Sweetener Market Revenue Million Forecast, by Product Type 2019 & 2032
- Table 78: Global Food Sweetener Market Volume K Tons Forecast, by Product Type 2019 & 2032
- Table 79: Global Food Sweetener Market Revenue Million Forecast, by Application 2019 & 2032
- Table 80: Global Food Sweetener Market Volume K Tons Forecast, by Application 2019 & 2032
- Table 81: Global Food Sweetener Market Revenue Million Forecast, by Country 2019 & 2032
- Table 82: Global Food Sweetener Market Volume K Tons Forecast, by Country 2019 & 2032
- Table 83: United Kingdom Food Sweetener Market Revenue (Million) Forecast, by Application 2019 & 2032
- Table 84: United Kingdom Food Sweetener Market Volume (K Tons) Forecast, by Application 2019 & 2032
- Table 85: Germany Food Sweetener Market Revenue (Million) Forecast, by Application 2019 & 2032
- Table 86: Germany Food Sweetener Market Volume (K Tons) Forecast, by Application 2019 & 2032
- Table 87: France Food Sweetener Market Revenue (Million) Forecast, by Application 2019 & 2032
- Table 88: France Food Sweetener Market Volume (K Tons) Forecast, by Application 2019 & 2032
- Table 89: Spain Food Sweetener Market Revenue (Million) Forecast, by Application 2019 & 2032
- Table 90: Spain Food Sweetener Market Volume (K Tons) Forecast, by Application 2019 & 2032
- Table 91: Italy Food Sweetener Market Revenue (Million) Forecast, by Application 2019 & 2032
- Table 92: Italy Food Sweetener Market Volume (K Tons) Forecast, by Application 2019 & 2032
- Table 93: Russia Food Sweetener Market Revenue (Million) Forecast, by Application 2019 & 2032
- Table 94: Russia Food Sweetener Market Volume (K Tons) Forecast, by Application 2019 & 2032
- Table 95: Rest of Europe Food Sweetener Market Revenue (Million) Forecast, by Application 2019 & 2032
- Table 96: Rest of Europe Food Sweetener Market Volume (K Tons) Forecast, by Application 2019 & 2032
- Table 97: Global Food Sweetener Market Revenue Million Forecast, by Product Type 2019 & 2032
- Table 98: Global Food Sweetener Market Volume K Tons Forecast, by Product Type 2019 & 2032
- Table 99: Global Food Sweetener Market Revenue Million Forecast, by Application 2019 & 2032
- Table 100: Global Food Sweetener Market Volume K Tons Forecast, by Application 2019 & 2032
- Table 101: Global Food Sweetener Market Revenue Million Forecast, by Country 2019 & 2032
- Table 102: Global Food Sweetener Market Volume K Tons Forecast, by Country 2019 & 2032
- Table 103: China Food Sweetener Market Revenue (Million) Forecast, by Application 2019 & 2032
- Table 104: China Food Sweetener Market Volume (K Tons) Forecast, by Application 2019 & 2032
- Table 105: Japan Food Sweetener Market Revenue (Million) Forecast, by Application 2019 & 2032
- Table 106: Japan Food Sweetener Market Volume (K Tons) Forecast, by Application 2019 & 2032
- Table 107: India Food Sweetener Market Revenue (Million) Forecast, by Application 2019 & 2032
- Table 108: India Food Sweetener Market Volume (K Tons) Forecast, by Application 2019 & 2032
- Table 109: Australia Food Sweetener Market Revenue (Million) Forecast, by Application 2019 & 2032
- Table 110: Australia Food Sweetener Market Volume (K Tons) Forecast, by Application 2019 & 2032
- Table 111: Rest of Asia Pacific Food Sweetener Market Revenue (Million) Forecast, by Application 2019 & 2032
- Table 112: Rest of Asia Pacific Food Sweetener Market Volume (K Tons) Forecast, by Application 2019 & 2032
- Table 113: Global Food Sweetener Market Revenue Million Forecast, by Product Type 2019 & 2032
- Table 114: Global Food Sweetener Market Volume K Tons Forecast, by Product Type 2019 & 2032
- Table 115: Global Food Sweetener Market Revenue Million Forecast, by Application 2019 & 2032
- Table 116: Global Food Sweetener Market Volume K Tons Forecast, by Application 2019 & 2032
- Table 117: Global Food Sweetener Market Revenue Million Forecast, by Country 2019 & 2032
- Table 118: Global Food Sweetener Market Volume K Tons Forecast, by Country 2019 & 2032
- Table 119: Brazil Food Sweetener Market Revenue (Million) Forecast, by Application 2019 & 2032
- Table 120: Brazil Food Sweetener Market Volume (K Tons) Forecast, by Application 2019 & 2032
- Table 121: Argentina Food Sweetener Market Revenue (Million) Forecast, by Application 2019 & 2032
- Table 122: Argentina Food Sweetener Market Volume (K Tons) Forecast, by Application 2019 & 2032
- Table 123: Rest of South America Food Sweetener Market Revenue (Million) Forecast, by Application 2019 & 2032
- Table 124: Rest of South America Food Sweetener Market Volume (K Tons) Forecast, by Application 2019 & 2032
- Table 125: Global Food Sweetener Market Revenue Million Forecast, by Product Type 2019 & 2032
- Table 126: Global Food Sweetener Market Volume K Tons Forecast, by Product Type 2019 & 2032
- Table 127: Global Food Sweetener Market Revenue Million Forecast, by Application 2019 & 2032
- Table 128: Global Food Sweetener Market Volume K Tons Forecast, by Application 2019 & 2032
- Table 129: Global Food Sweetener Market Revenue Million Forecast, by Country 2019 & 2032
- Table 130: Global Food Sweetener Market Volume K Tons Forecast, by Country 2019 & 2032
- Table 131: South Africa Food Sweetener Market Revenue (Million) Forecast, by Application 2019 & 2032
- Table 132: South Africa Food Sweetener Market Volume (K Tons) Forecast, by Application 2019 & 2032
- Table 133: Saudi Arabia Food Sweetener Market Revenue (Million) Forecast, by Application 2019 & 2032
- Table 134: Saudi Arabia Food Sweetener Market Volume (K Tons) Forecast, by Application 2019 & 2032
- Table 135: Rest of Middle East and Africa Food Sweetener Market Revenue (Million) Forecast, by Application 2019 & 2032
- Table 136: Rest of Middle East and Africa Food Sweetener Market Volume (K Tons) Forecast, by Application 2019 & 2032
Frequently Asked Questions
1. What is the projected Compound Annual Growth Rate (CAGR) of the Food Sweetener Market?
The projected CAGR is approximately 2.47%.
2. Which companies are prominent players in the Food Sweetener Market?
Key companies in the market include NutraSweet Company, Cargill Incorporated, GLG Life Tech Corporation, Tereos SA, DuPont de Nemours Inc, Archer Daniels Midland Company, Ajinomoto Co Inc, Tate & Lyle PLC, Foodchem International Corporation*List Not Exhaustive, Ingredion Incorporated.
3. What are the main segments of the Food Sweetener Market?
The market segments include Product Type, Application.
4. Can you provide details about the market size?
The market size is estimated to be USD 89.87 Million as of 2022.
5. What are some drivers contributing to market growth?
Rising Application in Dietary Supplements.
6. What are the notable trends driving market growth?
Shift Toward Convenience and Processed Food Consumption.
7. Are there any restraints impacting market growth?
Increasing prevalence of hydroglycemia.
8. Can you provide examples of recent developments in the market?
September 2022: Cargill opened a corn wet mill in Pandaan to meet the growing customer needs in starches, sweeteners, and feed markets in Asia and Indonesia.
9. What pricing options are available for accessing the report?
Pricing options include single-user, multi-user, and enterprise licenses priced at USD 4750, USD 5250, and USD 8750 respectively.
10. Is the market size provided in terms of value or volume?
The market size is provided in terms of value, measured in Million and volume, measured in K Tons.
11. Are there any specific market keywords associated with the report?
Yes, the market keyword associated with the report is "Food Sweetener Market," which aids in identifying and referencing the specific market segment covered.
12. How do I determine which pricing option suits my needs best?
The pricing options vary based on user requirements and access needs. Individual users may opt for single-user licenses, while businesses requiring broader access may choose multi-user or enterprise licenses for cost-effective access to the report.
13. Are there any additional resources or data provided in the Food Sweetener Market report?
While the report offers comprehensive insights, it's advisable to review the specific contents or supplementary materials provided to ascertain if additional resources or data are available.
14. How can I stay updated on further developments or reports in the Food Sweetener Market?
To stay informed about further developments, trends, and reports in the Food Sweetener Market, consider subscribing to industry newsletters, following relevant companies and organizations, or regularly checking reputable industry news sources and publications.
Methodology
Step 1 - Identification of Relevant Samples Size from Population Database


Step 2 - Approaches for Defining Global Market Size (Value, Volume* & Price*)

Note*: In applicable scenarios
Step 3 - Data Sources
Primary Research
- Web Analytics
- Survey Reports
- Research Institute
- Latest Research Reports
- Opinion Leaders
Secondary Research
- Annual Reports
- White Paper
- Latest Press Release
- Industry Association
- Paid Database
- Investor Presentations

Step 4 - Data Triangulation
Involves using different sources of information in order to increase the validity of a study
These sources are likely to be stakeholders in a program - participants, other researchers, program staff, other community members, and so on.
Then we put all data in single framework & apply various statistical tools to find out the dynamic on the market.
During the analysis stage, feedback from the stakeholder groups would be compared to determine areas of agreement as well as areas of divergence


